


 View fulltext

2025
Volume: 54 Issue 2
24 Article(s)
Changqi XU, Haoxian WANG, Jun WANG, and Zhiquan ZHOU
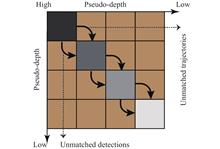
ObjectiveAlong with the continuous development of the marine economy, marine economic security is crucial. As an important research direction in marine intelligent sensing, ship multi-object tracking must consider high real-time and high accuracy. By quantitatively analyzing the matching process of the cost matrix, the sparse multi-hypothesis (SMH) matching algorithm is designed by combining the deep cascade matching (DCM) algorithm with the multiple hypothesis tracking (MHT), which improves the matching accuracy of the cost matrices while sparsifying the cost matrices and reducing the amount of computation in the matching process. Aiming at the problem of redundant parameters of the deep learning model, the YOLOv8s model is pruned using the layer-adaptive magnitude-based pruning (LAMP) algorithm to reduce the number of parameters and floating-point operations (FLOPs) of the model without reducing the accuracy of the model.MethodsFirst, the YOLOv8s model is pruned to obtain the YOLOv8s-prune model. The YOLOv8s-prune model is utilized to detect the objects for each frame in a given video sequence and obtain the object detection results. Secondly, the detection results and trajectory prediction positions are grouped based on their pseudo-depth information, which provides the basis for judging standard matching and ambiguous matching. Next, the similarity between the corresponding groups of detection results and trajectory prediction locations is calculated using IoU to obtain the cost matrix group. The hypothesis tree and standard cost matrix group are constructed by analyzing the rows and columns of each cost matrix within the cost matrix group. The hypothesis trees represent several hypotheses composed of the trajectory prediction positions and detection results in ambiguous matching. The standard cost matrix group records the matching costs between the trajectory-predicted positions and detection results in standard matching. Finally, the optimal object tracking result can be obtained by solving the hypothesis trees and the standard cost matrix group. The problem of solving the hypothesis tree is transformed into solving the maximum weighted independent set (MWIS) problem by calculating the trajectory score and solved by the Bron-Kerbosch algorithm; The standard cost matrix group is solved by the DCM algorithm from far to near based on the pseudo-depth information.Results and DiscussionsIn comparisons with other trackers, SMH outperforms other object trackers in most metrics, which shows that SMH is more robust and effective (Tab.1). In the experiment on speed between MHT and SMH, SMH is faster with lower computational complexity (Tab.2). In the comparison experiments between YOLOv8s and YOLOv8s-prune, the number of YOLOv8s-prune parameters and the amount of FLOPs decreased dramatically. However, the accuracy of YOLOv8s-prune does not decrease a lot and even improved a little (Tab.3). In ablation experiments, SMH outperforms baseline and YOLOv8s-prune does not have an enormous impact on the accuracy of the tracker (Tab.4). In the tracking visualization between BoT-SORT and SMH, SMH can follow the original track number without assigning new track number when re-tracking a lost trajectory (Fig.10). In the response visualization of feature map, for small objects, YOLOv8s-prune has a weaker response to the object; For large objects, YOLOv8s-prune has a weaker response to the object boundary (Fig.11). In the channels visualization between YOLOv8s and YOLOv8s-prune, the results show that many channels in the large convolution kernel contribute weakly to the accuracy of the model. The modules with fewer channels are preserved (Fig.12).ConclusionsA lightweight infrared multi-object tracking algorithm based on sparse multi-hypothesis matching is proposed to address the problems of ambiguous matching and the slow inference speed of deep learning-based object detectors. SMH combines the DCM algorithm with the MHT algorithm, outperforming existing multi-object tracking algorithms. Compared with YOLOv8s, the YOLOv8s-prune model obtained by the LAMP pruning algorithm has fewer parameters and floating-point operations. In the future, we plan to explore the temporal information in the video and combine it with the current spatial matching methods to improve the multi-object tracking effect.
Feb. 25, 2025Vol. 54 Issue 2 20240373 (2025)
Mu LI, Yilang ZHANG, and Xizheng KE
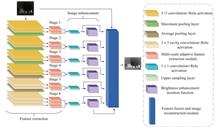
ObjectiveIn recent years, with the development of infrared sensor technology, many image processing applications based on infrared images have emerged. Infrared images can provide 24/7 information that the human eye can't see. Therefore, infrared image is widely used in monitoring, industry, military and other fields. Unlike visible light images captured by ordinary sensors, infrared images typically have low contrast, contain blurred edges, and a lot of noise. The reason for the low contrast and blurred edges is that usually the foreground and background have similar temperatures. Low contrast and blurred edges will produce low-quality infrared images. In addition, infrared images have a low signal-to-noise ratio due to the infrared sensor and readout circuit of infrared cameras, which leads to low signal and high noise problems that further degrade infrared image quality. And low-quality infrared images can bring many difficulties to further analysis, such as object recognition and image fusion. It is best to use effective infrared image enhancement techniques to produce high-quality infrared images, that is, high contrast, clear detail and less noise.MethodsIn this paper, an infrared image enhancement algorithm based on multi-scale feature extraction and fusion is proposed. Firstly, a multi-scale adaptive feature extraction fusion module is designed, which fuses convolution features detected at multiple levels based on multi-layer feature fusion to fully preserve details in image reconstruction. The Global Attention Mechanism (GAM) is introduced into the multi-scale adaptive feature extraction fusion module, which can amplify the interdimensional interaction, obtain the features of three dimensions at the same time, avoid information loss, and retain more feature information. Then, the luminance enhancement iteration function is designed, using the fusion features of different levels as the pixel parameters of the iteration function to avoid the problem of local exposure. Finally, a feature fusion and image reconstruction module is designed. After two convolution with residual structures, convolution with different expansion rates is used to form a double-branch structure, which can enhance feature propagation. Finally, the cross-channel information fusion is realized by using two convolution. This paper outputs the characteristics of each convolution layer in 6 stages.Results and DiscussionsBased on the above methods, two different data sets were first selected for subjective comparison (Fig.10, Fig.11) and objective index evaluation (Tab.1, Tab.2) between the proposed algorithm and five other popular image enhancement algorithms. The results showed that whether the text algorithm was applied to self-built data sets or MSRS public data sets. The brightness enhancement is moderate and is almost the best among all algorithms in texture feature retention, indicating that the proposed algorithm has good performance and high applicability in feature integrity preservation and brightness enhancement. Then, the multi-scale network structure (Tab.3); The overall aspect of the algorithm in this paper (Tab.4); The results of the ablation experiments on the selection of different dilatation convolution rates (Tab.5) and the selection of parameters of the luminance enhancement iteration function (Tab.6) show that the proposed algorithm performs well in various improvement choices. Finally, in order to ensure the application effectiveness of the image enhancement algorithm in this paper, the STS (Single Shot MultiBox Detector-Threshold Segmentation) fire hazard detection algorithm is introduced. The proposed algorithm was compared with the images enhanced by other five algorithms for fire hazard detection (Fig.13, Tab.7). According to the results, the accuracy rate of early fire detection of the proposed algorithm was 97.86%, the accuracy rate of hidden hazards and non-hidden hazards in the images were 97.13% and 98.59%, respectively, and the false detection rate was 1.02%. Compared with the five algorithms in the above literatures, the results increased by 9.11, 5.96, 16.31, 4.95 and 4.15 percentage points respectively. Moreover, the above evaluation indicators are consistent with the results of the subjective evaluation method in Fig.10, which proves that the algorithm has a good effect on early fire detection.ConclusionsIn this paper, an infrared image enhancement algorithm with multi-scale feature extraction and fusion is proposed. Firstly, multi-scale adaptive feature extraction module with global attention mechanism is introduced to extract multi-scale features from input images, and multi-channel Concat is performed to obtain finer texture features. Then, the luminance enhancement iteration function using fusion feature graph as parameter is used to generate global enhancement through multiple iterations. Finally, the proposed feature fusion and image reconstruction module fuses various features to obtain enhanced infrared images. Theoretical analysis and experimental results show that the proposed algorithm is more competitive than the more mature enhancement methods in recent years on both self-built and MSRS public data sets. And the enhanced early fire warning algorithm application experiment is carried out, which shows the effectiveness and feasibility of the infrared image enhancement algorithm of multi-scale feature extraction and fusion in this paper.
Feb. 25, 2025Vol. 54 Issue 2 20240400 (2025)
Yongxin WANG, Huilin XIA, He JIANG, and Qing WU
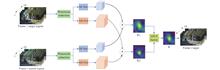
ObjectiveHyperspectral images capture spectral information across dozens or even hundreds of bands at each pixel location, far exceeding the three bands of RGB images, thereby providing richer and more detailed spectral data. By leveraging the abundant spectral information contained in hyperspectral images, limitations of current visible light-based target tracking methods under complex scenarios, such as background clutter, illumination variations, and motion blur, can be overcome. To address the challenge of background clutter in hyperspectral target tracking, a siamese fusion hyperspectral target tracking method based on spectral segmentation was proposed.MethodsDue to the high dimensionality and large volume of hyperspectral images, direct processing would consume significant computational resources, necessitating appropriate dimensionality reduction to mitigate data redundancy while preserving crucial spectral information. In the first frame of the video, the target and search regions are manually defined. Initially, spectral deviation segmentation is employed to obtain the target spectral curve, which is then utilized in spectral angle distance computation for dimensionality reduction. Following this, the reduced-dimensionality images are individually fed into a Semantic Parsing Network (SP-Net) and an Appearance Descriptor Network (AD-Net) for the extraction of deep and shallow features, respectively. Shallow features, often sensitive to subtle changes, capture detailed information such as texture and color, which are vital for recognizing the target's appearance. Conversely, deep features focus more on high-level semantic information like shape and category, providing more stable and discriminative features that aid the model in distinguishing targets from backgrounds in complex scenes. By combining AD-Net and SP-Net, the advantages of both are fully leveraged, enhancing tracking robustness and accuracy. The extracted target region features and search region features undergo cross-correlation to generate two initial response maps, which are then fused using a peak-to-correlation energy-based response map fusion approach. The final response map determines the target's location.Results and DiscussionsTo validate the effectiveness of the proposed algorithm in this paper, six trackers were selected as comparative algorithms, including four hyperspectral target tracking algorithms and two RGB target tracking algorithms. This paper presents the experimental results in image form. From the qualitative analysis diagram in Fig.5, it can be observed that the proposed algorithm possesses strong anti-interference capabilities, effectively dealing with noise and distracting information in complex backgrounds, thereby ensuring stability and reliability of target tracking in dynamic scenes. Figures 6-8 respectively demonstrate the success rate and precision of each algorithm on the test sequences, as well as their performance under background clutter and illumination variation challenges. Tables 1 and 2 correspond to the accuracy and success rates of the proposed algorithm and the comparative algorithms. As seen from Tables 1 and 2, the proposed algorithm exhibits excellent tracking performance. It achieves a success rate of 63.8% on all test sequences, ranking first and surpassing the second-ranked algorithm by 0.23%. In terms of precision, it scores 84.78%, ranking second and only 0.04% lower than the top algorithm. Overall, the proposed algorithm remains competitive. Under the BC challenge, by combining shallow appearance information with deep semantic features, the algorithm achieves a success rate of 69.98%, surpassing the second-best by 4.48%, and a precision of 89.66%, outperforming the second-ranked algorithm by 0.59%. For the IV challenge, the algorithm demonstrates robust generalization capabilities, with a success rate of 60.53%, 7.16% higher than the second-best, and a precision of 83.52%, 0.48% higher than the second-ranked algorithm. Table 3 presents the results of ablation experiments, indicating that the proposed algorithm with all modules preserved demonstrates superior performance.ConclusionsAddressing the challenge of background clutter in hyperspectral video target tracking algorithms, this paper proposes a hyperspectral target tracking algorithm based on spectral deviation segmentation and dual-siamese fusion. This algorithm utilizes spectral deviation segmentation to reduce data redundancy, separate the target from the background, and obtain the target spectral curve for dimensionality reduction. AD-Net and SP-Net are employed to extract appearance detail information and deep semantic information, respectively. A dual-siamese network is then adopted to generate two target response maps, which are fused using average peak-to-correlation energy, enabling target tracking. Experimental results demonstrate that the proposed algorithm outperforms other algorithms in terms of target tracking stability under background clutter challenges, effectively addressing this challenge. Furthermore, future work will explore the use of the current advanced Transformer framework to tackle scale deformation challenges in hyperspectral target tracking, thereby enhancing the generality and adaptability of the tracking algorithm.
Feb. 25, 2025Vol. 54 Issue 2 20240525 (2025)
Xin LIU, Jingjin WANG, Qingmei LIU, Zikang JIANG, Zhaopeng XU, and Xiaoying LI
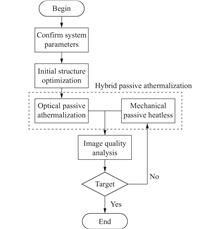
ObjectiveIn recent years, with the continuous development of optical technology, infrared systems have become the focus and hot spot of research from all walks of life and have a wide range of applications in military and civilian fields. However, these fields have extremely high requirements for the imaging quality and environmental adaptability of lenses. Long-wave infrared usually refers to the 8-12 μm region in the infrared spectral range, which covers the main wavelength band of thermal radiation of objects at room temperature, with a wide wavelength range, which can capture infrared radiation with a longer wavelength. The influence of temperature changes must be considered in advance before the design of the optical system in this wide wavelength band, and the athermalized design of the optical system plays a crucial role. In optical system design, due to the imperfect nature of optical components, heat is generated and leads to a series of problems, such as focal distance shift, optical distortion, spot diffusion, etc. In order to solve these problems, the athermalized design of the optical system came into being. The key to a thermal-free design is to minimize the effects of heat throughout the design process and to ensure that the optics maintain a stable temperature and good image quality during operation.MethodsIn order to keep the performance of the infrared system stable at different temperatures, thereby reducing or eliminating aberrations and image quality degradation due to temperature changes. In this paper, the combination of optical passive athermalized and mechanical passive athermalized is used to design a long-wave infrared system with a large field of view. The optical system adopts the refractive structure, firstly, the designed infrared system is designed with optical passive athermalized, and its imaging quality is analyzed, if the imaging quality is not ideal, the mechanical design is carried out based on mechanical passive athermalized to improve the imaging quality.Results and DiscussionsThe working band of the system is 8-12 μm, the focal length is 45 mm, and the F-number is 1, and it can work stably in the temperature range of -40-65. At the cut-off frequency of 42 lp/mm, the MTF is greater than 0.3 on the axis and greater than 0.25 on the axis, and the MTF is not much different at different temperatures, and the imaging quality meets the requirements. The RMS radius at different temperatures is not much different and the imaging quality is good, which meets the design index. The distortion of the system is less than 2% at room temperature, which meets the design index. And the tolerance analysis of the optical system was carried out, using the Monte Carlo analysis method, the tolerance calculation mode was sensitivity, and the diffraction MTF was averaged, and 500 simulations were carried out to obtain the tolerance analysis in the case of -40, 20 and 65, and the analysis results showed that the system performance was good and met the design requirements.ConclusionsThe system adopts the combination of optical passive athermalized and mechanical passive athermalized, that is, hybrid passive athermalized, and designs a large field of view long-wave infrared optical system. The operating band is 8-12 μm, the F-number is 1, the focal length is 45 mm, and the working temperature is -40-65 ℃. The imaging quality of the system is good, the performance of the system is stable at different temperatures, and the tolerance range meets the actual processing needs. For the use of hybrid passive athermalized design method, if only optical passive athermalized needs to consider the characteristics of multiple materials, and the design can only be carried out by reasonable allocation of optical lenses, which is more complicated. The mechanical passive athermalized design also needs to understand the characteristics of a variety of structural materials, and the mechanical structure design is more complex, so the hybrid passive athermalized design is used to design, the optical design is relatively simple, and the structure is relatively miniaturized.
Feb. 25, 2025Vol. 54 Issue 2 20240360 (2025)
Chonghao GAN, Wenlin FENG, Xiangzhi LIU, Xiaozhan YANG, Xiangmeng LU, Dajian CUI, and Cong CHEN
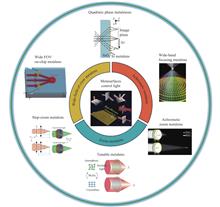
Significance Advances in metalens technology have had an important impact on the development of optics. Different from traditional lenses, metalens materials are not limited to the intrinsic permittivity and permeability of natural materials. Metalenses are composed of artificially designed sub-wavelength cell structures, and the optical wavefront is manipulated through phase mutations, breaking through the limitations of the shape and thickness of the lens surface and achieving super-resolution imaging. Due to its advantages of lightness thinness, compactness and high integration, metalenses improve the excessive volume and mass of traditional lenses, meet the miniaturization needs of modern complex optical systems, and meet the needs of current portable devices for fast and stable imaging. Large field of view metalenses, achromatic metalenses and zoom metalenses are the representative elements of metalens imaging, which have great advantages in the design of optical systems. Large field of view metalenses have a larger field of view and can be integrated with image sensors, improving the detection range of small devices such as lidar and planar cameras. Achromatic metalenses have a wider working bandwidth, which solves the problem that traditional light field cameras cannot broadband achromatic, and has broad application prospects in the fields of robot vision and vehicle sensing, and is of great significance for multispectral analysis and optical communication. The zoom lens has flexible focal length variation, improves the large size and weight of traditional zoom lenses, and solves the problem of liquid zoom lenses being susceptible to interference, providing fast response times in vision systems for biological microscopy, multi-depth imaging, and autonomous vehicles. The design methods of existing large field of view metalenses, achromatic metalenses, and zoom metalenses are summarized, their existing problems are analyzed, and the challenges faced by metalenses are studied, including the trade-offs between chromatic aberration correction and field of view, the improvement of numerical aperture, and the improvement of zoom stability and efficiency, and predict the development trend of metalenses. The insights and advances presented in this study are expected to inspire further exploration and application of metalenses, paving the way for next-generation optical technologies.Progress Different phase control principles of metal lenses, the corresponding metal lenses, their advantages and applications are introduced. The design methods of three metal lenses with different functions are reviewed, the principles and application scope of these metal lenses are summarized, and the shortcomings and future development trends of metal lenses are analyzed. The three types of metalenses are: 1) Large field of view metalenses, including those that rotate bilayer metasurfaces to achieve large field of view focusing, and metalens arrays integrated with CMOS. 2) Achromatic metalenses, including metalenses with separate wavelength focusing, metalenses with simultaneous control of transmission phase and geometric phase, and metalenses with complementary unit structures and shapes. 3) Zoom metalenses, including those that zoom by adjusting the crystalline state of the unit cell structure material, and those that are focused by wavelength changes. Combined with the actual needs of metalenses, the above different functions can be combined and designed, such as the secondary phase metalens that realizes the function of large field of view and achromatic at the same time, and the metalens that adjusts the focal length through mechanical steps to achieve the function of large field of view and zoom. Throughout the discussion, we emphasized the importance of focusing on performance parameters such as efficiency, NA, FOV, etc., which are the benchmarks for evaluating the effectiveness of metalenses in real-world applications. Finally, we discussed the challenges faced by the development of metalenses, which have certain guiding significance for the future development of metalenses.Conclusions and Prospects The major progress made in the basic principles, unit structures and lens materials of metal lenses is summarized, and the development history and technical route of large field of view, achromatic and zoom metal lenses are presented. This article analyzes these metalens focusing techniques and discusses key performance indicators such as working bandwidth, focusing efficiency, NA, field of view, zoom range, etc. At the same time, the application scenarios and challenges of existing metalenses with large field of view, achromatic and zoom are also analyzed. Finally, some suggestions are put forward for the future development of metalenses, including how to balance the large field of view and working bandwidth, how to balance the achromatic function and high NA, and how to achieve high-speed and stable zoom. In summary, the design research of metalenses will promote the development of the next generation of high-performance, high-efficiency, and high-integration optical systems and display systems.
Feb. 25, 2025Vol. 54 Issue 2 20240441 (2025)
Lei LI, Zebin WANG, Qingyu MENG, Dong WANG, Haixin ZHANG, and Meichen LIU
ObjectiveSpace optical imaging is a pivotal method for information acquisition, offering significant potential across various domains, including space exploration, astronomical observation, and aerospace applications. Space cameras are characterized by their high light-gathering capacity and detection sensitivity. Furthermore, the design of these cameras often involves increasing the aperture and field of view to expand the observation range and enhance the acquisition of detailed information regarding celestial targets. However, this expansion renders space cameras more susceptible to interference from both natural and artificial light sources. Such interference can adversely affect imaging capabilities, leading to issues such as signal disruption, limitations in dynamic range, spectral interference, and degradation of image quality. In severe cases, it may result in image saturation, thereby compromising the safety and operational lifespan of the camera. Consequently, it is evident that an effective glare protection system is essential for ensuring the optimal operational performance of space cameras.MethodsThrough the study of previous imaging optical strong light protection systems, the existing active and passive protection measures are enumerated. The relationship between the glare characteristics of CMOS cameras and the energy distribution at the camera entrance pupil under different optical parameters is analyzed. A primary active-passive protection system is established by selecting sensor-controlled mechanical shutters and notch filters. In terms of active protection, based on the logarithmic linear correlation between the saturated area of the pixel and the saturated area of the incident light intensity, system parameters are introduced to derive the saturation threshold for detector interference in optical cameras. Subsequently, a logical circuit design is implemented for the sensor to provide protection according to the analyzed saturation threshold results. For passive protection, a 632.8 nm notch filter is chosen to shield against strong light in a specific wavelength band. Ultimately, a primary and passive protection system is designed, characterized by a high protection threshold, short response time, and strong protective capability.Results and DiscussionsThis study designs an active-passive protection system tailored for a fixed-focus optical lens with an F-number of 1.4 and constructs a desktop experimental system to validate the effectiveness of this method. In the context of active protection, Figure 8 illustrates the imaging results and grayscale distribution of the camera under 20 mW laser illumination, during which the detector's saturated area reached 106 μm, accounting for one-third of the total detector area. When the incident laser power was increased to 40 mW, the imaging results and grayscale distribution shown in Fig.9 indicate that the entire detector was nearly fully saturated under this laser power density, resulting in a complete loss of the camera's imaging capability due to the intense light source. A logic circuit was designed to control the mechanical shutter, allowing it to close within 10 ms when the light voltage exceeds a threshold, as illustrated in Fig.10. For passive protection, Figure 11 presents the imaging and detector gray scale distribution of the optical camera with filters under 20 mW laser irradiation. The internal scattering effects and ghost images caused by strong light are significantly reduced, with the detector's saturation range being only 1/100 of that without notch filters. When the laser output power is adjusted to 50 mW, Figure 12 shows that although the scattering effects become more pronounced with increasing laser power density, the camera is still able to capture clear images of the target, and the saturation area of the detector remains substantially smaller than without the notch filter. Figure 11 and 12 visually demonstrate the effectiveness of the passive protection measures, particularly the installation of the notch filter. The final design of the active-passive protection system effectively safeguards the camera in the visible light spectrum, ensuring stability under strong light disturbances while maintaining the imaging quality of the space camera.ConclusionsBased on the high sensitivity characteristics of spaceborne optical cameras, this study analyzes the glare characteristics of camera detectors under various optical parameters and designs an active-passive protection system utilizing mechanical shutters and notch filters to counter strong light interference. This system exhibits reliable protective capabilities in the visible light spectrum. The active protection mechanism is capable of rapid response when the camera's saturated area reaches one-third of the total area, with a response time of approximately 10 ms, effectively ensuring the camera's safety under strong light interference. In the case of 632.8 nm helium-neon laser interference, the system reduces the detector's saturated area to one-hundredth of its original size, significantly enhancing the camera's operational efficiency. The system has been optimized based on technological maturity and engineering application experience, and its effectiveness has been validated through a desktop experimental setup.
Feb. 25, 2025Vol. 54 Issue 2 20240501 (2025)

Zhuorui TANG, Chaobin MAO, Yinghuai ZHANG, Chang FENG, Minyan QIU, Cheng HU, and Xin ZHANG
ObjectiveThe full-aperture surface measurement of the secondary mirror was always a difficult problem in interferometric testing. In order to realize the full-aperture testing of coaxial high-order SiC aspherical mirror, a null compensation measurement model based on CGH was proposed. With this model, the null compensation testing for a 90 mm aperture high-order SiC aspherical mirror was designed. By calibrating the influence of the transmission wave aberration of CGH in the test results and removing it in the secondary mirror test results, the accurate CGH null compensation testing of the high-order SiC aspherical secondary mirror could be effectively realized. This method could provide technical support for the high-precision manufacturing of aspherical secondary mirror in aerospace.MethodsIn order to realize the CGH compensation design of the high-order SiC aspherical secondary mirror, combined with the engineering example, the CGH null compensation design of the interferometer plane wave incident was carried out on a high-order SiC aspheric secondary mirror with an aperture of 90 mm, a vertex curvature radius of 422.6 mm, a quadratic term coefficient of 9.1, an aspheric high-order term A4 coefficient of 3.92, and an A6 coefficient of 4.72. The design of the optical path was shown in Fig.2. In order to accurately realize the high-precision alignment of the interferometer, CGH and the SiC aspherical secondary mirror to be tested, the interferometer and CGH alignment area on the CGH were designed at the same time, as shown in the blue area in Fig.2. It formed dry fringes with the reflected light of the standard lens in the interferometer through reflection diffraction. By adjusting the position of the CGH, the fringes became zero fringes. At this time, the interferometer and the CGH were strictly aligned. The green area in Fig.2 was the aspherical secondary mirror testing area, which finally completed the surface map measurement of the convex aspherical mirror.Results and DiscussionsFrom the design analysis of this paper, it could be concluded that based on the secondary mirror compensation design method in this paper, the RMS value of the theoretical design accuracy of the compensation design was 0 nm, which verified the accuracy of the design method in this paper. At the same time, the interference testing and error analysis on the secondary mirror were carried out. The RMS value of the full-aperture surface testing result reached 0.015λ (λ=632.8 nm) (Fig.8) and the relative RMS value was 0.016λ (λ=632.8 nm) (Fig.11) after calibration, which further verified the reliability of the proposed method.ConclusionsIn this paper, a design method of null compensation CGH for high-order SiC aspherical secondary mirror was proposed. In order to achieve a more accurate full-aperture measurement of the secondary mirror surface map, the transmission wave aberration effect of CGH was calibrated in the test results and removed in the secondary mirror test results. According to the CGH design method of high-order aspheric secondary mirror and the experimental results in the testing, it could be seen that the design method described in this paper could effectively realized the CGH null compensation design of high-order aspheric secondary mirror. At the same time, according to the error analysis results, this paper effectively calibrated the influence of CGH transmission wave aberration on the secondary mirror interference testing results, which could provide technical support for the high-precision manufacturing of aspherical secondary mirrors.
Feb. 25, 2025Vol. 54 Issue 2 20240519 (2025)
Yusheng ZHANG, Xiangming GUO, Zhenwei ZHAO, Shifeng KANG, and Qiang ZHAO
ObjectiveThe infrared band is an electromagnetic band between microwave and visible light, which covers the thermal radiation emitted by objects at room temperature. Its unique properties can be widely used in fields such as detection and communication. When it is under sea fog conditions, due to the large amount of water vapor and droplets within the sea fog range, the electromagnetic wave energy in the infrared band is severely attenuated by the absorption and scattering of water vapor, resulting in a serious decrease or even failure of the infrared electronic information system. The Arctic shipping route is the shortest straight-line distance from North Asian countries to North American and Nordic countries. In this region, sea fog is frequent, and there are few numerical simulations (forecasts) of sea fog in the Arctic region. There are even fewer reports on infrared wave propagation attenuation forecasts based on sea fog conditions. With the increasing demand for Arctic applications and the continuous development of technology, Arctic sea fog forecasting and infrared wave propagation attenuation forecasting under sea fog conditions are issues that must be faced and studied. This article addresses the need for performance prediction of infrared wave electronic systems in Arctic navigation and aviation activities, and achieves prediction of infrared wave propagation attenuation under Arctic sea fog.Methods Firstly, this article uses the polar numerical model PWRF (polar WRF) to improve the Noah land surface process scheme, long wave radiation scheme, RRTMG scheme, and optimize the feature height and integration steps. The infrared wave propagation attenuation under Arctic sea fog was successfully forecasted (simulated) to forecast (simulate) the infrared wave propagation attenuation under Arctic sea fog when the Chinese fourth Arctic research team encountered an accident in the Arctic Ocean on the polar research ship "Xuelong". Secondly, due to the complexity of measuring fog droplet spectra and the difficulty of ensuring real-time accuracy, this paper further utilizes the size distribution relationship between advection fog and radiation fog obtained from visibility and fog liquid water content to derive the fog droplet spectra of sea fog, usually advection fog. Thirdly, based on the forecast information of the occurrence area of sea fog and the spectral characteristics of fog droplets, as well as the theory of Mie scattering and Rayleigh scattering methods, this article has achieved the forecast of high and low attenuation effects of far, medium, and near infrared wavelengths. When the infrared wavelength is equivalent to the size of the fog droplet, the Mie scattering attenuation relationship equation is used to predict the infrared wavelength of sea fog attenuation, and the infrared wavelength of sea fog attenuation is predicted. Through Rayleigh scattering, the wavelength of some wavelengths is greater than the size of the fog droplet, and the wavelength of some wavelengths is greater than the size of the droplet. The ejection of ocean waves was achieved through Rayleigh scattering method. Fourthly, the attenuation fitting results were compared with the measured infrared wavelength of 10.6 µm in relevant literature. Under the same conditions, the 24-hour prediction error of this method was only about 4%, ensuring a certain level of accuracy.Results and Discussions Through comparative analysis, for waves with the same moisture content greater than or equal to 0.5 g·m-3 or above, the difference in forecasted wavelength attenuation values between the high and low ends of the far-infrared band is the largest, followed by the high and low ends of the mid infrared band, and the difference between the high and low ends of the near-infrared band is the smallest(Fig.3 and Fig.4); By comparing the attenuation fitting results with 10.6 µm infrared wavelength measurement data, this method can accurately forecast 24-hour forecasts under the same conditions. By comparing the attenuation fitted with infrared data measured at 10.6 µm wavelength in relevant literature, under the same conditions, the 24-hour forecast error of this method is only about 4%(Fig.4). This indicates that the infrared attenuation forecast method based on the advection wave scattering method is reasonable and reliable, with a certain degree of accuracy guarantee. This provides forecast support for the pre assessment of the effectiveness of infrared systems in the Arctic region, as well as for effective use planning and maximizing their effectiveness.
Feb. 25, 2025Vol. 54 Issue 2 20240277 (2025)
Sujun LI, Mu GU, Xiang PENG, Xuefeng LAI, and Jinmei ZHOU
ObjectiveInfrared radiation characteristic measurement is one of the fundamental technologies for obtaining target infrared radiation characteristics, target infrared detection and recognition, and target infrared stealth evaluation. The rapid development of new offensive and defensive technologies requires infrared radiation measurement system to develop direction of large aperture, high dynamic, and high precision. Infrared radiation measurement accuracy of the system is affected by many factors such as environmental temperature, calibration error, atmospheric correction error, and detector stability. How to perform high-precision large aperture and high dynamic calibration on the measurement system, and how to compensate for the impact of environmental temperature changes on measurement accuracy are urgent technical difficulties that need to be solved. Therefore, based on the distributed reference cascade calibration, Aiming at the influence of external environment on measuring system temperature, the differential model of system thermal radiation is proposed to suppress the influence of system temperature change, improve the calibration accuracy, measurement accuracy, and environmental temperature adaptability of the calibration results.MethodsThis paper takes the distributed reference cascaded calibration method as the basis, analyzes the mechanism of the calibration error and measurement error caused by temperature change in the infrared radiation measurement system, and establishes a simple and feasible system thermal radiation differential model. Based on the uniform background with known radiation quantity, the system thermal radiation is differentiated during the calibration and measurement process to suppress the influence of system thermal radiation change on measurement accuracy. Based on a 450 mm aperture radiation measurement system, relevant experiments are conducted to verify the high dynamic measurement accuracy under different environmental temperatures.Results and DiscussionsIn response to the demand for large aperture, high dynamic range, and high-precision infrared radiation measurement, a distributed reference cascade calibration method is used as the basis to analyze the mechanism of radiation measurement errors caused by changes in external environment or calibration light source temperature. A system thermal radiation differential model is proposed, which does not require complex model calculations of the system's own thermal radiation or complex experiments to establish the relationship between system temperature and grayscale drift. High precision measurement can be achieved without increasing the complexity of the system structure. After adopting the model, the radiation calibration error was reduced from 9.81% to 1.58%, and the radiation measurement error was reduced from 96.46% to 4.34% under different environmental temperature differences. This effectively reduces the measurement errors caused by rapid changes in local temperature due to external calibration light sources and overall temperature changes due to environmental temperature, improves the calibration accuracy and measurement accuracy of large aperture infrared radiation measurement systems, expands the temperature adaptability range of the calibration coefficient, and reduces the calibration frequency. In addition, this model has a better suppression effect on low radiation levels and has a natural advantage in measuring weak targets at long distances in external fields.ConclusionsThis paper, based on the theory of infrared radiation characteristic measurement, conducts an in-depth analysis of the principle of distributed reference cascaded calibration method, and then analyzes the mechanisms of radiation measurement errors caused by changes in environmental temperature and the calibration light source. A simple and feasible system thermal radiation differential model is proposed. Based on the model presented in this article, multiple experiments were conducted using a radiation measurement system with a 450 mm aperture in both laboratory and outdoor environments at different temperatures. The experimental results show that the model can effectively improve the calibration accuracy, measurement accuracy, and environmental temperature adaptability of the calibration coefficient by using only a uniform background with known radiation, and has good feasibility and applicability.
Feb. 25, 2025Vol. 54 Issue 2 20240511 (2025)
Jing HE, Quancheng LIU, Zhonggang XIONG, and Linyu CHEN
ObjectiveChemometrics is one of the most effective analytical methods among various laser-induced breakdown spectroscopy (LIBS) techniques, with principal component analysis (PCA) and partial least squares regression (PLSR) being the most typical. The above two methods perform linear feature transformation on the original spectra to reduce the issue of redundant spectral lines. It failed to determine which spectral lines are redundant although the achieved features can represent the effective information of the original spectra, finally resulting in poorer physical interpretability of the above two models. Elastic Net is a feature selection and regression modeling method that not only allows nonlinear feature dimensionality reduction of the original spectrum, but also eliminates the multicollinearity problem between spectral lines. Compared to PCA and PLSR, the Elastic Net model has a stronger capacity for model interpretation, and its regression coefficients directly reflect the influence of all original features on the response variable. To insight into the impact of effective spectral lines on quantitative results and to further comprehend the physical implications of LIBS quantitative analysis, this paper proposes three generalized linear models (GLM), Lasso, Ridge, and Elastic Net, to predict the copper content in raw copper ores/concentrates.MethodsTo understand the physical significance of the original spectral lines in the dimensional reduction-quantitative models, Lasso, Ridge, and Elastic Net were utilized to determine the copper content in raw copper ores/concentrates. A spectrum acquisition device was designed using a nanosecond laser and an Echelle spectrometer (Fig.1). Five types of copper ores and four types of copper concentrates were selected as sample materials, finally obtained nine pieces of copper ore tablets (Fig.2). The gate delay of the spectrometer was set to 1 μs with a gate width of 2 μs. A total of 90 spectra were obtained from the nine types of copper ores/concentrates, of which 70 spectrums were used for training and the remaining 20 spectrums were used for testing (Tab.1). A brief analysis of the spectral characteristics of the nine types of copper ores/concentrates was conducted, identifying 11 atomic lines and 18 ionic lines for the subsequent procedure. The impact of parameter α in the Elastic Net model on the mean square error (MSE) of the validation/prediction set, and the number of valid analyzed spectral lines was analyzed in detail (Fig.4). Compare the proposed GLM methods (Lasso, Ridge, and Elastic Net) with five other methods: ordinary least squares (OLS), PLSR, support vector regression based on particle swarm optimization (PSO-SVR), Lasso-PSO-SVR, and Elastic Net-PSO-SVR. R², mean square error (MSE), and mean absolute percentage error (MAPE) were adopted to evaluate the performance of the eight models. Given the rare samples in this paper, leave-one-out cross-validation and paired T-tests were utilized to observe the statistical significance between the Elastic Net and PLSR models.Results and DiscussionsQuantitative results indicate that the MSE of the testing sets for Lasso, Ridge, and Elastic Net were 1.706, 1.180, and 1.231, respectively (Tab.2). Compared to PLSR, the MSE of the above three methods was reduced by 7.4%, 33.2%, and 36.0%, respectively. In both the Ridge and Elastic Net models, all analyzed spectral lines were retained (Fig.5), while Lasso excluded 5 ionic spectral lines (217.941 nm, 218.963 nm, 221.027 nm, 221.811 nm, 229.437 nm) and 3 atomic spectral lines (249.215 nm, 327.396 nm, 510.554 nm). Significance analysis results (Tab.3, Tab.4) showed that overall performance of the Ridge and Elastic Net models is superior to traditional PLSR, while the performance of the Lasso model is comparable to PLSR.ConclusionsCompared to traditional and improved methods, the proposed three GLM methods (Lasso, Ridge, and Elastic Net) in this paper demonstrate a higher model fitting capability and generalization ability, while also maintaining a significant predictive advantage in small data sets. This provides a new approach for the detection of Cu element content in rare natural copper ores.
Feb. 25, 2025Vol. 54 Issue 2 20240455 (2025)
Yulong JIN, Xin ZHANG, Jingyuan YAO, Shuai GU, and Pu WANG
ObjectiveThe hollow core anti-resonant fiber (HC-ARF) with a special cladding structure is designed to confine more than 99.99% of the transmitted optical energy within the air core, greatly reducing the influence of cladding material properties on fiber transmission performance. However, when the transmission wavelength exceeds 2.4 μm, the fiber absorption loss increases exponentially, and it becomes challenging to further reduce the transmission loss in the 3-5 μm wavelength range by optimizing the fiber structure and fabrication process. While using fluoride, telluride, and sulfide glasses with lower phonon energy can effectively reduce the transmission loss in the mid-infrared range, there are issues such as low optical damage threshold, poor mechanical performance, and difficulties in fabrication, which limit their practical applications. To address these challenges, this paper proposes a composite hollow core anti-resonant fiber with a silica-based structure and a deposited layer of soft glass material as the cladding (Fig.1). This design effectively reduces the transmission loss in the mid-infrared range and provides a new solution for flexible transmission of mid-infrared lasers.MethodsThe transmission loss of hollow core anti-resonant fiber in the mid-infrared range is mainly caused by the absorption loss of the silica material. The fiber structure proposed in this paper addresses this issue by depositing optical materials with high transmittance in the mid-infrared range on the outer side of the silica cladding. This effectively reduces the mode field overlap between the transmitted optical field in the air core and the silica material, thereby reducing the transmission loss of the fiber in the mid-infrared range.Results and DiscussionsBy utilizing finite element analysis software, the research investigated the influence of factors such as the thickness ratio of the deposited layer material and the properties of the deposited layer material on the transmission performance of the mid-infrared composite material fiber in the proposed structure. The variations in the silica cladding mode field overlap, deposited layer mode field overlap (Fig.6), absorption loss, and transmission loss (Fig.7) of the composite hollow core anti-resonant fiber were studied for different scenarios with the deposited layer material being As2S3 and the silica cladding layer thickness being 100 nm, 200 nm, and 400 nm. The results indicate that the introduction of the deposited layer material can effectively reduce the mode field overlap between the silica material in the fiber and the transmission loss in the mid-infrared range. Furthermore, for a silica cladding thickness of 400 nm, the variations in the silica cladding mode field overlap, deposited layer mode field overlap, absorption loss, and transmission loss (Fig.9) were investigated for composite hollow core anti-resonant fibers with deposited layer materials of As2S3, CaF2, and InF3. The trends show that a smaller refractive index of the deposited layer material and a larger deposited layer thickness correspond to a more significant reduction in loss.ConclusionsThe proposed composite hollow core anti-resonant fiber can effectively reduce the transmission loss of mid-infrared lasers. Through simulation calculations, the influence of factors such as the thickness ratio and properties of the deposited layer material on the transmission performance of the composite fiber is investigated. The results show that the refractive index and transmittance of the deposited layer material in the mid-infrared range have a certain impact on the transmission performance of the composite fiber. Under other fixed conditions, a higher refractive index and transmittance of the deposited layer material result in a more significant reduction in loss. When the silica layer thickness is 400 nm and the deposited layer is made of InF3 with a thickness of 1022.98 nm, the transmission loss of the composite hollow core anti-resonant fiber at a wavelength of 5 μm is 0.83 dB/m, which is approximately 48.51% lower than that of the silica-based hollow core anti-resonant fiber with the same structural parameters. It is proved that the proposed structure can effectively reduce the effect of silica material absorption loss on the transmission performance of hollow core anti-resonant fiber, and provide a new idea for mid-infrared laser flexible transmission.
Feb. 25, 2025Vol. 54 Issue 2 20240468 (2025)
Siyang LU, Jing ZHU, Zhicheng TAN, Yuting ZHANG, Jianglin CHEN, and Wei WU
ObjectiveThe main objective of this study is to unravel the microscopic mechanisms underlying the adsorption-desorption processes of volatile organic compounds (VOCs), particularly ethanol, using graphene-based materials and metal-organic frameworks (MOFs) as adsorbents. Adsorption technologies have been widely adopted in view of their high efficiency and cost-effectiveness in the treatment of VOCs, but the underlying mechanisms surrounding these processes are not well understood, which poses a major obstacle to further improvement of adsorption rates. To address this challenge, we aim to utilize the unique capabilities of terahertz time-domain spectroscopy (THz-TDS) as an emerging tool to gain insight into the dynamic interactions between adsorbents and adsorbates.MethodsIn this study, THz-TDS was employed to monitor and track the real-time adsorption-desorption dynamics of ethanol on four different graphene-based materials (rGO, FG, GO, and GO-COOH) and three MOFs (ZIF-8, ZIF-67, and MOF-177). By adjusting the experimental temperature, the variation of spectral peaks (EP) in the THz-TDS signal was systematically recorded as an indicator of adsorption-desorption behavior. In this way, we analyzed the effect of temperature on the equilibrium state of the adsorption process and deepened our understanding of the mechanism of warming-triggered desorption. In addition,the effect of temperature on the equilibrium state of the adsorption process was analyzed and the understanding of the mechanism of warming-triggered desorption was deepened. In addition, the adsorption capacity of each material was quantitatively characterized using THz-TDS and the correctness of the characterization results was explained by the physicochemical properties of the adsorbents.Results and DiscussionsThe adsorption of graphene-based materials was in the order of QGO-COOH>QFG>QGO>QrGO, while the adsorption of MOFs was in the order of QZIF-8>QZIF-67>QMOF-177. In addition, the analysis of THz-TDS signals at different temperatures (Fig.5) confirmed the existence of a warming-triggered desorption mechanism, thus revealing the dynamic equilibrium of the adsorption process. The quantitative characterization of adsorption achieved by THz-TDS provides a solid foundation for comparing the performance of different adsorbents and exploring the underlying microscopic mechanism of their interaction with ethanol.ConclusionsIn this study, the effect of temperature on the adsorption-desorption process of ethanol by four graphene-based materials and three MOFs was analyzed using THz-TDS. During the adsorption process, the EP values of all seven adsorbent materials increased with the increase of temperature, which was attributed to the transformation of the ethanol molecules from the adsorbed state to the gaseous state, with the consequent breakage of the hydrogen bonds and the corresponding weakening of the absorption of terahertz waves. Meanwhile, the adsorption (26 ℃) and desorption processes (46 ℃, 66 ℃, and 76 ℃) of four graphene-based materials and three MOFs were tracked using the THz-TDS technique, and the parameter of adsorption capacity was indirectly assessed by calculating the difference in EP between 26 ℃ and 76 ℃. The correlation between adsorption capacity and adsorption capacity is shown in the following table. The correlation between the adsorbed amounts was QGO-COOH>QFG>QGO>QrGO and QZIF-8>QZIF-67>QMOF-177, respectively, which was verified by the information of polarity, SSA, pore size distribution, and surface functional groups. This study confirms the feasibility of using THz-TDS to track the adsorption-desorption process and to indirectly characterize the adsorption amount by monitoring the hydrogen bond breakage, which provides a valuable reference to achieve efficient treatment of VOCs.
Feb. 25, 2025Vol. 54 Issue 2 20240412 (2025)
Ruiheng SIMA, Jian SONG, Chunyuan XU, Xin XU, Xiaopeng HAO, and Hong QI
ObjectiveThe primary objective of this study is to improve the accuracy and reliability of space infrared radiation measurements by developing an advanced gallium fixed-point space infrared radiation standard blackbody. By combining the gallium fixed-point with a standard blackbody, stable melting temperature curves during phase transition are reproduced, enabling precise traceability and measurement of in-orbit temperatures. This is crucial for long-term climate monitoring and ensures the traceability of climate data obtained from satellite sources. The project supports the reliable tracking of subtle climate changes over extended periods through satellite observations.MethodsThe developed gallium fixed point space infrared radiation standard blackbody includes parts such as the inner chamber, outer chamber, protective layer, constant temperature sleeve, shell, grating, and fixed structure. The inner wall is coated with a high emissivity coating, gallium of high purity is poured in, and five temperature sensors and two heating regions are set to precisely control and measure temperature (Fig.1 and Fig.2). The Monte Carlo method for emissivity simulation is a key factor in optimizing the blackbody design, and obtained a theoretical emissivity of 0.9994 through a specific chamber size (diameter of 60 mm, depth of 230 mm, 32° cone angle) as shown in Fig.3. By setting boundary solution conditions and iteratively solving using the finite element method, obtaining the thermal properties such as temperature field uniformity in the phase transition stage of the blackbody (Fig.4). In addition, conducting performance tests such as infrared spectral brightness temperature test, emissivity test, phase transition reproduction test, and radiation-contact temperature comparison.Results and DiscussionsThe implemented Gallium Fixed Point Blackbody demonstrated remarkable accuracy and stability in its performance. It achieved a radiant brightness mean temperature of 302.907 K across a wavelength range of 5 μm to 16 μm (Fig.5). The emissivity test result was 0.999 3 as show as Fig.6, slightly lower than the simulated result. Through a four-year phase change repeatability test, it was demonstrated that its long-term repeatability was within 0.003 K (Fig.7). In the radiation-contact temperature calibration comparison, the TRT radiation measurement value exhibited an overall trend consistent with the contact measurement value of the PRT embedded in a blackbody; however, the TRT measured temperature showed an average offset of approximately 25 mK on average. This difference fell within the TRT measurement accuracy. The comprehensive testing results underscored its potential for long-term deployment in space. The close correlation between simulation results and experimental data confirmed the effectiveness of the design in achieving the desired operational reliability and temperature uniformity.ConclusionsThis research has successfully developed a Gallium Fixed Point Infrared Standard Blackbody that sets new standards for accuracy and reliability in space-based infrared measurements. According to the evaluation, the standard synthesis uncertainty(k=1) is better than 0.024 K. The blackbody's capability to provide a stable, reproducible reference temperature significantly enhances the calibration accuracy of satellite radiometers. Its proven stability and precision are crucial for future satellite missions focused on climate observation and radiometric calibration, rendering it an indispensable tool in advancing climate monitoring technologies. This breakthrough marks a significant advancement in the field of space radiometry, providing robust support for ongoing and future climate research initiatives.
Feb. 25, 2025Vol. 54 Issue 2 20240401 (2025)
Chenyu LI, and Liang QU
SignificanceLaser induced breakdown spectroscopy(LIBS) is an atomic emission spectroscopy technique used for qualitative and quantitative analysis of elements, which can easily and quickly detect multiple elements. It does not require sample preparation and achieves almost non-destructive, fast, and full element analysis safely. This characteristic makes it particularly suitable for the detection of lightweight elements. The analytical capabilities of LIBS technology in different types of heritage fields are summarized, which briefly describes the basic principles and components of the equipment of this technology. LIBS could provide inspiring cases in different problems and become a beneficial tool for element characterization in the field of cultural heritage, which helps to solve the problems in element analysis in China and has certain promotion value. LIBS is a kind of laser ablation to form the plasma to analyze the substance. When atoms, ions, or molecules exist an excited state to transfer to lower energy levels or ground states, they will emit photons of specific energy to form characteristic spectra to obtain the chemical composition or other characteristics of the substance. It is considered an optical microprobe technology that has been used in various analytical applications for qualitative, semi-quantitative, and quantitative analysis of materials. The advantages of this technology are: 1) it could analyze the material in different states (such as solid, gas, liquid, and suspended particles) and also perform elemental analysis on harder materials; 2) LIBS could analyze all elements in the periodic table; 3) No pre-treatment is required for the substance, allowing for in-situ analysis with a small sample size and minimal damage to the test substance; 4) The rapid of the test is fast, and the data analysis is easy. At the same time, it could achieve online and real-time analysis. It can not only qualitatively analyze data, but also quantitatively analyze data; 5) For layered substances, it could analyze layer by layer. Based on these advantages, LIBS is widely used in fields such as aerospace, military security, environmental monitoring, and cultural heritage.Progress The application case of LIBS including the pigment, ceramic, stone, metal and so on are summarized. The IESL-FORTH has been applying LIBS technology to the field of cultural heritage protection for over 20 years and has analyzed many cases. Initially, LIBS technology was applied as a monitoring method for laser cleaning in the field of cultural relic protection. Since 2001, LIBS technology has been used for pigment analysis. Pigments are the most important component of all artistic works of painting, including paintings, murals, handmade picture books, colored sculptures, etc. Identifying the composition of pigments used in painting art works has important research significance for the artistic characteristics. It can also provide reference for the composition of art works that need to be repaired.In China, there are few departments to study the application of the LIBS. The possible reason is that LIBS has a little damage to the cultural relics. But this technology has been widely used in the foreign country to analyze the composition of the cultural relics. The specific case is as followings: Copy of Palma Vecchio's "La Bella", French miniature painting (19th century AD), LIBS spectrum of light green paint on wall painting, the campaign at the church of St George, the Historical Museum of Crete, the conservation laboratory of the Heraklion Ephorate of Antiquities, Minoan polychromed sherd, Byzantine glazed ceramic sherd, Minoan metal samples, Byzantine metal ring, Minoan metal chisel, Minoan golden bead, ceramic sample D29 and fragment of Roman sculpture, Castello Svevo, and so on.Conclusions and Prospects LIBS technology, as an emerging technology, has made rapid progress with the development of science and technology. And it has a certain theoretical basis and application cases in various industries. Foreign literature shows that there are many cases of applying LIBS technology to the field of cultural heritage, but there are few cases in China. However, applying this technology to the field of cultural heritage is effective and feasible. LIBS is an element detection method that is almost lossless or minimally lossy. Its advantages include no need for sample preparation, fast and safe operation, and the ability to achieve full element analysis. This article mainly discusses the application of LIBS technology in the field of cultural heritage from two aspects: firstly, the principle and basic equipment composition of LIBS. Secondly, typical application cases of LIBS are in different types of cultural relics. Thirdly, use LIBS technology as an evaluation tool for laser cleaning technology.
Feb. 25, 2025Vol. 54 Issue 2 20240442 (2025)
Xing LI, Bin WANG, Jinpeng LI, Rong GAO, and Xianglong MAO
ObjectiveTo effectively monitor fast-moving aerial targets such as drones, timeliness is essential. Therefore, infrared optical systems require a large field of view and fast response times to quickly detect, track, and measure targets. This demand has driven the need for relatively large-field-of-view infrared surveillance cameras. Uncooled infrared detectors offer significant advantages in target detection: they do not require additional cooling equipment, which reduces costs and maintenance complexity, and they typically provide faster response times, enabling timely capture of target changes. To achieve relatively large-field infrared monitoring of aerial targets like drones, this paper presents the design of a large-field-of-view freeform off-axis three-mirror infrared imaging system based on uncooled long-wave infrared detectors. Compared to traditional systems, this design not only expands the field of view but also enhances monitoring efficiency, making it particularly significant for the surveillance of targets such as drones.MethodsBased on the design requirements (Tab.1) and using an uncooled long-wave infrared detector (Tab.2), this paper presents the design of a large field of view freeform off-axis three-mirror infrared optical imaging system (Fig.2). Prior to the design, a mathematical analysis of key optical parameters such as focal length, field of view, resolution, and entrance pupil diameter was conducted. The surfaces of the three freeform mirrors are represented using 7th order XY polynomials (Fig.3, Tab.3), and analyses were performed on the full-field geometric spot radius, wavefront aberration, modulation transfer function, and distortion grid (Fig.4-8). Finally, a Monte Carlo algorithm was employed for tolerance analysis to assess the impact of assembly errors of the three mirrors on imaging quality (Tab.4).Results and DiscussionsThe optimized freeform off-axis three-mirror optical system provides an extensive field of view of 7.8° × 5.6°, with a maximum geometric spot radius of 3.26 micrometers, which is notably smaller than the airy spot radius (Fig.4-5). The full-field wavefront error is measured at 0.031λ at 10 micrometers, approaching the diffraction limit (Fig.6), while the modulation transfer function (MTF) at 30 lp/mm is greater than 0.455 (Fig.7). The maximum distortion occurs in the lower right corner of the image plane, approximately 2.8%, remaining below the 3% threshold (Fig.8). Taking into account the assembly tolerances of the three mirrors (Tab.4), the expected geometric spot radius for the optical system is about 6.1 micrometers with a 90% confidence level. Overall, the imaging quality analysis confirms that the design meets the specified technical requirements (Tab.1).ConclusionsThis research details the design of a large field-of-view off-axis infrared optical system, featuring an uncooled 800 pixel×600 pixel resolution long-wave infrared detector. With a focal length of 103 mm, the system achieves an impressive field of view of 7.5°×5.6° and an F-number of 1.47, demonstrating exceptional imaging performance. Our comprehensive analysis reveals that the imaging quality closely approaches the diffraction limit, as indicated by modulation transfer function (MTF) values exceeding 0.45 at a spatial cutoff frequency of 30 lp/mm across the entire field of view, while maximum distortion remains below 3%. Additionally, the size of the spot diagram is significantly smaller than a single pixel, further enhancing image quality. This advancement positions the design as a significant improvement over conventional infrared imaging systems. The combination of an expanded field of view and enhanced imaging fidelity makes this optical system particularly well-suited for applications in aerial target surveillance and infrared remote sensing, especially within unmanned aerial vehicle (UAV) contexts. Overall, this work establishes a solid foundation for future advancements in infrared imaging technology, with promising implications across various specialized fields.
Feb. 25, 2025Vol. 54 Issue 2 20240488 (2025)
Xuan TIAN, Shuquan FEI, Runze LI, Tong PENG, Junwei MIN, Siying WANG, Yuge XUE, Chen BAI, and Baoli YAO
Significance Quantitative phase imaging has the characteristics of being label-free, non-damaging, and capable of three-dimensional measurement, and has been applied in many fields. In recent years, artificial intelligence represented by deep learning has proven to be very effective in solving phase imaging. This article aims to introduce the research progress of phase recovery methods based on deep learning, briefly introduce the traditional methods of quantitative phase imaging, and comprehensively review the existing deep learning quantitative phase imaging technology. In addition to pure data-driven network methods to recover from intensity maps through training In addition to phase strategies, deep learning networks can also be combined with physical models for phase recovery, and the application of deep learning quantitative phase imaging technology in fields such as biomedicine and industrial measurement was discussed. The challenges faced by current deep learning-based phase imaging methods and the development directions of future research are discussed. This article summarizes the work of deep learning in the field of quantitative phase imaging and puts forward prospects for how to better utilize deep learning to improve the reliability and efficiency of quantitative phase imaging.Progress First, traditional quantitative phase recovery methods are introduced. The traditional phase recovery method is to introduce additional information (sample operation, system adjustment and multiple acquisitions) to transform phase recovery into a well-posed/deterministic problem, such as holography or interferometry that introduces reference waves, Shack-Hartmann wavefront sensing that introduces microlens arrays in conjugate planes, and intensity transfer equations that require multiple defocus amplitudes. But the trade-off is increased system complexity or the time and effort of capturing multiple intensity patterns in exchange for a deterministic and straightforward solution. In this case, the phase recovery problem is well-posed or even overdetermined. In addition, prior knowledge can also be used to solve this ill-posed phase recovery problem by seeking the global optimal solution through optimization iteration from intensity measurements, which is the so-called phase retrieval.Then deep learning-based methods were introduced, including data-driven network methods and combine physical methods with deep learning technology for phase recovery. This data-driven network uses a large number of paired intensity map and phase ground truth datasets as implicit priors to iteratively train the initialized neural network. After training, the network is used as an end-to-end mapping. There are three main ways to combine physical methods with deep learning technology: physical cascade network, network embedded physics and embedded physical network. The networks combine with physical methods avoids the inherent problems of data-driven method such as data dependency, poor generalization, and lack of interpretability. It also does not require multiple holograms of traditional physical methods and can obtain faster results, reconstruct higher quality phase information and is more robust to noise.Conclusions and Prospects Due to its imaging principle, traditional phase recovery methods have some problems such as slow imaging speed and artifacts in reconstructed phase. Solving these problems using traditional physical methods or algorithms is often complicated and difficult to achieve the desired results. AI-QPI has greatly overcome various defects in phase recovery with its excellent ability to solve the inverse problem of image reconstruction. This article has conducted an extensive survey on the latest progress of deep learning phase recovery method, mainly discussing data-driven network recovery, and deep network methods combined with physical methods for recovery phase, and related improvements. Continuous optimization and improvement of phase recovery technology based on deep learning have great significance to the advancement of imaging and artificial-intelligent sensing technology, and has a positive role in promoting the development of biological microscopy, deformation detection, particle field analysis, micro-nano device detection and other fields.
Feb. 25, 2025Vol. 54 Issue 2 20240490 (2025)
Yunhao ZHANG, Yunpeng YANG, Bingcai SUN, Xin LIU, Hongyan JIANG, Shuai ZHAO, and Bin WU
ObjectiveThe petrochemical industry is one of the key industries to promote the high-quality development of China's economy. Petroleum gas is colorless and odorless, so it is not easy to be detected by the staff when it leaks in small amounts, and there is a potential safety hazard. In recent years, petrochemical enterprises have an increasing demand for detection and location of petroleum gas leaks, and at the same time, they have put forward the detection requirements of high reliability, high sensitivity and high stability, which has promoted the research and development of related technologies and instruments of high-performance gas leak detection equipment to become the focus of research at home and abroad. Infrared spectral imaging technology has attracted extensive attention in the field of oil and gas leak detection technology due to its advantages of large range, long distance, rapid location of leakage source, and dynamic and intuitive vision. At abroad, although the advanced infrared spectral imaging system has excellent performance, its key technologies and products are expensive, and some technologies are blocked. At home, although progress has been made in the research of infrared spectral imaging technology, there are still challenges in achieving rapid response and automatic detection, reducing system cost, and improving system detection sensitivity and accuracy. Therefore, it is necessary to study the infrared spectral imaging detection components for oil and gas leaks.MethodsAccording to the specific needs of the petrochemical industry for oil and gas leakage detection technology, the principle of infrared spectral imaging technology is applied to carry out the research of spectral imaging detection components. Through the analysis of the test principle and the screening of petroleum gas spectral lines, the target study band was determined (Fig.2). Based on the spectroscopic characteristics of the miniature multi-order Fabry-Perot (F-P) filter, combined with high-precision exponential lithography and etching processes (Fig.7), a multi-channel bandpass filter covering the long-wave infrared spectrum was designed and developed. Combined with the application scenario of oil and gas leak detection, the selection of image sensors and device coupling were completed (Fig.9), and finally a set of infrared spectral imaging detection components for oil and gas leak detection (Fig.10) was developed and tested and evaluated (Fig.12). The imaging detection component was used to build a detection system (Fig.13) to detect the standard gas concentration of methane, the main component of oil and gas. The theoretical detection limit concentration of the system was obtained through data processing and analysis (Fig.17).Results and DiscussionsAn 8-12 μm long-wave infrared F-P cavity filter was designed (Fig.4), and the device was fabricated by high-precision exponential lithography and etching (Fig.7). Finally, an infrared spectral imaging detection component with more than 10 spectral bands, a spectral range of 8-12 μm, and a spectral resolution better than 0.5 μm was obtained (Fig.10). A petroleum gas leak detection system was built, and the system calibration was completed by detecting standard gases, and the theoretical detection limit concentration of the system reached 5.4% (Fig.17).ConclusionsInfrared spectral imaging detection technology has shown great potential in the field of oil and gas leak detection due to its high efficiency, accuracy and non-contact characteristics. Based on the semiconductor processing technology, the thin film structure of the F-P cavity of the progressive cavity was designed, and the filter of the long-wave infrared band progressive cavity was prepared by applying the wide-response narrow-band high extinction ratio filtering technology and high-precision exponential lithography etching technology. It has the advantages of low cost and high efficiency in mass production. Combined with the application scenario of oil and gas leakage detection, the image sensor is selected. The bonding scheme of the long-wave infrared spectral multi-channel bandpass filter and the uncooled vanadium oxide long-wavelength surface array detector was designed, and finally a set of infrared spectral imaging and detection components for oil and gas leakage was developed, with more than 10 spectral bands, the spectral range covering 8-12 μm, and the spectral resolution better than 0.5 μm. The imaging detection component is used to detect the main components of oil and gas as standard gases, and the theoretical detection limit concentration of the system reaches 5.4%. It provides strong support for the further research and development of spectral monitoring technology and equipment for the leakage of oil and gas hazardous chemicals suitable for enterprise sites.
Feb. 25, 2025Vol. 54 Issue 2 20240316 (2025)
Yaqian ZHANG, Yugang JIANG, Jingsong RONG, Rongshi ZHANG, Tong ZHANG, and [in Chinese]
ObjectiveAfter undergoing processes such as molding, sintering, and hot isostatic pressing, MgAl2O4 transparent ceramics accumulate significant residual stresses inside, directly affecting the optical uniformity of the material, and even causing deformation and cracking during subsequent processing and application due to stress release. In addition, due to the fact that the hot isostatic pressing heating components are made of carbon fiber material, they can cause a certain degree of carbon pollution to the pre-fired parts under high temperature and high-pressure conditions. They are issues that must be addressed and solved in engineering applications. The annealing process has always been used in the field of metal and glass heat treatment, while the application in the field of transparent ceramics focuses more on the influence of annealing process on the optical properties. However, there is a lack of in-depth research on its influence mechanism. At the same time, removing residual stress is one of the main purposes of annealing treatment for transparent ceramic materials, and its evolution process analysis is rarely reported. Therefore, it is very necessary to conduct research on the effect and mechanisms of annealing treatment on the optical properties and residual stress. In addition, the temperature range for rapid growth of MgAl2O4 transparent ceramics grains can be determined, providing a reliable reference for the practical application of the material.MethodsIn this paper, MgAl2O4 transparent ceramics were prepared by pressureless sintering combined with hot isostatic pressing treatment. The residual stress of the material was characterized by two methods: stress birefringence optical path difference and micro-Raman spectroscopy characteristic peak frequency shift. The influence of annealing temperature on the full wavelength optical transmittance and residual stress of MgAl2O4 transparent ceramics was mainly studied. The influence mechanism was analyzed and explained by discrete dipole calculation based on Mie scattering theory, micro structure characterization, and lattice constant calculation.Results and DiscussionsWhen the annealing temperature is lower than 1300 ℃, the transmittance decreases mainly below 450 nm, when the annealing temperature is higher than 1 300 ℃, the transmittance of the whole band begins to decrease rapidly, and the decrease of transmittance in the short-wave band is significantly higher than that in the infrared band. The results of discrete dipole calculation based on Mie scattering theory and microstructure characterization show that it is mainly due to the scattering in different wave bands by the pores after expansion and splitting with the increase of annealing temperature. The residual stress in MgAl2O4 transparent ceramics is compressive stress, which shows the characteristics of uneven distribution. The residual stress first gradually decreases with the increase of annealing temperature, and after reaching the lowest point, the residual stress increases as the annealing temperature continues to increase to 1 350 ℃. However, the lattice constant is not compressed at this time, which indicates that lattice distortion is one of the main reasons for the residual stress of MgAl2O4 transparent ceramics but when the annealing temperature is too high, accompanied by pore expansion and secondary crystallization, the rigid extrusion of the interface structure between grain and pore is dominant.ConclusionsThe influence of annealing temperature on the full wavelength optical transmittance and residual stress of MgAl2O4 transparent ceramics was mainly studied. The influence mechanism was analyzed and explained by discrete dipole calculation based on Mie scattering theory, micro structure characterization, and lattice constant calculation. The experimental results show that: 1) The influence of annealing temperature on the optical transmittance of MgAl2O4 transparent ceramics in whole wavelength lies in the influence of the residual pores evolution under different annealing conditions. 2) Annealing is an effective means of material residual stress relaxation, and the residual stress can be effectively characterized by the stress birefringence optical path difference and the characteristic peak frequency shift of micro-Raman spectroscopy. The residual stress first gradually decreases with the increasing of annealing temperature, and then reaches the lowest point, at last the residual stress increases as the annealing temperature continues to increase. The results of the two test methods have the same trend, but the difference is that the annealing temperature corresponding to the lowest stress value is slightly deviated, which is mainly due to the surface processing stress introduced during the grinding and polishing process of the sample surface. 3) lattice distortion is one of the main reasons for the residual stress of MgAl2O4 transparent ceramics, but when the annealing temperature is too high, accompanied by pore expansion and secondary crystallization, the rigid extrusion of the interface structure between grain, grain and pore is dominant. 4) The rapid grain growth temperature range of MgAl2O4 transparent ceramics is 1 350 ℃and above, so as a visible/infrared composite optical element, the maximum temperature at which the MgAl2O4 transparent ceramics can be reused for a long time is not higher than 1 300 ℃.
Feb. 25, 2025Vol. 54 Issue 2 20240414 (2025)
Yingyun ZHANG, Jiwang CHAI, Guixiang LIU, Yang LIU, and Shunli HAN
ObjectiveElectromagnetic waves in the terahertz band has significant application scenarios such as security screening, material analysis, biomedical, communications and military applications. In recent years, atom-based terahertz electric field measurement, characterized by high sensitivity, ultra-broad bandwidth, high resolution and the ability to be directly traceable to fundamental physical constants (the Planck constant), has widely attracted attention. The measurement capability across microwave and terahertz bands enables Rydberg atoms to partially overcome the limitations of traditional terahertz measurement methods. Various research teams have successively reported the application of electromagnetically induced transparency (EIT) spectroscopy based on Rydberg atoms in microwave electric field measurement, such as field strength power, phase, frequency, angle of arrival, polarization direction, among others. Currently, there is no relevant research validating the terahertz broadband measurement capability of thermal Rydberg atoms. Therefore, it is necessary to design an atom-based terahertz field measurement system to demonstrate that using thermal Rydberg atoms as "antennas" for electric field measurement can cover an extremely wide working frequency range.MethodsThe THz electric field measurement system operates at room temperature, using a glass cell filled with Cs atomic vapor as the platform to achieve THz field strength measurement. A probe laser, resonant with the ground-state transition and stabilized via saturated absorption spectroscopy, excites atoms to the first excited state. A coupling laser excites atoms to Rydberg state (principal quantum number n>10). Quantum coherence effects create an EIT spectral signal (Fig.1(b)), which splits into an Autler-Townes (AT) signal under a resonant THz field, with the splitting width proportional to the electric field strength. The frequency coupling with the Rydberg transition calculated by Alkali Rydberg Calculator (ARC), between 0.1 THz and 1.5 THz (Fig.2). The probe laser passes through the vapor cell and is detected by a photodetector. The coupling laser is generated by a tunable semiconductor laser (507-513 nm). The 0.1-0.5 THz generation system employs signal sources and Frequency multiplier with waves directed into the vapor cell via a horn antenna.Results and DiscussionsBy theoretical calculation, it is found that there are large number of frequency points between 0.1 THz and 1.5 THz, coupling with the Rydberg transition with large electric dipole moment, that is to say, it is proved that quasi-continuous frequency measurement in a wide frequency band can be realized by using Rydberg atom. By using the frequency separation between the fine structure levels nD5/2-nD3/2, the horizontal axis of the measured AT splitting spectrum can be converted into frequency. When the PZT voltage of tunable semiconductor laser, which is proportional to the frequency of laser, changes by 1 V during the scanning cycle, the ratio of the time interval $ {\Delta }{t} $ between the peaks and the frequency separation $ {\Delta }{f} $ between the peaks is approximately 5 486.53 MHz/s (Tab.1). In the experiment, the AT splitting width under different terahertz field strengths was measured. THz electric field detection at multiple frequencies in 0.1- 0.5 THz is realized by using the same atom vapor cell (Fig.6), and the measured AT splitting interval increases with the field strength acting on atoms (Fig.5).ConclusionsA terahertz field measurement system based on atoms is designed and build, transforming the terahertz field strength measurement into an optical frequency measurement. This scheme offers advantages such as broadband and direct traceability to fundamental physical constants. It’s proved that the same vapor cell can be used to measure terahertz fields in the frequency range from 0.1 THz to 1.5 THz, and the terahertz field strength measurement is ability to measure terahertz field strength within the 0.1 THz to 0.5 THz range. Rydberg atoms possess high-sensitivity electric field measurement and broadband frequency analysis capabilities, which lays a foundation for Rydberg atom to measure weak THz signal in THz radar, safety detection, biological research and other aspects as well as THz metrology.
Feb. 25, 2025Vol. 54 Issue 2 20240289 (2025)
Yuxiu MIAO, Xuemei YANG, Bo HU, and Houkun LIANG
ObjectiveOn-chip integrated mid-infrared lasers have emerged as a significant developmental direction in the field of mid-infrared lasers in recent years, attributed to their compact footprint, low energy consumption, and high conversion efficiency. In particular, on-chip integrated mid-infrared lasers based on nonlinear frequency conversion have garnered considerable attention from researchers due to their capabilities for ultra-short pulse output and broadband tunability. Notably, the advantageous physical property that the second-order nonlinear effects of materials vastly exceed their third-order nonlinear responses endows on-chip integrated mid-infrared lasers based on second-order nonlinear frequency conversion with numerous benefits, including straightforward design, high conversion efficiency, and low threshold levels. However, the current limitations in micro-nano fabrication techniques have resulted in a lack of reports on high-efficiency long-wave infrared lasers utilizing waveguide platforms of this type, specifically quasi-phase-matched crystal waveguides. Consequently, there is an urgent need to explore and develop new χ(2) waveguide platforms to facilitate the generation of high-efficiency, broadly tunable long-wave infrared lasers. Furthermore, this experiment involved a detailed assessment of the transmission loss of the designed ZnGeP2 waveguide, which features a phase-matching angle of 48.4º, and successfully generated long-wave infrared laser output through optical difference frequency generation.MethodsDistinct loss measurement systems were established based on the principles of the Fabry-Pérot (F-P) cavity method and the truncation method (Fig.2-Fig.3) to conduct comprehensive assessments of the transmission loss of the designed ZnGeP2 waveguide, which possesses a phase-matching angle of 48.4º. Building upon these measurements, an experimental setup for optical difference frequency generation was developed utilizing two tunable optical parametric amplifier (OPA) sources as the pump and signal light (Fig.4). The wavelengths of the pump and signal lights were adjusted to achieve broadband tunable long-wave infrared laser output. Finally, the phase-matching curve for the ZnGeP2 waveguide corresponding to the phase-matching angle of 48.4º was calculated using the Sellmeier equation for the ZnGeP2 crystal, facilitating the validation of the optical difference frequency generation experiments.Results and DiscussionsThe characterization of the waveguide's surface profile and roughness (Fig.1) confirms the quality of the waveguide fabrication. The results from loss tests conducted using both the Fabry-Pérot (F-P) cavity method and the truncation method indicate that the transmission losses for the ZnGeP2 (ZGP) waveguide are 0.173 1 dB/cm and 0.199 8 dB/cm for the transverse electric (TE) and transverse magnetic (TM) modes, respectively, at a wavelength of 1.55 μm. Additionally, the TE mode transmission loss at 2.4 μm is recorded as 0.8 dB/cm. These findings demonstrate the excellent mode transmission capability of the ZGP waveguide in the 1.55 μm wavelength range, thereby establishing a foundation for subsequent mid-infrared laser generation based on near-infrared laser pumping and ZGP waveguides. Under these transmission loss conditions, the optical difference frequency generation experiments with the ZGP waveguide achieved tunable idle frequency output within the wavelength range of 7 to 10 μm (Fig.4). This output range encompasses typical values derived from the phase-matching curve calculated using the Sellmeier equation for pump wavelengths of 2.4 µm, 2.45 µm, and 2.5 µm (Fig.5). These results indicate the exceptional capabilities of the designed ZGP waveguide in parametric conversion applications.ConclusionsA micron ridge waveguide platform based on ZnGeP2 with robust transmission characteristics has been designed. The low transmission losses observed at wavelengths of 1.5 μm and 2.4 μm fulfill the transmission requirements for on-chip integrated mid-infrared lasers. Furthermore, exploiting the excellent transparency window of ZnGeP2 in the mid-infrared spectrum, the experiments conducted on this waveguide platform successfully achieved optical difference frequency generation, resulting in idle frequency output that is efficiently tunable across the range of 7 to 10 μm. The findings related to this ZGP waveguide provide significant reference value for the development of integrated mid-infrared lasers utilizing birefringent crystal technology.
Feb. 25, 2025Vol. 54 Issue 2 20240429 (2025)
The design and algorithm research of a high-precision laser Doppler online length measurement system
Yuepeng LIANG, Runfeng HU, Fu LIU, and Tongqing LIAO
ObjectiveLaser Doppler measurement technology is a non-contact measurement method characterized by high measurement accuracy, high resolution, and rapid response. Currently, Self-developed laser Doppler length measuring instruments are still relatively few in China. The measurement errors ranging is from 0.5% to 1% in general which can not meet the requirement of cable manufacturing industry(0.3%). In contrast, the measurement errors of mature foreign products, such as the SL-type laser Doppler velocity and length meters developed by Proton Corporation in the UK and the uSpeed series laser Doppler velocity and length meters produced by Elovis in Germany, can reach 0.05%. Therefore, a high-precision laser Doppler length measurement with measurement error better than 0.05% is developed in this paper.MethodsFirst, optical frequency shifting technology is introduced based on an acoustic optical modulator(Fig.1). So, the base signal can be effectively filtered out combined with a high-pass filter. Then, an adaptive sampling algorithm is introduced(Fig.3) to further reduce system errors and enhance measurement accuracy at low speed measurement time. Therewith, Zoom-FFT spectrum thining algorithm is introduced (Fig.5) for dense spectral thining processing and energy centrobaric correction algorithm is introduced for spectral correction. The simulation analysis is carried out(Fig.6-Fig.8). Finally, an experimental system is set up, then accuracy and stability are analyzed(Fig.11).Results and DiscussionsThe accuracy of the adaptive sampling algorithm is analysed by simulations, and the relative errors at each speeds are plotted (Fig.6). The relative errors using the adaptive sampling frequency algorithm are generally lower than those with a fixed sampling frequency, particularly in the low-frequency region (corresponding to the low-speed phase). The impact of the energy centrobaric correction algorithm on Doppler frequency extraction accuracy are verified with 25 Doppler frequencies (Fig.7) . The frequency values directly output by the FFT is significantly inferior to energy centrobaric correction algorithm. So, the energy centrobaric correction algorithm can significantly improve the accuracy of Doppler frequency extraction. The relative error of Doppler frequency extraction is compared by using two methods(Fig.8). Simulation results demonstrate that the combination of the Zoom-FFT spectrum thining algorithm and the energy centrobaric correction algorithm can significantly reduce the relative error in Doppler frequency extraction and can enhance stability and accuracy. Comparison of the system's measurement results with calibration results (Tab.2) indicates that maximum measurement error and an average measurement error fully meet design objective (measurement error below 0.05%). Finally, the system's stability is analyzed by multiple repeated measurements with a speed of 1 m/s. The system's length measurement results indicates errors below 0.05% compared to the standard values (Fig.11).ConclusionsA high-precision online laser Doppler cable length measurement system based on a dual-beam dual-scattering optical path is designed. Optical frequency shifting in combination with a high-pass filter have effectively filtered out the base signal. The signal-to-noise ratio is improved significantly. The problem of low accuracy during low-speed measurements is solved by introduction of an adaptive sampling algorithm addresses. A higher-precision Doppler frequency has been extracted by combination of Zoom-FFT spectral thining algorithm and the energy centrobaric correction algorithm. The experiment results show that measurement accuracy achieve an accuracy of 0.05% with excellent operational stability.
Feb. 25, 2025Vol. 54 Issue 2 20240507 (2025)
Xinbo YUE, Xu GAO, Yang GAO, Haitao WANG, and Xiue LU
ObjectiveThe phase-sensitive optical time-domain reflectometer (Φ-OTDR) has many advantages such as high sensitivity, fast response, and large dynamic range, and it has been widely used in fields such as border security, structural health, and oil and gas pipeline monitoring. Due to polarization attenuation, interference attenuation, and Rayleigh backscatter noise, the signal-to-noise ratio of vibration positioning signals is low. Obtaining vibration signals with good signal-to-noise ratio is a key to improving the positioning accuracy of the Φ-OTDR.MethodsThe proposed method is a complementary set empirical mode decomposition (CEEMD) approach for noise reduction in Φ-OTDR systems. CEEMD essentially resolves the mode aliasing and end effects of EMD by adding white noise (Fig.3). In this paper, multi-scale arrangement entropy (MPE) is designed to evaluate the randomness of the IMF component after CEEMD decomposition (Fig.4), and an improved wavelet threshold function is used to accurately deal with noise (Eq.15). Finally, the multiverse optimization algorithm (MVO) is designed, and the SNR is used as the fitness function to optimize the parameters of the algorithm (Fig.6), so as to achieve the optimal effect of the algorithm. After the vibration signal is simulated by PZT and denoised by the algorithm designed in this paper, the signal-to-noise ratio is used to represent the final denoising effect (Tab.3).Results and DiscussionsA Φ-OTDR system for heterodyne coherence detection was actually built (Fig.9). The 10.14 km optical fiber end was connected to PZT, and the 600 Hz vibration signal was simulated by PZT to verify the effectiveness of the algorithm. The signal collected by the acquisition card is shown in Fig.10(a), and the vibration position diagram obtained after moving the difference is shown in Fig.10(d). The parameters of each algorithm were optimized by MVO algorithm, and the signal was decomposed by CEEMD algorithm (Fig.10(d)). The decomposed IMF component was shown in Fig.12. The randomness of each component was calculated by MPE algorithm (Tab.2). The value of IMF15 is low, which can be determined as the signal component, and the other components are denoised signals. The denoised signals are denoised by the improved wavelet threshold algorithm, and finally the signals are superimposed to obtain the final denoised signals (Fig.13). In order to further illustrate the effectiveness of the algorithm, the same set of experimental data were used in the Φ-OTDR system to carry out denoising experiments and comparisons with the proposed algorithm respectively by EMD-PCC, VMD-NWT and CEEMDAN. In the experiment, PZT was used to simulate low-frequency signals of 10, 20, 30, 40 Hz, medium-frequency signals of 200 Hz and 500 Hz, and high-frequency signals of 1.2 kHz and 1.4 kHz. Figure 14-16 shows the vibration location curves of the 10 Hz, 200 Hz, and 1.2 kHz sinusoidal drive signals after noise removal. Figure 14(a)-Fig.16(a), Fig.14(b)-Fig.16(b), Fig.14(c)-Fig.16(c), Fig.14(d)-Fig.16(d) are denoising results of EMD-PCC, VMD-NWT, CEEMDAN and the algorithm in this paper, respectively. The SNR of vibration signal with a frequency of 10 Hz is 6.28, 4.06, 5.92, 8.88 dB, respectively, while that of vibration signal with a frequency of 200 Hz is 20.52, 23.12, 29.62, 30.26 dB, respectively. The SNR of vibration signal with frequency of 1 200 Hz is 6.86, 6.56, 7.52, 11.9 dB respectively. The results show that compared with other algorithms, the proposed algorithm is effective and slightly improved in the localization and denoising process of low frequency, medium frequency and high frequency signals, which provides a new optimization direction for signal denoising.ConclusionsA noise reduction method based on CEEMD decomposition is proposed to improve the signal-to-noise ratio of Φ-OTDR system. The signal is decomposed by CEEMD algorithm, each component is screened by MPE algorithm, the filtered signal is denoised by improved wavelet threshold algorithm, and the parameter design of the three algorithms is optimized by MVO algorithm. The SNR of low frequency 10 Hz, medium frequency 200 Hz and high frequency 1.2 kHz vibration events is improved to 8.88, 30.26, 11.9 dB respectively, which is superior to EMD-PCC, VMD-NWT and CEEMDAN algorithms. In particular, the positioning accuracy of vibration signals with a frequency of 200 Hz is analyzed, and the positioning accuracy of CEEMD algorithm is higher and the phase information demodulation is more accurate. In summary, the CEEMD denoising algorithm proposed in this paper has effective denoising ability for vibration signals in different frequency segments, and can optimize signal quality to a certain extent. It can not only locate the vibration position well, but also accurately obtain its frequency information, providing a new idea for the denoising of Φ-OTDR system.
Feb. 25, 2025Vol. 54 Issue 2 20240422 (2025)
Dongmei LIU, Sunde WANG, Bowen CHEN, Yan CHEN, Jiawei ZHENG, and Tianshu WANG
ObjectiveOptical fiber sensors are widespread used due to the advantages of electromagnetic interference resistance, excellent sensing performance and minor size. Sensitivity enhancement is always a focus of research. Optical Vernier effect as an effective method to improve sensitivity has attracted significant research interest. The optical Vernier effect is available with the combination of two interferometers, place in series or in a parallel configuration. To employ the optical Vernier effect, the free spectral ranges (FSRs) are designed to be slightly different, which could be achieved by choosing their optical path length (OPL). However, the optical lengths of the sensing cavity and reference cavity must control carefully to realize the Vernier effect. This makes it much more difficult to realize optical Vernier effect. In order to solve the problem, two Mach-Zender interferences (MZIs) with high birefringence in polarization-maintaining fiber (PMF) is proposed to generate optical Vernier effect. This approach allows for the simultaneous adjustment of the optical lengths of two orthogonal MZIs by simply altering the length of the PMF in a single-arm configuration. By cascading the sensing cavity with the reference cavity within this single-arm structure, environmental interference is mitigated, which enhances the accuracy and reliability of the measurement process.MethodsThis sensor is constructed by sandwiching a piece of PMF between two four-mode fibers (FMFs) (Fig.1). The FMF is used to excite the high-order modes. Because of self-focusing effect, the outgoing beam will appear two states of convergence and divergence. Through the analysis of simulation, the length of FMF is selected as 1.27 mm. The light from the beam divergence point of the FMF enters the PMF transmitting both in the core and clad (Fig.3). The PMF is used to obtain orthogonal MZIs. The interference generates between the high-order mode and two polarization modes ($ {\text{LP}}~~{\text{01}}^{{x}} $ mode and $ {\text{LP}}~~{\text{01}}^{{y}} $ mode). Only by changing the length of PMF in single-arm, the optical lengths of two orthogonal MZIs could be adjusted. The length of PMF is select as 15 mm through the analysis of experiment (Fig.4). The single-arm structure generates a Vernier effect, enabling the monitoring of refractive index and temperature by observing the shift of the envelope in the transmission spectrum.Results and DiscussionsThe structure of 1.27 mm FMF-15 mm PMF-1.27 mm FMF has been used for refractive index and temperature sensing experiments. The structure eliminates the environmental interference and ensures the measurement accuracy. As the refractive index increasing the transmission spectra has a red shift. The refractive index sensitivity is obtained to be 691.15 nm/RIU with the good linearity of R2=0.996 (Fig.6). As the temperature increasing the transmission spectra has a blue shift. The temperature sensitivity is obtained to be -829 pm/℃ with the good linearity of R2=0.996 (Fig.7). Repeated experiments show that the sensor still maintains good linearity and stability. By comparing with similar works, the proposed scheme is a new perspective using birefringence of PMF, which could achieve Vernier effect in single-arm with polarization interference. The matching of optical path lengths only needs controlling the length of PMF. This compact structure fabricated simply with cutting and splicing that the process is simplified and the cost is controlled. At the same time, the sensor exhibits a good sensing characteristics and stability (Tab.2).ConclusionsA dual-parameter sensor in single-arm structure of orthogonal MZIs based on PMF has been proposed. The structure fabricated by sandwiching a section of PMF between two pieces of FMF. The interference occurs between two orthogonal polarization modes ($ {\text{LP}}~~{\text{01}}^{{x}} $ mode and $ {\text{LP}}~~{\text{01}}^{{y}} $ mode) and the high-order modes in PMF. Only by manipulating the length of PMF in single-arm, the dimensions of two orthogonal MZIs have been simultaneously adjusted. We analyze the interference mechanism and select the length of FMF as 1.27 mm and PMF as 15 mm. Through demodulating the Vernier envelopes, the sensitivity of refractive index and temperature reached 691.14 nm/RIU and -829 pm/℃. Besides, the structure performs a good stability in repeated experiments. The FMF-PMF-FMF (FPF) structure is capable of minimizing errors induced by environmental fluctuations, which has good potential application in high-precision engineering.
Feb. 25, 2025Vol. 54 Issue 2 20240451 (2025)
Xiaoyu LUO, Yinggang NAN, Yongchun LIANG, Wenping XIE, Li MIN, Tuan GUO, and Ming NIE
ObjectiveChina's coastal regions frequently face threats from destructive hurricanes and strong seasonal winds, which pose risks to high-voltage transmission towers distributed across the area. These extreme weather conditions can cause significant damage to the towers, making real-time monitoring a crucial measure in mitigating potential harm. Implementing a real-time condition monitoring system enables early detection of critical damage from wind-induced vibrations, allowing for timely remedial actions, such as shutting down power lines to prevent further damage. This paper investigates the feasibility of using an all-fiber sensing system to monitor wind-induced vibrations in transmission towers in real time.MethodsThe proposed system utilizes an optical sensing probe, which integrates a thin-core optical fiber with a tilted grating inscribed in its core, spliced coaxially to a single-mode optical fiber. During wind-induced vibrations, two photodetectors are employed to monitor the energy changes in the core and cladding modes of the fiber. The energy changes in the cladding mode are used to detect the frequency and intensity of the vibrations, while the energy variations in the core mode serve as a reference for ambient temperature and light source fluctuations.Results and DiscussionsExperimental results show that the proposed system delivers a linear response exceeding 97% within a vibration range of 0.1-6.5 m/s2, with a deviation of less than 1.5%. Under practical conditions, the system consistently achieves stable real-time measurements within a wind speed range of 2 to 4.5 m/s. The system was subsequently applied to transmission towers of the China Southern Power Grid Company, where field tests confirmed the feasibility of the proposed all-fiber sensing system in real-world applications.ConclusionsWe successfully demonstrated the feasibility of an all-fiber vibration sensing system for real-time monitoring of wind-induced vibrations in high-voltage transmission towers. The sensor consists of a TCF-TFBG spliced with an SMF. The sensor offers several key advantages: 1) It is cost-effective, relying on power measurement instead of wavelength measurement; 2) The frequency detection range is adjustable by varying the fiber length; 3) It provides ambient temperature self-calibration through simultaneous monitoring of the core mode; 4) It features multiplexing capability, enabling simultaneous monitoring of multiple sensors at different locations on the tower using a single fiber. Moreover, the sensor's packaging design ensures safe, long-term, and reliable operation even under strong electromagnetic interference and harsh weather conditions.
Feb. 25, 2025Vol. 54 Issue 2 20240495 (2025)
© Copyright 2018-2021 | Chinese Laser Press.
All Rights Reserved 沪ICP备15018463号-20