


 View fulltext

2024
Volume: 53 Issue 1
25 Article(s)

Yan Wang, Yongxing Yang, Jinpeng Li, Yong Bi, and Qingsheng Zhu
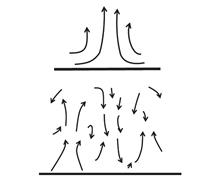
ObjectiveThe primary mirrors of large solar telescopes are continuously affected by solar radiation, causing the mirror surface temperature to be higher than the air temperature. Under the action of the temperature difference between the mirror surfaces, the air near the mirror surface is heated, causing the air density to be unevenly divided, resulting in abnormal atmospheric refraction, resulting in mirror seeing, which degrades the image quality of the solar telescope. Solar telescopes mostly use Gregorian optical systems, and their primary mirrors are aspherical mirrors. Foreign experimental research mainly uses plane mirrors or spherical mirrors for experiments. However, due to factors such as mirror surface shape, effective aperture and experimental optical path, the theoretical relevance of the experimental results is low. Mirror seeing is the coupling effect between the mirror and the surrounding air. Only numerical simulations have been carried out in China, and no relevant experimental research has been conducted on mirror seeing. Direct experimental detection is a more reliable solution. In order to control the near-mirror seeing caused by the temperature increase of the primary mirror, the mirror temperature control target needs to be given quantitatively. The main mirrors of large-aperture solar telescopes mostly use aspherical mirrors. The experimental platform of this article uses a 1 550 mm diameter hyperbolic mirror for research to improve the universality of the experimental results. MethodsFirst, based on the solid-flow field coupling caused by temperature gradient and gas flow, this paper proposes the formation mechanism of the specular seeing effect and establishes the theory of the specular seeing effect caused by atmospheric optical turbulence. Then, based on the physical process of atmospheric turbulence producing mirror seeing, under two conditions of natural convection and forced convection (Fig.1), an experiment for a 1 550 mm large-diameter hyperbolic mirror was built (Fig.3), and the experimental data (Tab.2-4), analyze the effect of the temperature difference between the mirror surface and the surrounding air on the mirror seeing under different wind speed conditions (Fig.8-9). Finally, the experimental models under different convection conditions are summarized (Fig.10-11), and the solar telescope temperature control target is determined. Results and Discussions Experimental results show that mirror seeing is related to the mirror temperature difference. The interaction between natural convection and external forced airflow near the mirror has a transition from expected stability to instability. Forced blowing causes tiny air molecules to move near the mirror. Even small-scale turbulent movements can cause very sensitive changes in mirror seeing. Mirror temperature difference and wind speed have a strong correlation with mirror seeing (Fig.8-9). Increasing active ventilation can reduce mirror seeing. When the temperature difference is 4 ℃, the mirror seeing under natural convection is 1.43″; when the temperature difference is 3 ℃, the mirror seeing under 0.2 m/s forced convection is 0.44″, and when the temperature difference is 1 m/s forced convection, the mirror seeing is 0.27″. According to the mirror seeing effect tolerance standard, combined with Tab.2-4 and Fig.9, under weak mixed convection conditions (U=0.2 m/s), the mirror-air temperature difference should be controlled below 0.2 K; in Under strong mixed convection conditions (U=1.0 m/s), the mirror-air temperature difference should be controlled below 1 K. ConclusionsDue to the influence of solar radiation, the temperature of the main mirror of the solar telescope is higher than that of the surrounding air, causing mixed convection above the mirror. Random fluctuations in atmospheric density or temperature trigger turbulence in the refractive field, with the temperature fluctuation being the largest and random, resulting in a mirror seeing effect in the thin area above the specular viscous conductive layer. This article starts from the theory of atmospheric optical turbulence and combines the experimental data of the 1 550 mm hyperboloid primary mirror under different convection conditions to study the quantitative relationship between mirror temperature rise and telescope observation image quality, providing a research basis for setting the temperature control target of the solar telescope's primary mirror. This study focuses on the common problem of large solar telescopes - the influence of the mirror seeing on the degradation of the telescope image quality. It analyzes the atmospheric turbulence process of the mirror from the perspective of atmospheric optical turbulence, summarizes and simplifies the experimental data, and further analyzes its impact on the telescope image. The influence caused by quality is derived from the empirical formula. In order to lay the foundation for improving the working resolution of the telescope, this work will also provide the necessary preliminary research foundation for the construction and observation of the 8-meter China Giant Solar Telescope (CGST).
Jan. 25, 2024Vol. 53 Issue 1 20230412 (2024)
Jian Li, and Dayong Zhang
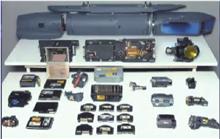
SignificanceThe technical characteristics and development process of four generations of EO (electro-optical) targeting pod are compared. The design focus and key points of each generation are summarized. Focusing on the overall design of the detection system of AN/AAQ-33 Sniper XR ATP pod and AN/ASQ-228 ATFLIR pod, as well as the newly emerging fourth generation products such as Litening 5 and Talios pods, this paper provides a reference for the development of the new generation EO targeting pod detection system. ProgressFirstly, the ratio of optical aperture to pod diameter (ROP) is defined as a standard for measuring the integration level of optical machinery and servo control system. The higher the ROP is, the higher the system integration degree is. Secondly, the optical system of ATP and ATFLIR is analyzed, which are regarded as the typical 3rd generation targeting pod, both adopt the series common optical path architecture of front telescope system and servo frame platform are placed at the head of the pod. And the compressed parallel beams are introduced into the beam splitter and rear detection/laser emission system which are placed at the middle of the pod through the optical hinge and fast steering mirror (FSM). The two pods' small field of view (sFOV) is about 1.5°×1.5°, and the wavelength is 0.7-0.9 μm & 3.7-4.8 μm, and their modulation of transfer function (MTF) are close to diffraction limit. A refractive front telescope system like ATP with φ150 mm common optical path is forward designed, and the result verifies the optical system considering the servo frame platform can be installed into a pod of φ305 mm diameter, and the ROP is 0.492; A off-axis three mirror astigmatism (TMA) front telescope system like ATFLIR with φ150 mm common optical path is forward designed, and the result verifies the optical system can be installed into a pod of φ330 mm diameter, and the ROP is 0.455 (Fig.4, Fig.7). Finally, as a comparison, the optical parameters of Litening 5 and Talios (Fig.9-10) are introduced, which are regarded as the fourth generation targeting pods. The detection systems adopt a parallel common cabin layout, with all the optical payload and servo frame platform installed inside a sphere with φ406 mm diameter, and their largest optical apertures are still φ150 mm. The ROP of Litening 5 and Talios is 0.37 and 0.38, much lower than ATP and ATFLIR, indicating low integration levels. Litening 5 pod addes a shortwave infrared imaging band, which has high fog penetration ability; Talios pod addes the step-and-stare scan imaging ability; Both of them add visible light color imaging function to improve detection and recognition probability. However, based on the optical design analysis, ATP and ATFLIR can easily modify their optical systems to achieve these functions, indicating the two pods have strong vitality due to their forward-looking overall architectures, and the improvement of ATFLIR optics is much easier than that of ATP. Conclusions and ProspectsIn the future, the targeting pod needs to integrate functions such as air-to-air detection, laser communication, and directional infrared countermeasures (DIRCM), and must have high functional density. The series layout architecture using a pure reflection common path front telescope system, optical hinges, FSM, rear detection/laser emission system has strong scalability and expansibility.
Jan. 25, 2024Vol. 53 Issue 1 20230353 (2024)
Jingfa Lei, Haoran Xie, Yongling Li, Dong Wu, Miao Zhang, and Ruhai Zhao
Objective For low dynamic range surface objects, a single exposure can provide sufficient exposure, but for high dynamic range surface objects, it is difficult to obtain high-quality fringe patterns with a single exposure, the multi-exposure fusion technology fuses the fringe pattern through multiple exposures, which can effectively improve the definition of the fringe pattern, thereby improving the accuracy of phase measurement. The traditional multi-exposure fusion technology needs to manually set the exposure time, which has problems such as low efficiency and poor exposure accuracy, in this paper, the method of adaptive exposure is used to obtain the exposure time, which avoids the disadvantages of manual exposure. Although the fringe image fused by traditional multi-exposure fusion technology has removed overexposure points, the overall quality of the fringe image is still not high, therefore, this paper improves the fusion process of multi-exposure images, a fringe map with better image quality is obtained. Methods Firstly, the images taken under the initial exposure time are analyzed by histogram, the areas with different reflectance on the surface of the measured object are divided into several groups, the optimal exposure time of each group is calculated respectively; on this basis, the images of projected white light and projected stripes were taken under the optimal exposure time corresponding to different groups, after removing the high gray value area exceeding the set threshold in the image, then making the image collected when projecting white light into a mask image, and multiplied with the image acquired when the fringes were projected at the same exposure time, perform brightness compression and fusion on multi-group multiplied images; finally, improve the contrast and clarity of the fringe image generated after fusion through the CLAHE algorithm, thereby performing stripe unwrapping and point cloud reconstruction. Results and Discussions The adaptive exposure used in this paper is more efficient and accurate compared to manual exposure (Fig.6), for the three high dynamic range surface objects of the U-card, the Connection Bock and the Disc, the fringe image fused by the method in this paper has no overly bright and overly dark areas, and the overall quality of the fringe pattern is good (Fig.7, Fig.8, Fig.9), there is no obvious loss in the point cloud\image after 3D reconstruction (Fig.10, Fig.11, Fig.12), the number of point clouds measured by the method in this paper is similar to the number of three-dimensional point clouds measured by the spray imaging agent method, the reconstruction rate has reached more than 99.5% (Fig.13), the measured absolute error and relative error of the standard block step height are only 0.062 mm and 0.69% (Tab.2). Conclusions Aiming at the failure of 3D contour detection of high dynamic range surface objects, this paper proposes an improved multi-exposure fusion method, replacing manually setting exposure with adaptive exposure, at the same time, in the process of image fusion, the contrast and clarity of the fringe image are improved by setting the threshold, brightness compression, and using the CLAHE algorithm. Experimental results show that adaptive exposure is more efficient and accurate than manually setting exposure, the point cloud reconstruction rate of different high dynamic range surface objects is above 99.75%, the measured absolute error and relative error of the standard block step height are only 0.062 mm and 0.69%, effectively solved the problem of missing 3D point clouds for detecting high dynamic range surface objects, improved measurement efficiency and accuracy of 3D profile measurement.
Jan. 25, 2024Vol. 53 Issue 1 20230370 (2024)
Zichen Wang, Donghe Wang, and Wei Zhu
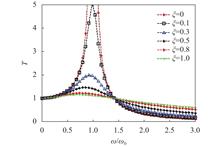
ObjectiveAbsorber is a very commonly used component in UAV OE platform, because it can effectively absorb the vibration caused by the UAV, thereby enabling the photoelectric platform to obtain more stable and clear image or video. In the recent years, many scholars focus their attention on many kinds of damper in order to further improve the imaging quality of the OE platform. Non-angular displacement damper is designed for optimizing the performance of platform payload, but its practicality is limited by large volume and heavy weight. So traditional damping absorber is still the most widely used damper in OE platform at present. A lot of research have been conducted about the characters of damping absorber, but quantitative analysis to address the impact of vibration on optoelectronic platforms and how to optimize the installation layout of OE platform with damping absorber has not been carried out. MethodsAccording to the characters of airborne OE payload, this paper analyzes and tests the angular characteristics of damping absorber that is related to the performance of airborne payload. First, the self-character of damper of EO payload is introduced. Second, the overall performance model of EO payload are established. Meanwhile, the modeling of motion characteristics is established and the factors that may affect the ability of airborne payload are analyzed during the installation layout of damping absorber. Many factors, such as stiffness, damping coefficient, installment-center-distance and the mass of payload, are promoted which determine the results of angular and linear displacement. Results and DiscussionsThe results of simulation analysis show that the displacement of damper mainly occurs in the vertical direction instead of horizontal direction, and the displacement in horizontal direction is only 2% in the vertical direction within the effective stroke of damper when the distance of rotation center R is set as 200 mm, 250 mm and 300 mm. The portable test system is mounted using a vibration table, an UAV OE platform with four damping absorbers and an auto-collimator. All the dampers, with the same stiffness and damping coefficient, are fixed between vibration table and UAV OE platform, and auto-collimator with target is used for testing the impact of vibration on payload imaging quality. Four images are captured by OE payload when the installment-center-distance is set as 350 mm, 300 mm, 200 mm and 100 mm respectively, and the vibration table is under 5 Hz low-frequency disturbances. It is not difficult to find that with the increase of installment-center-distance, the image quality decreases significantly. So, we should increase installation spacing of diagonal dampers as much as possible in application. ConclusionsAccording to the characters of OE payload, we researched the characteristics, motion modeling, and testing applications of UAV OE platform and its related damping absorber deeply. On the basis of introducing the working principles of damping absorber and OE platform, a motion characteristic model of the platform with damping absorber is established. At the same time, not only the theoretical model is simulated, but also the test results are conducted in laboratory. All the results indicate that the model can reflect the impact of damping absorber on the overall performance of UAV optoelectronic platform basically, and the results of our research in this paper are very helpful in optimizing the design, installation, and practical engineering applications of UAV platform.
Jan. 25, 2024Vol. 53 Issue 1 20230432 (2024)
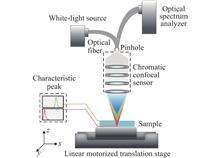
Chunyan Li, Danlin Li, Jihong Liu, Chang Liu, Ke Li, and Jiewei Jiang
In order to obtain multi-point data of the sample, the spectral confocal displacement sensing system will produce jitter effect when moving the measurement, causing the drift of the measurement data. Based on the realized spectral confocal thickness measurement system, the effect of jitter is studied and the jitter compensation algorithm is explored; Firstly, based on the spectral confocal thickness measurement model and the presence of jitter when the probe is tilted to a certain extent relative to the optical axis, the relational model of the effect of jitter on the thickness measurement is deduced, and the thicknesses of four kinds of samples with different degrees of random jitter are analyzed by Monte Carlo simulation method. The analyzed results are compared with the Monte Carlo simulation results to verify the correctness of the expression of the thickness probability density function. The results show that the jitter effect leads to a degradation of the measurement performance, especially when the sample thickness is large; In the case of a large standard deviation of jitter, the measurement of thinner samples has a better anti-jitter performance. Then, in order to compensate the effect of jitter on the measurement results, it is proposed to use Savitzky-Golay filtering and Gaussian fitting to realize the filtering and the extraction of the peak wavelength of the spectral signal, and the jitter error compensation algorithm is established; Finally, experimental measurements were conducted on a sample with a thickness of (1.0±0.1) mm, and the average thickness was measured to be 1.064 0 mm. The compensated relative standard deviation was 0.29%, verifying the effectiveness of the jitter compensation algorithm. This research has some guiding significance to improve the system measurement stability and measurement accuracy.ObjectiveWith the development of miniature integrated optical instruments such as optical communications and optical sensing, the use of transparent materials is becoming more and more stringent. Highly accurate thickness measurement parameters help guide their precise application and control the performance of related ultra-precision optical instruments, making accurate thickness inspection necessary. Spectral confocal method uses a broad-spectrum light source to irradiate the surface of the object, uses the principle of optical dispersion to make the dispersive objective lens produce axial chromatic aberration, establishes the correspondence between the dispersive distance and the wavelength, and uses a spectrometer to detect the peak wavelength of the spectrum that is focused on the surface of the object and reflected back to get the accurate axial position or micro-displacement data. Such an approach allows to break through the diffraction limit of ordinary optical microscopes. It achieves ultra-high ranging resolution on the nanometer scale and has wide adaptability to environments and materials. When measuring the thickness of transparent materials using the spectral confocal method, the jitter effect alters the refractive properties of the beam entering the sample and random noise is present in the received spectral response curve reflected from the sample surface, which leads to drift of the measurement data. On this basis, the relationship model of the effect of jitter on the spectral confocal thickness measurement is firstly derived in this paper, and the distribution of the thickness probability density function of the sample under different degrees of random jitter is simulated and analyzed by Monte Carlo method. In order to compensate for the effect of jitter on the measurement results, it was proposed in this paper to use Savitzky-Golay filtering and Gaussian fitting to extract the peak wavelength of the spectral signal, and a jitter compensation algorithm was established. Finally, the stability of the measurement results is improved by experimental measurements, and the effectiveness of the algorithm is verified. MethodsThe effect of jitter on thickness measurement of transparent materials is studied in this paper. First, the thickness measurement models of the probe with respect to the optical axis were derived when the probe was not tilted (Fig.2) and tilted (Fig.3), and the influence of jitter on the thickness measurement results was characterized by the optical axis tilt, and simulation analysis was carried out (Fig.4). Then, by comparing thickness measurement errors and jitter standard deviation at different wavelengths (Fig.5), after comparative analysis of various algorithms, spectral noise was filtered by Savitzky-Golay filtering algorithm (Fig.7-8), and peak wavelength of spectral signal was extracted by Gaussian fitting algorithm (Tab.1). An optimized jitter compensation algorithm is constructed. Finally, the validity of Savitzky-Golay filtering algorithm and Gaussian fitting algorithm for jitter compensation in spectral confocal thickness measurement is verified (Tab.2). Results and Discussions The thickness of the sample under static conditions depends only on the focusing wavelength, the angle of incidence and the refractive index of the transparent material. Random jitter angle is the main source of thickness measurement error, and the thickness measurement error caused by sensor probe jitter should not be neglected. By analyzing the effect of random jitter angle on the measurement error, a jitter compensation mechanism is established to reduce the measurement error. Thickness measurement data is non-central cardinality distribution, the jitter effect will lead to the measurement performance degradation, especially in the case of larger sample thickness; In the case of larger jitter standard deviation, thinner samples have better anti-jitter performance. The peak wavelength of the spectral signal is extracted by S-G filtering and Gaussian fitting, which can reduce the error caused by the mechanical vibration of the probe and improve the measurement stability of the confocal spectroscopy measurement system. ConclusionsIn this paper, based on the spectral confocal method to realize the thickness measurement of transparent materials, the jitter effect generated by the movement will make the measurement data drift, and the influence of the jitter effect on the thickness measurement is systematically studied. Firstly, the relationship model of the effect of jitter on thickness measurement is established based on the principle of spectral confocal thickness measurement system, theoretical derivation is carried out, and MC simulation is used for simulation verification. Secondly, the thickness PDF and MC simulation results are compared and analyzed to verify the correctness of the thickness PDF expression. The results show that the jitter effect leads to a degradation of the measurement performance, especially when the sample thickness is large; In the case of a large standard deviation of jitter, the measurement of thinner samples has a better anti-jitter performance. In order to correct or compensate the effect of jitter on the measurement results, it is proposed to use S-G filtering and Gaussian fitting to realize the random noise filtering and the extraction of the peak wavelength of the spectral signal, and the jitter error compensation algorithm is modeled. Finally, experimental measurements were conducted on a sample with a thickness of (1.0±0.1) mm. Under stable conditions, the average thickness was measured to be 1.064 0 mm. The relative standard deviation of the moving measurement results was reduced from 1.86% before compensation to 0.29% after compensation, verifying the effectiveness of the jitter error compensation algorithm proposed in this paper and proposing improvement measures. The results of this paper have certain guiding significance for optimizing the system structure and further improving the performance of the system, and have certain advancing effect on the practical application of the spectral confocal displacement sensing system for stable measurement.
Jan. 25, 2024Vol. 53 Issue 1 20230444 (2024)
Xiaoyao Chu, Yaoqiong Shen, Liqin Liu, Wenzhe Zou, Yuqing Guan, Chuangwei Guo, Yujie Zhang, Lijie Liang, Ming Kong, and Lihua Lei
ObjectiveAs the key parameters of line width, line edge roughness (LER) and line width roughness (LWR) are important indicators of the quality of line width standard samples. The accuracy of LER and LWR is important for characterizing the reliability and uniformity of line width standard materials. Inspection is very important. Through the measurement and characterization of LER and LWR, the quality label technology level of line width standard samples can be effectively evaluated. Due to the problem of magnification in the measurement method of SEM, the measurement and characterization of LER and LWR have trays. Therefore, before using SEM to measure the line width, it is necessary to adjust the magnification of SEM with standard substances in advance. MethodsWith the self-traceable grating reference material as the standard of mass transmission (Fig.2), SEM is used to scan the self-traceable grating reference material, and the grating period measurement value of the self-traceable grating is obtained (Fig.3). It is compared with the actual grating period value, and the SEM calibration factor is obtained to realize the direct traceability and magnification calibration of the scanning electron microscope. The calibrated SEM is used to measure the different values of the multilayer film line width standard samples in different areas and different magnifications. The image processing technology is used to determine the position of the line edge and the average line edge based on the least squares fitting method. The root mean square roughness of the amplitude quantization parameter is calculated for LER and LWR (Fig.4). Results and Discussions The calibration of different magnifications of SEM is realized, and the calibration factors under different magnifications are obtained, which ensures the accuracy and traceability of the measurement results and shortens the traceability chain. The measurement results of line widths of different sizes are basically the same at different positions and different magnifications (Tab.2, Fig.8), the fluctuation range of line edge roughness is relatively small, the measured values are relatively consistent, and the change of line width is small (Tab.3, Fig.9); It shows that the edge of the line width sample is relatively smooth, the line width distribution is relatively uniform, and has good uniformity and consistency, which shows that the Si/SiO2 multilayer film deposition technology has the advantages in controlling the line width size and edge characteristics. ConclusionsThe SEM value traceability and magnification calibration method based on the self-traceable grating standard material shortens the traceability chain, reduces the traceability error introduced in the process of value traceability, improves the accuracy and reliability of SEM measurement, and provides a possibility for the flattening of the value transfer gradually. Through the measurement and analysis of line edge roughness and line width roughness, accurate characterization of line width and edge characteristics is achieved, and metrological support is provided for high-precision nanoscale measurement and microelectronics manufacturing fields.
Jan. 25, 2024Vol. 53 Issue 1 20230475 (2024)

Fuxi Zhu, Li Pei, Jianshuai Wang, Wenxuan Xu, Jingjing Zheng, jing Li, and Tigang Ning
ObjectiveMulti-core supermode fiber (MCSMF) with small inter-core spacing enable multiple cores to form a core region that supports the transmission of multiple supermodes. In comparison to conventional single-core few modes fiber, MCSMF has a larger effective mode field area and lower mode crosstalk, making it highly attractive. When used for long-distance transmission, novel gain equalization amplifier that is compatible with MCSMF is a necessary device to achieve signal relaying and maintain stable signal transmission. Current research on MCSMF mainly focuses on increasing the number of spatially multiplexed channels, optimizing pumping methods, and adjusting the length of the erbium-doped fiber (EDF) to expand communication capacity and reduce differential mode gain (DMG). However, there are few reports on the structural design of MCSMF. Therefore, it is of great significance to optimize the fiber's structural parameters and erbium ion distribution to further reduce DMG. In this study, the particle swarm optimization algorithm was employed to flexibly control the erbium doping concentration in each fiber core, determining the optimal doping structure of the EDF. This approach reduces the overlap integral factors of different supermodes and achieves gain equalization for $ {{\rm{LP}}~~{01}} $, $ {{\rm{LP}}~~{11{\text{a}}}} $, $ {{\rm{LP}}~~{11{\text{b}}}} $, $ {{\rm{LP}}~~{21{\text{a}}}} $, $ {{\rm{LP}}~~{21{\text{b}}}} $, $ {{\rm{LP}}~~{02}} $, $ {{\rm{LP}}~~{31{\text{a}}}} $, $ {{\rm{LP}}~~{31{\text{b}}}} $, $ {{\rm{LP}}~~{12{\text{a}}}} $ and $ {{\rm{LP}}~~{12{\text{b}}}} $ in the MC-SM-EDFA. MethodsThe designed MCSMF in this study consists of 19 fiber cores (Fig.1), including a central core (1), the first layer of cores (2-7), and the second layer of cores (8-19). These 19 cores are uniformly distributed in a hexagonal pattern. In the MCSMF, erbium ions are uniformly doped within a single layer of each fiber core. The doping concentration (volume fraction) in each core is denoted as $ {N}~~{1} $, $ {N}~~{2} $, ···$ {N}~~{19} $ according to the core numbering. The particle swarm optimization algorithm is utilized to optimize the erbium doping concentration in each fiber core, aiming to reduce the overlap integral factors of different supermodes and further minimize DMG. This optimization process enables the achievement of gain equalization for various signal modes. Results and DiscussionsAfter optimization, the MC-SM-EDFA achieved an average gain of 27.79 dB, DMG of only 0.20 dB, and NF below 3.79 dB at a signal wavelength of 1 550 nm. Furthermore, the MC-SM-EDFA exhibited gains higher than 25 dB and gain flatness below 1 dB for different signal wavelengths in the C-band (Fig.7). The noise figure ranged from 3.4 dB to 4.4 dB, and the DMG showed minimal variation with signal wavelength. Additionally, using the Monte Carlo method, this study conducted simulations to analyze the impact of erbium ion doping concentration deviations on the balancing performance of the MC-SM-EDFA. The results demonstrated that the proposed MC-SM-EDFA structure exhibits good robustness (Fig.8). ConclusionsThe proposed MC-SM-EDFA in this study supports simultaneous amplification and gain equalization of 10 modes. Simulation results demonstrate that when erbium ions are flexibly doped at different concentrations in each fiber core of the MC-SM-EDFA, the DMG at a signal wavelength of 1 550 nm for the 10 modes is 0.20 dB. In the C-band (1 530-1 565 nm), all signal modes achieve gains exceeding 26.99 dB, with DMG below 0.26 dB and NF below 4.37 dB. Additionally, the gain flatness in the C-band is below 1 dB. Furthermore, the tolerance analysis of DMG to fiber manufacturing deviations indicates stable gain performance of the proposed MC-SM-EDFA. Moreover, the MC-SM-EDFA achieves gain equalization by uniformly doping erbium ions in a single layer within each fiber core, eliminating the need for a layered doping design, as required in few-mode erbium-doped fiber amplifier (FM-EDFA). Therefore, the MC-SM-EDFA offers certain advantages in terms of design and manufacturing.
Jan. 25, 2024Vol. 53 Issue 1 20230504 (2024)
Lewei Su, Cunli Duan, Liang Sun, Bo Song, Pingshun Lei, Jianan Chen, Jun He, Yan Zhou, and Xinwei Wang
ObjectiveUnderwater optical imaging technology is of great significance for applications such as seabed resource exploration, marine ecological monitoring, underwater search and rescue, and underwater archaeology. Compared to traditional underwater cameras, underwater range-gated imaging (RGI) technology can filter out backscattered noise and environmental background noise outside the gated slice, achieving high-quality underwater imaging. However, in turbid water bodies, it is still affected by backscattered noise inside the slice, resulting in a shorter imaging distance. MethodsIn view of the problem of short RGI distance in highly turbid water bodies, underwater polarization gating imaging technology combining optical polarization and RGI was studied. By utilizing the good polarization preservation of backscattered light, the backscattered noise within the gating slice range was removed, and the target recognition distance was improved (Fig.1). Firstly, a physical model for polarized-range-gated imaging (PRGI) is established, a formula for calculating the signal-to-noise ratio of PRGI is derived, a normalized simulation curve for signal-to-noise ratio is drawn. Subsequently, RGI and PRGI are performed on underwater targets such as fishing nets and corals, and signal-to-noise ratio normalization experimental curves are drawn. The simulation curves and experimental curves are compared and analyzed. Results and Discussions When the water attenuation coefficient is 0.21 m-1, the PRGI recognition distance is about 15 m, and the RGI recognition distance is about 17 m (Fig.2). The reason why the recognition distance of PRGI is smaller than RGI is that under the low water attenuation coefficient, the backscattering of the water body is small, and the absorption effect of the water body plays a major role in limiting the recognition distance. When the water attenuation coefficient is 0.42 m-1, the recognition distance of PRGI is about 8 m, and RGI recognition distance is about 9 m (Fig.3). The gap between the two has narrowed. The reason is that as water attenuation coefficient increases, the backscattering of water increases, and the scattering effect of water will reduce the target recognition distance. When the water attenuation coefficient is 0.63 m-1, the recognition distance of PRGI is between 5.5 m and 6 m, and the recognition distance of RGI is between 5 m and 5.5 m (Fig.4). When the water attenuation coefficient is relatively high, the backscattering effect of water is severe, PRGI can improve the recognition distance compared with RGI. The experimental results of fishing net imaging under the water attenuation coefficient of 0.21 m-1 show that the signal-to-noise ratio of PRGI at 16 m is lower than RGI (Fig.7). The experimental results of fishing net imaging under the water attenuation coefficient of 0.42 m-1 show that the signal-to-noise ratio of PRGI at 9 m is lower than RGI (Fig.8). The experimental results of fishing net imaging under the water attenuation coefficient of 0.63 m-1 show that the signal-to-noise ratio of PRGI at 5.5 m is better than RGI (Fig.9). The experimental results of coral imaging under the water attenuation coefficient of 0.21 m-1 show that PRGI have severe device noise at 19 m, and the signal-to-noise ratio of the image is worse than RGI (Fig.10). The experimental results of coral imaging under the water attenuation coefficient of 0.54 m-1 show that PRGI at 9.5 m is slightly worse than RGI (Fig.11). The coral experiment results under the water attenuation coefficient of 0.89 m-1 show that the signal-to-noise ratio of PRGI at 5 m is better than RGI (Fig.12). ConclusionsAccording to the comparison experiment between fishing nets and coral, there should be a critical attenuation coefficient c01 between 0.42 m-1 and 0.63 m-1. When the water attenuation coefficient is higher than c01, the maximum recognition distance of PRGI of fishing nets is greater than RGI; There is a critical attenuation coefficient c02 between 0.54 m-1 and 0.89 m-1. When the water attenuation coefficient is higher than c02, the maximum recognition distance of PRGI of coral is greater than RGI. Based on the comprehensive simulation and experimental results, the following conclusions can be drawn. 1) There exist a critical attenuation coefficient c0, which determines the applicable water quality for RGI and PRGI. 2) The critical attenuation coefficient c0 is related to the target reflectivity.
Jan. 25, 2024Vol. 53 Issue 1 20230372 (2024)
Haoming Yang, Zijie Sun, Yanbiao Sun, and Jigui Zhu
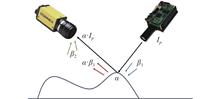
ObjectiveThe triple scan of the binocular structured light sensors is based on the binocular vision reconstruction of fringe projection, with additional point cloud reconstructed from the monocular vision system consisting of the left or right camera and the projector. Therefore, it has the advantage of better point cloud integrity in the measurement applications of reflective and uneven objects. However, because of the change of ambient temperature which exerts temperature drift impact on the projector, the binocular reconstruction point cloud and monocular reconstruction point cloud are stratified, resulting in the wrong point cloud reconstruction results of the triple scan. To solve this, a temperature drift online compensation method based on the orthogonal fringe projection is provided for the triple scan system of binocular surface structured light. MethodsA temperature drift compensation method based on the orthogonal fringe projection and binocular points constraint is provided in this paper. By projecting the orthogonal fringe patterns, the pixel coordinate in the projector image of points which are in the binocular and monocular imaging area can be determined simultaneously. Therefore, the accurate mapping relationship of binocular points in the image of the projector is established (Fig.3). Then based on the objective function of minimizing the reprojection error of the binocular reconstruction point in the projector image, the optimal external parameters of the projector after temperature drift compensation are solved to compensate temperature drift of the projector.Results and Discussions In order to demonstrate the effectiveness and practicability of the proposed method, metal spheres and car threshold base parts were tested. In metal spheres experiments, the spherical center distance between binocular point cloud and monocular point cloud at different temperature is used to quantitatively evaluate the temperature drift level (Tab.1-2). When the temperature drift of the sensor occurs at 28 ℃, the values of spherical center distance on average are 1.89 mm, 1.48 mm, 1.73 mm, 1.67 mm and drop to 0.36 mm, 0.37 mm, 0.36 mm, 0.37 mm after the method is proposed. In car threshold base parts experiments, the Euclidean distance between binocular points and monocular points corresponding to the same pixel is shown (Fig.8). Both results show that temperature drift is decreased after the method is proposed with the temperature drift value reduced by 78.2% and 94.3% on average. ConclusionsFocusing on the issue that binocular and monocular point clouds are stratified in the application of the triple scan due to the change of the ambient temperature, the temperature drift online compensation method for triple scan measuring system of binocular surface structured light is proposed. Orthogonal fringe patterns are projected and meanwhile are captured by the binocular cameras. The accurate pixel coordinate in projector image coordinate system of binocular points are acquired by calculating the phase coordinate of every pixel in the camera image and projector image. According to the the constraint of the mapping relationship between binocular points and projector pixels, the external parameters of projector are calculated via minimizing the reprojection error of the binocular points in the projector image to compensate the temperature drift of the projector. The experimental results show that the proposed method can significantly decrease the temperature drift with the value reduced by 78.2% and 94.3% on average, which verifies the effectiveness of the method. This method can provides guarantee for the stability of triple scan and make the application of triple scan a reality.
Jan. 25, 2024Vol. 53 Issue 1 20230456 (2024)
Qian Sun, Zhenmin Shen, Song Yang, Zihao Wang, Yuanqing Wang, Kun Liang, Weidong Shang, Peipei Wang, Yue Yu, Hao Zhao, Hong Lv, Zhengkun Liu, and Yongchao Zheng
Objective The development of marine ecology, marine science, and marine economy is inseparable from marine observation data, and the requirements for marine data have developed from sea surface data to ocean profile data. Ocean profiling is an important basis and means to study the three-dimensional profile distribution of global ocean optical and biological parameters, as well as ocean carbon and energy cycles. At present, ocean profile elements (temperature, salinity, optical parameters, etc.) mainly rely on in-situ detection and airborne detection, and the lack of global-scale, high-efficiency, and high-precision remote sensing observation methods has become a bottleneck problem for comprehensive understanding and fine perception of the ocean. At present, the traditional multi-payload cooperative observation or satellite-ground linkage observation mode can obtain multi-element information in time and region, but the integrated detection of temperature, salinity and depth in the ocean profile is still blank, and the inversion of non-homologous, non-homogeneous and non-simultaneous detection data of underwater optical biological parameters and physicochemical parameters is consistent and accurate, which cannot effectively obtain the three-dimensional structure of the ocean to meet the needs of scientific research.Methods An active and passive composite optical remote sensing system for multi-element detection of ocean profile is proposed, as shown in Figure 1. Based on the lidar equation calculation, the application indicators of the decomposition system, such as depth, backscatter measurement error, temperature, salinity error, etc., are calculated and calculated, and the energy, line width, optical system aperture, focal length, field of view, detector selection of the optical system of photoelectric reception and detection are confirmed through simulation analysis and calculation, as shown in Table 3. The grating primary mirror realizes the compression of light, and the diameter-thickness ratio of ULE material is 200∶1 to realize the lightweight of the system. According to the incident wavelength, incident angle, grating constant, the acceptable field of view angle of the off-axis three-mirror and the relative position of the grating primary mirror and the off-axis three-mirror primary mirror, the on-orbit deployment accuracy requirements were analyzed. The optical system ensures that the field of view, transmittance and energy concentration of each channel are more than 90% through simulation design, so as to ensure that the core components meet the system demonstration indicators.Results and Discussions The design of the multi-element detection payload system for the spaceborne ocean profile is completed. The laser spectral band is designed as the optimal ratio output of 486 nm and 532 nm multi-wavelength integration, and the photoelectric receiving and detection system selects 1m×5m super-large aperture foldable grating primary mirror, and after simulation analysis, the detection system can realize the homology detection ability of multiple elements such as ocean depth of 100 m, temperature, salinity and backscattering coefficient, and the ability collection capacity is increased by 5 times under the same volume envelope condition. The detection system can achieve a spaceborne orbit of 400 km, a measurement depth of ocean water profile of not less than 100 m, a vertical resolution of better than 0.5 m, a backscatter measurement error of less than or equal to 25%, a temperature profile error of less than 0.5 ℃, and a salinity profile error of less than 1 psu.Conclusions Based on the requirements of the multi-element detection task of the ocean profile, through the analysis and demonstration of the system indicators, a new type of spaceborne near-shore profile multi-element detection technology scheme was proposed, which adopted active and passive composite detection, the laser energy and the spectral synchronous detection system were integrated, the ultra-large aperture foldable optical primary mirror was used to ensure the efficient collection of weak underwater signals, and the laser spectral channel was used to obtain all elastic and inelastic scattering spectra, and the scattering signals of molecules and particles in water were identified and decoupled with high precision. In this way, a more accurate backscattering coefficient of LiDAR can be obtained, which has the ability to detect multiple elements such as underwater temperature, salinity, depth, and optical backscattering coefficient, and the data has good same-origin and same-domain simultaneity.
Jan. 25, 2024Vol. 53 Issue 1 20230466 (2024)
Rong Lv, Qinglin Niu, and Xiaobing Wang
ObjectiveDivert and attitude control system's side jet flow is ejected along the normal direction of the projectile during operation, which will form a series of complex structural flow fields called jet interference effects. The high-temperature jet not only generates infrared radiation but also affects the temperature distribution on the surface of the projectile, which ultimately affects the radiation characteristics of the target. In particular, the DACS operation is often accompanied by a change in the angle of attack. The change in the angle of attack causes a significant change in the jet interference effect, which can cause significant changes in the infrared radiation characteristics of the target. In the field of attack-defense mutual countermeasures, both for the stealth and surprise defense of interceptors and for the evasion and identification of interceptors, the urgent concern for the infrared radiation characteristics of targets under high-speed jets is raised. The paper analyzes the effects of the angle of attack on the reignition of the thermal jet field at typical altitudes, and the effects of the angle of attack on the infrared radiation characteristics of the projectile in different spectral bands and at different observation angles. MethodsWith the typical cone-cylinder-flare elastomer as the research object (Fig.1), the three-dimensional N-S equation with chemical reaction source terms is solved. The reaction thermal jet field and the wall temperature of the projectile are calculated in conjunction with the radiative equilibrium wall. The radiative transfer equations are solved based on the statistical narrow band model and the apparent light method from the high temperature database. A Cartesian coordinate system is used to describe the radiation distribution at all possible angles, and the observed angles are represented by the zenith angle θ and the circumferential angle φ (Fig.3). Results and Discussions Compared to α=0°, the Mach disk increases at α=10°, the jet expands upward and the high-temperature area increases. However, the Mach disk decreases at α=-10°, the jet is compressed into a limited area of elongated shape, and the local wall temperature at the tail of the projectile increases by about 500 K (Fig.5). The reignition effect increases the intensity of infrared radiation in the MWIR band of the target by about 3.5%, and the degree of radiation intensity increase at α=-10° is enhanced by about 145% compared with α=0° and reduced by about 31.5% at α=10° (Fig.8). The peak radiation intensity of the near-space aircraft proper spectrum is concentrated in the MWIR band, and is strongest in the top view and weakest in the back view, 1 836.6 W/sr and 7.6 W/sr at α=0°, respectively; The total radiation spectrum has two peaks of 2.7 μm (H2O) and 4.3 μm (CO2). The integrated intensity of radiation in the two bands of the same detection surface shows a similar distribution pattern with the change of observation angle and angle of attack, but the difference of radiation intensity values is obvious, which is approximately in line with the pattern that the integrated intensity in the MWIR band is 4 times higher than that in the LWIR band. 4 times the law. In the detection surface 1 described by the zenith angle θ, when α =-10°, the total radiation integral intensity in the top view is enhanced by about 40.2% compared with α = 0°, and reduced by about 28.1% in the top view; When α = 10°, the total radiation integral intensity in the top view is reduced by about 8.6% compared with α = 0°, and enhanced by about 27.8% in the top view; In the detection surface 2 described by the circumferential angle φ, when α =-10°/10°, the total radiation integral intensity is reduced by about 7.5%, and when α =-5°/5°, the total radiation integral intensity is reduced by about 4.8% (Fig.9-14). ConclusionsWhen the side jet stream acts, a local hot spot is formed on the wall surface of the projectile. Changes in the angle of attack cause changes in the jet pattern, the temperature distribution at the wall, and the concentration distribution of the gas components, which change the re-ignition level and the radiation intensity. The radiation intensity of the projectile is strongly dependent on the waveband and the observation angle. The total radiation intensity is mainly derived from body radiation. The change of the angle of attack affects the radiation intensity of the target at each observation angle as follows. The radiation intensity of the target in the top view decreases with the negative to the positive angle of attack, and the radiation intensity of the target in the horizontal plane normal to the jet decreases with the increasing value of the angle of attack. This study can provide a theoretical reference for the identification of the target characteristics of the near-space aircraft side jet flow.
Jan. 25, 2024Vol. 53 Issue 1 20230176 (2024)
Jing Li, Shulin Dong, Ning Jin, Kaiyu Yang, Dan Yang, Man Xu, and Long Pu
ObjectiveThermal imaging systems, operating in harsh environments and generating substantial internal heat, are prone to thermal axis deviations, posing a severe threat to their targeting performance. Consequently, the simulation analysis and optimization design of the thermal axis stability for military thermal imaging systems are of paramount importance. This work aims to address these issues and enhance the thermal axis stability of military thermal imaging systems through simulation analysis and optimization design, ensuring accurate targeting performance in adverse operational conditions. MethodsIn order to enhance the thermal axis stability of the infrared thermal imaging system, this study primarily focuses on a key sensitive component of the system, the optical path folding reflector assembly. The research investigates the variations in the thermal axis under different environmental temperatures. To achieve this, a finite element simulation model for the optical path folding reflector assembly is constructed (Fig.1), and a testing system is established (Fig.5). The simulation model demonstrates a high level of consistency with experimental data. Based on this, a topological optimization simulation technique, utilizing a variable density approach, is employed (Fig.3). The primary design objective is to maximize stiffness, while adhering to volume fraction constraints (Fig.4). Results and DiscussionsThrough experimental test, it was determined that the optimized design of the folding mirror mount resulted in significant improvements in thermal stability. The high-temperature axial displacement was reduced from 46.1" to 25.5", marking a substantial decrease of 44.7% . Likewise, the low-temperature axial displacement decreased from 92.9" to 51.0", indicating a notable reduction of 45.1% (Fig.6). These outcomes underscore the substantial enhancement achieved in the thermal stability of the folding mirror. Subsequently, the optimized folding mirror was integrated into a specific thermal imaging system for comprehensive system-level test. The testing results confirmed the tangible benefits of the optimization approach. Specifically, the high-temperature axial displacement of the complete imaging system decreased from 0.461 mrad to 0.340 mrad, marking a significant reduction of 26.2%. Furthermore, the low-temperature axial displacement was reduced from 0.485 mrad to 0.296 mrad, representing a substantial improvement of 39.0% (Fig.7). These practical validations affirm the feasibility and effectiveness of the simulation and topological optimization models. In conclusion, this research demonstrates the viability and efficacy of employing simulation and topological optimization techniques, significantly improving the thermal stability of the folding mirror in military infrared imaging systems. The achievements offer a robust foundation for subsequent efforts in lightweight system design and performance enhancements in military infrared thermal imaging systems. ConclusionsThis study, based on a structural thermodynamics simulation model, has significantly improved the consistency between simulation and experimental results for the folding mirror under different temperature conditions. Employing a topological optimization method based on variable density, structural optimization was conducted for the thermal imaging system's folding mirror component. The primary optimization objective was to maximize structural stiffness, which led to the determination of the optimal material distribution within the folding mirror. Firstly, the simulation data of the folding mirror's optical axis thermal displacement before and after optimization was compared, it is evident that the high-temperature axial displacement of the folding mirror decreased from 44.5″ to 17.7″, resulting in a substantial reduction of 60.2%. Similarly, the low-temperature axial displacement of the folding mirror mount decreased from 87.8″ to 43.0″, marking a significant reduction of 51.0%. Secondly, by comparing the experimental test data of the folding mirror's optical axis thermal displacement before and after optimization, it is evident that the high-temperature axial displacement of the folding mirror decreased from 46.1″ to 25.5″, resulting in a substantial reduction of 44.7%. Similarly, the low-temperature axial displacement decreased from 92.9″ to 51.0″, marking a significant reduction of 45.1%. Finally, the experimental test data of the high-temperature axial displacement of the complete infrared thermal imaging system before and after the installation of the optimized folding mirror was compared, it is observed that the high-temperature axial displacement of the imaging system decreased from 0.461 mrad to 0.340 mrad. This reduction represents a significant decrease of 26.2%. Likewise, the low-temperature axial displacement decreased from 0.485 mrad to 0.296 mrad, indicating a substantial reduction of 39.0%. The research results demonstrate that through the application of topological optimization techniques, it is possible to achieve a localized, optimal redistribution of materials within the target structure without altering the original structural installation conditions. This effectively enhances the thermal axis stability of the target structure. The technology allows for a more rational allocation of materials, laying the foundation for further improvements in the thermal axis stability of thermal imaging systems and the lightweight design of the complete imaging system.
Jan. 25, 2024Vol. 53 Issue 1 20230358 (2024)
Qinghua Liang, Yanfeng Wei, Honglei Chen, Jing Guo, and Ruijun Ding
ObjectiveBecause of the redshift effect, the deepest and most distant universe has been seen at wavelengths closer to the infrared wavelength. The James Webb Space Telescope (JWST), launched on December 25, 2021, focuses its main detector on the infrared detection band. Therefore, infrared observation provides a new technical means for astronomical observation. The core component of infrared payload is infrared focal plane detector. At present, the typical products of mercury cadmium telluride infrared detectors for astronomical applications reported internationally are Hawii-2RG, VIRGO, ALFA (Astronomical Large Focal plane Array), etc., which have been applied in the European Space Agency (ESA). Projects such as the European Space Agency's Euclid probe and NASA's JWST. Because there is still a big gap between the device performance and the advanced level of foreign countries, the progress of infrared astronomy application is relatively slow, and there are few reports about astronomical application detectors in China. Therefore, a 640×512 HgCdTe focal plane readout circuit for the astronomical application is studied. MethodsBecause infrared astronomical observation is characterized by extremely low background radiation and low photon flux, low dark current and low read noise are the key array parameters in order to achieve high signal-to-noise ratio (S/N). Some low-flux observations require observation of several photoelectrons in a very long integration time, so the readout circuit needs to achieve a long integration time to complete the detection of small target signals. An effective power management strategy (Fig.5-6) is used to reduce the power consumption, then reduce the influence of glow on the dark current. At the same time, the digital function of non-destructive readout (Fig.9) is studied to achieve long integration time. And as a ramp sampling strategy (Fig.17), the output noise of the circuit is effectively reduced. Results and Discussions The test results of the circuit-coupled shortwave HgCdTe detector are in line with the theoretical design expectation. When the non-destructive readout function of the circuit is turned on, the device can realize ultra-long integral time detection, the dark current of the test device is set to 0.9 e-·pixel-1·s-1 (Tab.2, Fig.25-26) when the power consumption of the circuit is reduced to 14.04 MW at the integration time of 6 000 s. The readout noise is 50e-(10 fF) and 27e-(5 fF) (Fig.28) with two-step gain, respectively, and the nonlinearity is less than 0.1%. ConclusionsThe design of the 640×512 readout circuit for astronomical application and the short-wave IRFPA detector show that reducing the power consumption of the readout circuit is conducive to reducing the influence of the glow on the dark current of the device, and turning on the non-destructive readout function of the readout circuit can realize the long integration time of the detection and improve the signal-to-noise ratio of the device. The focal plane of astronomical applications meets the design expectations, meets the use demand of the infrared focal plane of the large optical platform of the space station, and provides a technical basis for the infrared focal plane research of larger scale astronomical applications in the future.
Jan. 25, 2024Vol. 53 Issue 1 20230364 (2024)
Yingni Zhai, Zhijie Liang, Xianlong Meng, and Cunliang Liu
ObjectiveWith the rapid development of national defense industry and science and technology, more in-depth application and research of gas turbine engines in aviation, power generation, chemical industry, ship and power engineering are also conducted. Due to the complex working environment of turbine blades, the particularity of temperature measurement, and the interference of wall and gas radiation, the traditional temperature measurement technology has been unable to meet its needs. In order to accurately measure the working temperature of turbine blades in complex high-temperature environments, ensure that the highest temperature and temperature gradient on the blade surface are suitable for the blade design life, and improve the safety and efficiency of gas turbine operation, infrared temperature measurement technology was used to correct the temperature of the blades under high operating conditions.MethodsWith a discretized pure three-dimensional model and a radiation correction method based on infrared temperature measurement of turbine blades, the temperature error verification calculation of turbine guide vanes with end walls was carried out using numerical simulation combined with User Defined Function (UDF) custom programming. Custom programming was used to perform reliability verification calculations on the classic concentric sphere model, such as angle coefficients and effective radiation. Based on this method, the angle coefficients of each grid element between the end wall and turbine guide vanes were calculated, and the radiation heat transfer between the blade surfaces was calculated. The surface radiation characteristics distribution of the turbine guide vanes was output, and the radiation energy flow distribution of the turbine guide vanes under this operating condition was derived using Boltzmann's law. We calculated and analyzed the temperature error distribution of turbine guide vanes with end walls under different error influence mechanisms, explored the influence of thermal radiation environment on blade surface radiation characteristics, and discussed the effect of effective radiation on turbine blade temperature measurement.Results and DiscussionsFrom Figure 8, it can be seen that after convergence, as the inlet blackbody radiation temperature increases from 1400 K to 1800 K, the temperature at the trailing edge and pressure surface of the blade is higher. Under changing the temperature conditions of imported blackbody radiation, the impact on the wall temperature of the blade is mainly concentrated in the pressure surface area of the blade. The pressure surface temperature of the blade is significantly higher than that of the suction surface area, and the second most influential area is mainly the leading edge area of the blade; From Figure 10, it can be seen that as the outlet blackbody radiation temperature increases, the proportion of radiation heat flow rate gradually increases, and there is a significant temperature rise near the trailing edge wall of the suction surface. As shown in Figure 10 (b), (e), (h), the suction surface and trailing edge of the blade are more affected by the outlet blackbody radiation temperature. When the export blackbody radiation temperature is 1600 K, the calculated error of the blade suction surface and trailing edge is about 10 K. The impact area of the export blackbody radiation is mainly in the blade suction surface area, and the temperature rise is relatively small, which has not had a significant impact on the distribution of the outer surface of the blade; When the wall emissivity decreases from 0.8, 0.6, and 0.2, the temperature in the leading edge area of the blade pressure surface is less affected by the emissivity. The temperature error distribution of the effective radiation inverse calculation is shown in Figure 12. The larger the emissivity, the greater the error at the gill area of the blade pressure surface. From the error distribution Figure 13, it can be seen that the influence at the leading edge of the blade is greater than that in the middle area of the blade, and the influence in the pressure surface area of the blade is secondary to that of the suction surface.ConclusionsWhen the temperature of imported blackbody radiation is between 1 400 K and 1 800 K, the intensity of imported radiation has the greatest impact on blade heat transfer; Based on the effective radiation and the calculated error distribution, it can be concluded that the main area affected by the inlet radiation temperature is the leading edge area of the blade, with a maximum calculation error not exceeding 2.82%; Through effective radiation and error distribution, it can be seen that the change in outlet blackbody radiation temperature has a relatively small impact on the turbine guide vanes, and the temperature affected area is mainly the leading edge area of the blade. The maximum calculation error shall not exceed 2.35%; The emissivity of the blade surface is positively correlated with temperature. As the emissivity of the blade surface increases, the surface temperature of the blade uniformly rises accordingly. Under real operating conditions, the changes in the physical properties of blade materials are relatively small, and the impact of changes in physical parameters caused by blade temperature changes can be approximately ignored in engine design.
Jan. 25, 2024Vol. 53 Issue 1 20230371 (2024)
Xingyao Wen, Jingzhou Zhang, and Yong Shan
ObjectiveThe armed helicopter is in the blind area of radar detection when performing low-altitude missions, but more attention should be paid to the threat of infrared guided weapons. Integrated into the rear fuselage of the helicopter, the infrared suppressor offers excellent stealth capabilities due to its small spatial footprint and the ability of rapid mixing and cooling at short distances. Over the past decades, significant progress has been made in understanding the mechanisms of infrared suppression, enhancing the performance of the suppressor in the areas such as cold-air injection, cold-hot flow mixing, and obscuration of high-temperature components. However, the infrared stealth effectiveness of the suppressor from the top and bottom perspectives has always been suboptimal, necessitating the search for optimal suppressor structures for further improvement. Furthermore, during the helicopter cruising, the suppressor exhaust is inevitably affected by the forward flow. Therefore, it is essential to study the performance of the infrared suppressor under the coupled conditions of forward flow, thermal exhaust, and rotor downwash. MethodsIn this study, an integrated physical model of the infrared suppressor is constructed, which includes the outer skin and the exhaust system (Fig.1). On the basis of the verification of ground model experiment, the simulation of forward flow and variations in the exhaust flow angle are added to assess how these changes affect the flow dynamics, heat transfer, and spatial distribution of infrared radiation intensity within the suppressor. The infrared radiation intensity was calculated using forward-backward ray-tracing method. Results and Discussions The results of ground experimental measurement and simulation calculation meet the error requirements, proving the calculation method in this paper is feasible. The increase of the forward flow velocity will increase the ejection coefficient of the lobed nozzle (Fig.10), but will reduce the total pressure recovery coefficient of the exhaust system (Fig.12), and the exhaust of the suppressor is blocked at higher forward flow velocity (Fig.11). Reducing the backward deflection angle γ can solve the problem of poor exhaust, thereby increasing the flow area and improving the total pressure recovery coefficient. However, when the outlet area of the exhaust lobe is constant, its cross-sectional area decreases with the decrease of γ, resulting in a decrease in the ejection coefficient of the exhaust system, an increase in the static pressure in the mixing tube, and a decrease in the total pressure recovery coefficient. When the forward flow velocity increases, the infrared radiation of each band is mainly reduced by reducing the exhaust and internal wall temperature. The installation of a curved deflector at the downwash flow inlet of the suppressor can block the internal high-temperature mixing tube and effectively reduce the infrared radiation intensity at the top of the suppressor (Fig.18). The radiation shielding baffle at the downstream of the exhaust on the longitudinal section makes the suppressor show a high radiation level only in a small range of 30° (Fig.19). ConclusionsThe balance of the advantages and disadvantages brought by changing the backward deflection angle γ of the exhaust lobe determines its influence on the aerodynamic performance of the mixing tube. The external skin downstream of the suppressor exhaust will form a high temperature zone higher than the ambient temperature of about 20 K, and the area of the high temperature zone decreases first and then increases with the decrease of γ. The infrared radiation intensity in the 3-5 μm band is mainly derived from the internal high temperature wall, while the 8-14 μm band is determined by the internal high temperature wall and the external skin. When the forward flow velocity increases from 15 m/s to 55 m/s, the peak infrared radiation intensity of the suppressor decreases by about 50% in the 3-5 μm band and about 20% in the 8-14 μm band. In general, when γ is 60°, the mixing tube has good aerodynamic performance, the local high temperature zone of the external skin is the smallest, and it has good infrared stealth performance at all detection angles.
Jan. 25, 2024Vol. 53 Issue 1 20230436 (2024)
Molin Liu, Jiayi Liu, Yizhe Wang, Xuehao Yu, Xiaodong Fang, and Libing You
ObjectiveUV excimer lasers have the characteristics of short wavelength, high power and narrow linewidth, and are widely used in semiconductor lithography, new display manufacturing, corneal refractive correction, etc. Whether in the fields of medical treatment, industry, flat panel processing, or scientific research, the pulse energy stability of excimer lasers is a very important parameter, which directly determines the accuracy of surgery, the critical dimensions of processing, and the uniformity of material processing. Limited by the composition and proportion of working gas, gas circulation system, stability of excitation source, laser resonance amplification mechanism, etc., the energy stability of excimer laser pulses output by current excimer lasers generally fluctuates around 1%-2%, and it is difficult to further improve. However, the pulse energy stability directly affects the development of industrial production, medical treatment, and scientific research. For example, in the field of integrated circuit manufacturing, the lithography process determines the key dimensions of the device, while the exposure light source directly affects the quality of lithography. The instability of the laser light source may cause pattern deformation and poor registration effect. Therefore, it is of great significance to further improve the output energy stability of excimer lasers based on the existing technology. In practical use, it has been found that when two excimer lasers are used in beam combination, the pulse energy stability is also improved to some extent while the output power is increased. MethodsIn order to obtain more stable and powerful excimer laser output pulses, theoretical derivation, simulation experiments, and beam combination experiments were conducted to investigate the feasibility of improving the stability of output pulse energy through beam combination. Theoretical derivation showed that when the laser output pulse energy follows a normal distribution, beam combination of multiple lasers with similar parameters can reduce the relative standard deviation of output energy. Subsequently, beam combination simulation experiments and actual beam combination experiments were conducted. Results and Discussions The simulation experiment of beam combination for three excimer lasers with output pulse energy distribution characteristics consistent with normal distribution was conducted. The output pulse energies were 152.2 mJ, 152.9 mJ, and 153.3 mJ, respectively, with relative standard deviations of 1.06%, 0.88%, and 0.95%. Among them, two excimer lasers achieved an average output pulse energy of 305 mJ and a relative standard deviation of 0.7% when combined. Three excimer lasers achieved an average output energy of 458 mJ and a relative standard deviation of 0.6% when combined. Three actual beam combination experiments were conducted using one PLD20 excimer laser and one PLD30 excimer laser (Fig.4). The average output energies of PLD20 were 356.6 mJ, 368.4 mJ, and 328.4 mJ, with relative standard deviations of 1.39%, 1.14%, and 1.49%, respectively. The average output energies of PLD30 were 354.5 mJ, 354.5 mJ, and 331.4 mJ, with relative standard deviations of 1.24%, 1.24%, and 1.35%, respectively. After three beam combinations, the average output energies were 687.2 mJ, 694.5 mJ, and 646.8 mJ, with relative standard deviations of 0.86%, 0.79%, and 0.83%, respectively. The relative standard deviation values of the laser pulses after actual beam combination were all lower than those of the single laser (Tab.4). The decrease in the relative standard deviation value indicates that the output pulse laser energy is more stable. Conclusions From theoretical derivation, simulated beam combination data, and actual beam combination data, it can be concluded that multiple lasers with similar output laser pulse parameters can improve the output laser pulse energy of the lasers while reducing the relative standard deviation of the output laser pulses, thereby improving the stability of the laser pulses. When two lasers with similar parameters are combined, the energy can reach 1.9 times that of a single laser, and the relative standard deviation can be reduced to 0.6-0.7 times that of a single laser.
Jan. 25, 2024Vol. 53 Issue 1 20230309 (2024)
Zihan Zhou, Zhimin Wang, Yong Bo, Fengfeng Zhang, Wencheng Zhao, Li Fu, Hanxing He, Dafu Cui, and Qinjun Peng
ObjectiveThe single-frequency lasers operating at 1.3 µm have been extensively investigated in a variety of fields, including quantum optics and fiber optical communication. A noteworthy example is the single-frequency tunable continuous-wave 671 nm laser based on frequency doubling of 1 342 nm laser, which is near the D-line atomic transitions (670.97 nm) of lithium vapor. Consequently, it finds important applications in the field of atomic physics related to lithium atoms, such as optical cooling, lithium atom interferometer, and lithium isotope separation. In applications like the lithium atom interferometer, a higher output power of the laser can yeild improved results. At present, the output power of single-frequency continuous-wave 1 342 nm diode lasers is as low as several miliwatts, necessitating application by Raman laser amplifiers and solid-state laser amplifiers. Therefore, the entire system becomes large and heavy. This paper introduces an injection-locked single-frequency tunable 1 342 nm Nd:YVO4 laser with high output power. The injection-locked laser offers the advantages of a small size and high gain, making it suitable for special demands. MethodsIn this paper, an injection-locked 1 342 nm continuous-wave single-frequency tunable Nd:YVO4 laser is developed. The system employs an end-pumped Nd:YVO4 ring laser as the slave laser, with a distributed feedback laser (DFB) as the seed laser. The seed laser is coupled into the Nd:YVO4 ring laser through output mirror (Fig.1). To achieve cavity length locking, a lock-in (LI) module is employed. The LI module detects laser intensity through a photoelectric detector and provides feedback control by adjusting the voltage on the piezoelectric transducer (PZT). The Nd:YVO4 ring laser operates bidirectionally under free operation. When the PZT on the cavity mirror is adjusted to match the cavity length with the wavelength of the injected seed laser, the laser can operate unidirectionally, resulting in a single-frequency continuous-wave 1 342 nm laser. The laser's tuning capability is achieved by changing the wavelength of the seed laser. Results and Discussions The measured output laser power in free operation is 13.9 W as recorded by power meter (Fig.2). In this state, the influence of the seed power on the injection locking of the ring laser is obtained (Fig.3). An output power of 13.9 W for the injection-locked laser is achieved with an input seed laser power of 20.69 mW. Under this condition, the tuning range of the laser is measured by a wave-meter, and a tuning range from 1 341.677 4 nm to 1 341.802 5 nm is achieved (Fig.4). Simultaneously, the laser line-width is studied using an F-P scanning interferometer (Fig.5). The laser operates in a single frequency with a line-width of approximately 41 MHz. The line-width of the output laser is enhanced compared to the seed laser, a result attributed to low seed power and the reverse-running laser mode in the cavity. The beam quality factors M2 of the injection-locked 1 342 nm laser are determined to be $ M~~x^2 $ = 1.3 in the x direction and $ M~~y^2 $ = 1.23 in the y direction using a laser beam analyzer (Fig.6). The power fluctuations (RMS) at the 13.9 W of the laser are measured and the stability is better than ± 0.5% (Fig.7). ConclusionsA high-power tunable single-frequency 1 342 nm Nd:YVO4 laser based on LI injection-locked technology was successfully designed. The output power of injection-locked 1 342 nm laser reached 13.9 W, with a DFB seed laser power of 20 mW. The tunning range of the laser system was analyzed using a wave-meter, and the measured tuning range spanned from 1 341.677 4 nm to 1 341.802 5 nm. Various characteristics, including beam quality, laser line-width, power stability were comprehensively measured. To achieve the better stability and lower system noise, the methods of employing a seed laser with higher power and implementing methods such as reducing vibration and enclosed the structures have been identified as effective.
Jan. 25, 2024Vol. 53 Issue 1 20230366 (2024)
Xiangyu Xu, Zhaoqiang Liu, Tong Jia, Chunshuang Chu, Yonghui Zhang, and Zihui Zhang
ObjectiveThe GaN-based microdisk laser based on whispering-gallery modes (WGMs) has the characteristics of high power, low threshold and small size. It has a wide-ranging application prospects and is needed in many fields such as optoelectronic integration, biomedicine and data transmission. However, due to the lack of conductive substrates and poor material grown quality, GaN-based microdisk lasers have long been dominated by light-injected microdisk devices. To achieve an electrically-driven GaN-based microdisk laser, a current block layer is typically introduced in the central region of the microdisk laser. This allows for injection of current only at the edge of the microdisk, resulting in that the low threshold laser output can be achieved, and the heat generation in the central region can be well suppressed. Although the effect of the central current block layer has been reported, there is a lack of sufficient reports on the effect of current block layer size on the microdisk laser and its design guidelines. In this paper, the effect of the gain distribution affected by the current block layer design on the performance of blue laser is systematically investigated. MethodsAccording to the structure of the reported blue microdisk laser, the device structure of this study is designed (Fig.1(a)). The gain material in the active region is set as the Lorentz gain material, the real and imaginary part curves of the refractive index are obtained by setting the material parameters (Fig.1(b)-(c)). The Finite-Difference Time-Domain simulation (FDTD) is used to analyze the effect of the gain distribution on the performance of the blue laser. The no-gain circle region represents the area where current is unable to inject due to the presence of current block layer Results and Discussions Firstly, the performance of the microdisk laser is studied by changing the diameter of no-gain circle region, and the resonance of the device is simulated by FDTD (Fig.3). The results show that there are five distinct modes, all of which exhibit a gradually decrease in power as the diameter of the no-gain circle increases. In addition, the total power output exhibits a decreasing trend with the increase of the diameter of the no-gain circle region. Specifically, the total power first decreases slowly from 0 μm to 0.4 μm, followed by a sharp decrease beyond 0.4 μm (Fig.4). Therefore, when the diameter of no-gain circle is less than 0.4 μm, it will not significantly affect the output power and threshold gain of the laser. Secondly, by adjusting the offset of no-gain circle to align with device edge, the effect of space between no-gain circle and device edge on the performance of the microdisk laser is analyzed. The analysis results show that the powers of the five modes decrease as the no-gain circle gradually approaches to the edge of the device (Fig.5). And compared with the first-order mode, the peak power of the second-order mode decreases faster (Fig.6). Finally, the effect of edge defects on the performance of GaN-based micro laser is analyzed. The peripheral no-gain ring region represents the device sidewall defect area from the dry-etched process. The results show that the peak power of the five modes decreases rapidly with the increase of no-gain ring width (Fig.7). Moreover, when the no-gain ring width increases, the power of the first-order mode decreases faster than that of the second-order mode (Fig.8). This is due to the fact that the distribution range of the first-order mode is closer to the edge of the microdisk. ConclusionsIn this paper, FDTD is employed to investigate the effect of different gain distributions on the performance of blue microdisk lasers. The optimal distance between the edge of the current block layer and the edge of the microdisk is determined to be 0.6 μm. Too large distance will make some current injected in the middle not contribute to the power of the laser, resulting in increased threshold current and heat effects. Conversely, if it is too small, it will increase the absorption of the microdisk laser, thereby reducing the power of the laser. Moreover, if the current block layer is offset due to lithography, it will result in an increase in absorption in device and a reduction in the laser power, especially for the second-order mode. If the edge no-gain region expands due to the increased sidewall defects, the laser power will be significantly reduced, and the power of the first-order mode decreases more rapidly than that of the second-order mode. The results in this paper have significant reference value for the fabrication and design of microdisk lasers.
Jan. 25, 2024Vol. 53 Issue 1 20230401 (2024)
Luda Wang, Weichong Wu, Zhanda Zhu, Zhenxu Bai, Yongling Hui, Hong Lei, and Qiang Li
ObjectiveSolid-state lasers pumped by diode lasers have the advantages of small size, long lifetime, high efficiency, high energy and good beam quality because of the high emission cross section and the matching of the emission and the absorption spectral line. In particular, diode-pumped dual-wavelength solid-state lasers are attractive for environmental monitoring, laser radar for velocity measurement, medical instruments, holography, and terahertz generation. In addition to dual wavelengths, the following laser characteristics are required for these applications. The wavelength spacing between the two lasers must be small enough to generate terahertz waves; The two beams must have nearly equal power; The relative timing of the output pulses must be controllable, so that the output pulses can be in synchrony or in succession ; The two beams must be coincident and the wavelengths must be tunable. For this purpose, a dual wavelength excimer based on spectral beam combining (SBC) is designed in this paper. MethodsSBC comes from the principle of wavelength division multiplexing semiconductor laser transmitters used in communications (Fig.1). Beam combining was achieved using a common external cavity containing a grating, which simultaneously forces each Nd:YAG laser to operate at a different controlled wavelength and forces the beams from the two lasers to coincide. The lasers are arranged in a line at the focal plane of a transform lens. The collimated beams overlap at the grating and the output coupler. The common external cavity forces the beams to copropagate, and each laser has a different wavelength. Results and Discussions The spectrum of the combined beam shows the wavelength spread is 3.1 nm (Fig.3). At a maximum current of 200 A, the pulse energy of Laser 1 is 94 mJ and Laser 2 is 92 mJ before beam combining. The pulse energy of the combined beam is as high as 173 mJ, which corresponds to a combining efficiency of 93% (Fig.4). In the horizontal direction (beam combining direction), the M2 is 2.7 and 2.1 for Laser 1 and Laser 2 before beam combining. The M2 of the combined beam in the horizontal direction is 2.8. In the vertical direction (no beam combining direction), the M2 is 2.2 and 1.9 for Laser 1 and Laser 2 before beam combining respectively. The M2 of the combined beam in the vertical direction is 2.2 (Fig.5). ConclusionsIn summary, we have reported a dual-wavelength laser source by SBC of two solid-state Nd:YAG lasers. The resultant output beam quality is similar to that from a single laser. For the combined beam, a pulse energy of 173 mJ, and a combining efficiency of 93% are obtained. We believe that SBC could also be applied to an actively Q-switched Nd:YAG laser to obtain ns pulse durations and higher peak powers. Furthermore, because of the existence of additional transitions of Nd3+: YAG, it is expected that four or more lasers with different wavelengths (e.g., 1 052 nm, 1 061 nm, 1 064 nm, and 1 072 nm) can be combined in the future.
Jan. 25, 2024Vol. 53 Issue 1 20230411 (2024)
Wenxin Xia, Xiaogang Yang, Jianxiang Xi, Ruitao Lu, and Xueli Xie
ObjectiveWith the rapid development of mobile self-assembling network technology, cooperative control technology, sensing and detection technology, and artificial intelligence technology, unmanned aerial vehicle (UAV) group have gradually shown the characteristics of group intelligence distributed, self-organized and non-cooperative. Timely detection of an attacking UAV group allows for a wealth of countermeasures to be taken effectively. Countermeasures such as navigation deception, physical capture and physical destruction can be taken for a small number of UAV group, but once a large number of UAVs gather to form a UAV group, it is difficult to carry out countermeasures. Therefore, the development of UAV group target detection and identification technology is a prerequisite and key to achieving anti-UAV battlefield situational awareness. The existing target detection algorithms that do not consider the interrelationship between UAV group members, are prone to miss detection, mis-detect group members and fail to sense the structural characteristics of UAV group, we propose a method to sense the structural characteristics of UAV group based on infrared detection. MethodsBased on infrared detection and YOLOv5 algorithm, we propose an algorithm for sensing the structural characteristics of UAV group based on infrared detection, called GMR-YOLOv5 algorithm. The algorithm is designed by fusing the Space-to-Depth Non-strided Convolution (SPD-Conv) module with the Channel Attention Net (CAN) module to design the Space to Depth-Channel Attention Net (SD-CAN) module. The SPD-Conv module can convert the UAV features from the spatial dimension to the channel dimension, compared with the channel attention mechanism, which does not focus on the correlation between channels, and the designed SD-CAN module can realize the conversion of target features from the spatial dimension to the channel dimension, and also focus on the UAV features in the channel. Meanwhile, for the problem that the texture features of the UAV group members are not obvious in the infrared images, the Group Members relation (GMR) is constructed. This module makes full use of the structural information of UAV group members such as their positions and bounding box sizes in the infrared image, and incorporates the structural information of UAV group members into the association information between group members. Compared with the existing target detection algorithms, the proposed group membership relationship module in this paper considers the information such as the position and bounding box size of UAV group members in the image. Finally, the two constructed modules are fused to the YOLOv5 base network. The algorithm validation experiments are carried out on the self-built UAV group dataset. Results and Discussions Experimental validation was carried out on the constructed Drone-swarms Dataset (Tab.1, Fig.4), and the experimental results showed that the mAP of the GMR-YOLOv5 algorithm proposed in the paper reached 95.9%, which improved the mAP of the original YOLOv5 algorithm by about 7%, effectively improving the detection accuracy of UAV group members (Tab.4). Meanwhile, the detection speed reached 59 FPS, which achieves real-time detection of UAV group targets and perception of UAV group structure characteristics. Compared with the classical detection algorithm, the GMR-YOLOv5 algorithm reduces the cases of missed and false detection of UAV targets (Fig.5-Fig.9). Ablation experiments are also conducted to demonstrate the effectiveness of each part of the improved module. The experimental results show that the proposed algorithm in the paper, although the detection speed is reduced, it has different degrees of improvement in the indexes mAP@0.50, mAP@0.50:0.95 (Tab.5). ConclusionsWe propose an algorithm for sensing the structural characteristics of UAV group based on infrared detection. Firstly, the SPD-Conv module and the CAN module are combined to build a SD-CAN module, which not only converts drone features from the spatial dimension to the channel dimension, but also uses the channel attention mechanism to make the network pay more attention to the features of group in the channel, which improves the detection network's feature extraction ability for UAV group members. Secondly, using the position of group members in infrared image, boundary frame size and other structural information, the proposed GMR module, which generates connections among UAV group members, and then improves the detection and localization ability of the network for UAV group members. Meanwhile, the SIoU loss function is used to accelerate the convergence of the network. Finally, experimental validation is carried out on the UAV group dataset, and finally a network model with mAP of 95.9% and detection speed of 59 FPS is obtained to achieve UAV group structure characteristic sensing.
Jan. 25, 2024Vol. 53 Issue 1 20230429 (2024)
Shan Xue, Hongyu An, Qiongying Lv, and Guohua Cao
ObjectiveOnce the "black flying" drone carries items such as bombs, it can pose a threat to people. Target detection of "black flying" drones in complex backgrounds such as parks, amusement parks, and schools is the key to anti-drone systems in public areas. This paper aims to detect small-scale targets in complex background. Because the traditional manual image feature extraction methods are not targeted, time complexity is high, windows are redundant, the detection effect is poor, and the average accuracy is low. The problems of false detection and missing detection will occur when detecting small-scale UAVs in complex background. Therefore, this paper aims to develop a black flying UAV detection model based on deep learning, which is essential for the detection of unmanned aerial vehicles. MethodsYOLOv7 is a stage target detection algorithm without anchor frame, with high detection accuracy and good inference speed. YOLOv7-tiny belongs to the grain grabbing memory model, with fewer parameters and fast operation, making it widely used in industry. In the backbone network, the built multi-scale channel attention module SMSE (Fig.5) is introduced to enhance the attention of UAVs in complex backgrounds. Between the backbone network and the feature fusion layer, the RFB feature extraction module (Fig.6) is introduced to increase the Receptive field and expand the feature information extraction. In the feature fusion, the small target detection layer is added to improve the detection ability of small UAV targets. In terms of calculating losses, the introduction of SIoU Loss function redefines the penalty index, which significantly improves the speed of training and the accuracy of reasoning. Finally, the ordinary convolution is replaced by the deformable convolution (Fig.7), making the detection closer to the shape and size of the object. Results and Discussions The dataset selected in this article is a combination of the self-made dataset (Fig.1) and the Dalian University of Technology drone dataset (Fig.2). The mainly used evaluation indicators are mAP (mean accuracy) and FPS (detection speed), Params (parameter quantity) and GFLOPS (computational quantity) as secondary indicators. Each module was compared with the original algorithm, including attention comparison experiment (Tab.1), RFB module comparison experiment (Tab.2), small target detection layer comparison experiment (Tab.3), Loss function comparison experiment (Tab.4), and deformable convolution comparison experiment (Tab.5). And ablation experiments were conducted (Tab.6), which confirmed the effectiveness and feasibility of the proposed algorithm through mAP comparison, improving accuracy by 6.1%. On this basis, the detection performance of different algorithms was compared (Tab.7), and the generalization of the algorithm was verified on the VOC public dataset (Tab.8). ConclusionsThis article proposes an improved object detection algorithm for anti-drone systems. Through the multi-scale channel attention module, the attention of small targets is enhanced, the fusion RFB increases the Receptive field, adds a small target detection layer to improve the detection ability, and improves the Loss function to improve the training speed and reasoning accuracy. Finally, deformable convolution is introduced to better fit the target size. The improved algorithm has achieved good detection results on different datasets.
Jan. 25, 2024Vol. 53 Issue 1 20230472 (2024)
Shusen Zhao, Hongzhi He, Shifei Han, Lu Jiang, Jiabao Du, Haijuan Yu, Xuechun Lin, and Guling Zhang
Significance Transparent hard brittle materials have been widely used in the fields of semiconductors and electronics due to their excellent mechanical properties, thermal stability, corrosion resistance, and optoelectronic properties. The traditional slicing method for transparent hard brittle materials has low efficiency and high material loss, which restricts the promotion and application of hard brittle materials. Diamond wire cutting is commonly used in the cutting of high-hardness and brittle materials. The existing substrate processing technology has slow cut speed, and there is a large loss of transparent and brittle materials and cutting lines. Every time a piece of transparent and brittle material is processed, a large amount of wire cutting loss will be caused by wire saw cutting, greatly increasing the cost of splitting transparent and brittle materials. The laser assisted separation technology, which leads to expensive separation processes, is a new method for slicing transparent hard brittle materials in recent years. It revolutionarily utilizes nonlinear optical effects to make laser pass through transparent hard brittle materials, causing a series of physical and chemical processes such as thermal damage and laser induced ionization inside the transparent hard brittle materials, forming a thin modified layer, and ultimately achieving the splitting of transparent hard brittle materials. Compared with traditional diamond wire cutting methods, it greatly improves the slicing efficiency and material utilization of hard and brittle materials. In the field of laser processing of hard and brittle materials, it has developed into a common focus of academic research and industrial applications. ProgressThis article provides an in-depth analysis of the physical process of laser separation of transparent hard brittle materials and summarizes the key scientific issues in the process of laser separation, which are the nonlinear absorption of laser by transparent hard brittle materials, the evolution of the internal microstructure of transparent hard brittle materials under laser action, and the mechanism of the influence of laser field regulation on material modification. Combining special optical design, beam shaping, multi-factor coupling and stripping techniques and based on these scientific issues, this article reviews the research progress of laser separation of different types of transparent hard brittle materials in recent years. At present, materials used for laser separation include semiconductor materials such as SiC (Fig.8), Si, GaN (Fig.12), diamond (Fig.13), and ceramic materials such as sapphire, polycrystalline Al2O3, and zirconia. Laser separation technology has developed multiple splitting methods. For example, ultrafast laser dual pulse induced separate, ultrafast laser chemically assisted splitting, multiple laser composite splitting, etc. Multiple companies and research institutes at home and abroad are actively promoting the research and development of fully automated laser stripping equipment, with laser technology as the core for industrial and specialized manufacturing machines. Conclusions and ProspectsThe physical process of vertical laser detachment is a typical interdisciplinary problem in the thermodynamics of laser materials. Laser splitting can almost completely avoid the cutting loss caused by conventional multi-wire cutting technology. Only the peeled lenses need to be ground and polished, so the loss of each transparent hard brittle material can be significantly reduced to below 100 microns, thereby increasing the production of transparent hard brittle materials. Despite significant breakthroughs and rapid development in experimental results, there is still a lack of in-depth theoretical and numerical simulation research on the process mechanism of laser separate technology. In the future, the vertical laser splitting technology for hard and brittle materials will develop towards ultra-thin material splitting with smaller material losses below 100 microns, low damage of modified layers, and process adaptability. In addition, laser splitting technology can also be applied to the development of transparent hard and brittle materials in areas such as thinning, polishing, and surface modification. This paper provides greater technical support for the rapid development of semiconductors and electronics.
Jan. 25, 2024Vol. 53 Issue 1 20230487 (2024)
Zhehe Yao, Wenke Dai, Pengjin Zou, Peijiong Yu, Fabo Wang, Yiming Chi, Zhenqiang Sun, Qunli Zhang, and Jianhua Yao
ObjectiveMechanical components in marine and mining fields have long served in harsh environments of mechanical wear and electrochemical corrosion. The interaction of friction and corrosion will accelerate the damage of the component surface and reduce its service life. At present, in order to improve the wear resistance of components, the method of preparing ceramic particle reinforced metal-based composite coating on the surface of the substrate is widely used. Due to the excellent chemical stability, wettability and adhesion, WC particles have become one of the most commonly used ceramic particles in reinforced coating produced by laser cladding. However, under the action of high-energy laser beam, the dissolution of WC particles will change the phase composition and microstructure of the reinforced coating, thus affecting its corrosion resistance. In order to solve the problem that the WC particles reinforced coating is difficult to have both high wear and high corrosion resistance produced by laser cladding, ultrasound is introduced into laser melt injection process. The effects of ultrasonic vibration on the microstructure, microhardness, wear and corrosion resistance of the coating were analyzed. The study provides reference for the preparation of WC particles reinforced coating with high wear and high corrosion resistance. MethodsThe experimental setup for ultrasonic-assisted laser cladding (Fig.1) is mainly composed of fiber-coupled semiconductor laser, cooling system, motion control system, powder feeder and ultrasonic vibration device. The substrate used in the experiments is 316L stainless steel plate. The powder used in the experiments is a mixed powder of 316 powder and WC particles with the mass ratio of 1 : 4, while the particles size are 70-100 μm and 50-100 μm (Fig.1). Based on the developed experimental setup, the laser cladding experiments with and without ultrasound are carried out. After the experiments, the cross section (perpendicular to the laser scanning direction) and the longitudinal section (parallel to the laser scanning direction) of the laser cladding layer are sampled, polished and etched. The microstructure of the sample was characterized by optical microscope, scanning electron microscope and the chemical composition was determined by EDS analysis. Meanwhile, the hardness, wear and corrosion resistance of the cladding layer were tested. Results and Discussions After ultrasonic assisted laser cladding, the average grain size around WC decreased from 101.0 μm to 59.6 μm, and the surrounding structure and elements are more uniform (Fig.2-4). Due to the effect of ultrasound, the precipitation of fishbone carbide around WC is inhibited. At the same time, the alloy reaction layer on the surface of the WC is dissolved, resulting in the average microhardness of the sample increasing from 310 HV0.1 to 425 HV0.1, and the hardness distribution around the tungsten carbide particles is more uniform (Fig.6). The wear resistance of the composite coating was further improved by increasing the hardness (Fig.7-8). The mass loss and wear rate of the sample without ultrasonic assisted laser cladding were 8.8 mg and 0.043 8 mg/m, respectively, and the maximum depth of the wear mark was about 53 μm. The mass loss and wear rate of the sample with ultrasonic are 6.5 mg and 0.032 3 mg/m, respectively, and the maximum depth of the wear marks is about 26 μm. The addition of ultrasound reduced the wear rate by 26.2%. In addition, the introduction of ultrasound did not change the overall corrosion open circuit potential and pitting potential of the cladding layer, but it reduced the corrosion current density (Fig.9), improved the penetration resistance of the corrosive medium on the surface of the coating (Fig.10), and improved the corrosion resistance. Ultrasonic vibration assisted laser cladding can dissolve the alloy reaction layer on the surface of tungsten carbide and increase the hardness of the coating through the uniform distribution of acoustic flow, thus improving the wear resistance of the cladding layer. At the same time, due to the cavitation of ultrasound, the epitaxial growth of columnar dendrites is broken, the grains are refined, and a denser grain boundary is formed. In a corrosive environment, a stable and continuous passivation film can be formed faster because of the increase of the grain boundary, thus improving the corrosion resistance of the WC particles reinforced coating. ConclusionsIn this paper, ultrasonic assisted laser cladding technology was used to prepare WC particles reinforced coating. The microstructure, hardness, wear and corrosion resistance of the coating under the influence of ultrasound were compared and analyzed. In the non-ultrasonic cladding layer, a large number of columnar crystals existed around WC, accompanied by some element segregation bands, due to the acoustic cavitation effect of ultrasound. The average grain size around WC in the ultrasonic cladding layer is refined from 101.0 μm to 59.6 μm, and there is no obvious segregation phenomenon; The average microhardness of WC particles strengthened coating without ultrasonic is 310 HV0.1, and the hardness around WC decreases from 480 HV0.1 to 320 HV0.1. The average microhardness of WC particles strengthened coating with ultrasonic is 425 HV0.1, and the hardness around WC decreases from 426 HV0.1 to 413 HV0.1. The weight loss and wear rate of samples without ultrasound were 8.8 mg and 0.0438 mg/m, respectively. The mass loss and wear rate of samples with ultrasound were 6.5 mg and 0.0323 mg/m, respectively. The maximum depth of samples without ultrasonic scratches was about 53 μm, and the maximum depth of samples with ultrasonic was only about 26 μm. The introduction of ultrasound reduced the wear rate by 26.2%. The corrosion current densities of the electrochemical samples with and without ultrasonic are 2.13 μA /cm2 and 5.20 μA /cm2, respectively. Ultrasonic assisted laser cladding of WC particles reinforced coating has better wear and corrosion resistance.
Jan. 25, 2024Vol. 53 Issue 1 20230542 (2024)
Haizhi Song, Zichang Zhang, Qiang Zhou, Guangwei Deng, Qian Dai, and You Wang
Significance Quantum information science has now attracted significant attention, since it has been well proved and is believed to support quantum computation, quantum communication and quantum metrology in the near future. Characteristics of quantum states have opened the opportunities to accomplish tasks beyond classical limits, resulting in a frontier field of quantum technologies. Among them, quantum computation technology can accelerate the speed of computers exponentially with respect to the classical machine. Quantum communication technology guarantees completely secure communication, and quantum measurement technology can greatly optimize the sensitivity and/or resolution of many instruments. These potential accomplishments have led to the development of innovative and advanced applications in various fields, and therefore people are presently struggling to construct efficient quantum information systems and quantum networks. To realize practical quantum information systems and quantum networks, fundamental devices must be firstly well developed. The successful fabrication of superconductor quantum circuit chips led to an achievement of constructing quantum computer consists of 127 qubits. Realization of more general quantum computers needs much larger scaled, more robust, more quantum logic circuit chip consisting of probably superconductors, cold atoms, semiconductors, photonic crystals etc. The primary obstacles in establishing a quantum network involve the distribution of entangled qubits among nodes that are physically distant from each other, which needs high-performance entangled photon source and quantum memory. Among various types of quantum devices, optoelectronic devices play a key and central role, since the advanced microelectronic, optical and optoelectronic platforms enable fabricating the building blocks for most of the quantum information processing systems. Technologies based on optoelectronics have the potential to realize a complete product chain in the field of quantum information. This work shows the study or fabrication of optoelectronic quantum devices including single photon sources, photon entanglers, single photon detectors, quantum memories and opto-electro-mechanical sensors. Progress Single photon emitters refer to the light sources that release light in the form of individual particles or photons. Single photon emitters are the fundamental devices for quantum communication. They are also well used in quantum detection and photonic quantum computation. In this direction, we have studied single photon emitters based on quantum dot (Fig.1), heralded single-photon sources (Fig.2-3), and a quantum random number generator (Fig.4). Quantum entanglement is a phenomenon that arises when a collection of particles is created, interact, or exist in close proximity to each other in such a manner that the individual quantum states of each particle cannot be figured out independently from the states of the others, even if these particles are widely separated. As a fundamental resource, quantum entangled light sources are widely used in quantum information processing. We have made a comprehensive study on the performance improvement (Fig.5-7), chip integration (Fig.8) and application (Fig.9-10) of entangled photon sources. A single photon detector is a photodetector which can respond to incident light signal as weak as one single photon. Single photon detectors play a widespread role in the field of quantum information processing since they serve as key devices for, e.g., readout in quantum computing, receiving in quantum communication and photon measurement in quantum metrology. This research is focused on specially designed single photon avalanche detectors (Fig.11), focal-plane single photon avalanche detectors (Fig.12), and negative feedback avalanche diodes (Fig.12). Moreover, we have proposed fiber Bragg grating sensing system by utilizing single photon detectors (Fig.13). In addition to the optoelectronic devices described above, we have also conducted abundant research on fiber-based quantum memory (Fig.14), optomechanical quantum device (Fig.15) and nano-opto-electro-mechanical system (Fig.16). All our studies will impact on the application of quantum technologies. Conclusions and Prospects In order to realize practical quantum systems in the future, our group have made efforts to create and investigate quantum devices by using optoelectronic techniques. QD-embedded nanocavities were designed to improve the efficiency of and to realize on-demand single photon emitters. Spectral multiplexing technique enabled the fabrication of a heralded single photon source with high purity and speed, approaching on-demand single photon emitting. A quantum random number generator working at room temperature was constructed based on single photon emitting from defects in commercial GaN material. Applying cascaded second-order nonlinear optical process in PPLN waveguides, we developed an entangled photon emitter with fidelity of 97% and noise level nearly 10 times better. Chip-integrated photon entangler with visibility of over 99% was established by fabricating Si3N4 micro-rings via micro/nano-processing. Readout circuits were optimized to help fabricating high quality SPAD devices, and SPAD focal plane devices were improved to 128×32 array for single photon and quantum imaging. A quantum memory was achieved to simultaneously store 1 650 single photons at low temperatures, and a few opto-electro-mechanical devices were experimentally tried to obtain quantum-level measurement ability for minor quantities. Our studies might be a step forward to the realization of practical quantum information networks.
Jan. 25, 2024Vol. 53 Issue 1 20230560 (2024)
Huadong Lu, Jiawei Li, Pixian Jin, Jing Su, and Kunchi Peng
Significance:All-solid-state single-frequency continuous-wave (CW) laser have found extensive applications in diverse domains such as the generation of non-classical light fields, cold atom physics, detection of gravitational waves, and so on, which primarily attributed to their merits of low noise, narrow bandwidth, excellent beam quality, and high power stability. In line with the advancement in science and technology, the output power of the traditional all-solid-state laser (ASSL) cannot satisfy the application requirements of many frontier research fields, so it is necessary to further scale the ASSL power and simultaneously maintain other excellent performance. For the purpose of improving the output power of the ASSL, its pump power has to be primarily elevated. However, with the increasement of the pump power, the laser gain is enhanced, and the non-oscillating laser modes of the ASSL start to oscillate, which results in the mode-hopping or the multi-mode oscillating operation of the ASSL. Moreover, the severe thermal effect of the laser gain medium and its relatively lower damage threshold also further restrict the improvement of the ASSL power. In this paper, an effective method of improving the all-solid-state single-frequency CW laser power via deliberately introducing a nonlinear loss into the resonator was presented. When the nonlinear loss was introduced, the nonlinear loss of the lasing mode was half of that of non-lasing mode, and the non-lasing mode was effectively inhibited, under the mode competition of the laser. As a consequence, the stable single-longitudinal mode operation of the laser can be guaranteed at higher laser gain. In addition, the design of multi-laser-crystal resonator can be adapted to efficiently mitigate the negative impact of the thermal effects of the laser crystal. By combining the nonlinear loss technique and the multi-laser-crystal resonator scheme, the output power of the all-solid-state single-frequency CW laser had been scaled up to 100-watt level and continuously increased.Progress: First, the fundamental principle of mode selection implemented by intra-cavity nonlinear loss is presented. When the nonlinear loss is introduced into the resonator, the nonlinear loss of the lasing mode is half of that of the non-lasing mode, and the non-lasing modes are suppressed effectively under the mechanics of mode competition. Based on the principle above, the physical condition of stable SLM operation for ASSL is proposed. The condition depends on the intra-cavity linear and nonlinear losses, which is experimentally validated by changing the transmission of the output coupler. In the experiment, when the output coupler transmission is 19%, and the temperature of the type-I phase matched nonlinear crystal LBO is 149 ℃, the maximal output power of 33.7 W for the stable single-frequency 1064 nm laser is realized. On this basis, the intra-cavity round-trip loss of an ASSL is measured precisely by simply changing the temperature of the nonlinear LBO crystal to manipulate the nonlinear loss within the SLM region of the laser. According to the measured results and the oscillating condition of the ASSL, the output coupler transmission of the designed laser as well as its pump power is further optimized and the maximal output power of 50.3 W for the single-frequency 1064 nm laser is obtained. To further increase the output power of the single-frequency laser, the pump power of the laser has to be raised. However, the sever thermal effect of the laser gain medium and its lower damage threshold restrict the continuously increasing of the single-frequency laser power. For the purpose of breaking aforementioned restriction and attaining higher power single-frequency laser, a laser resonator with two identical laser crystals was designed, where the precise mode-reproduction of the two crystals was implemented by a pair of lenses with identical focal length of 100 mm. When the total pump power was 240 W, a single frequency 1064 nm laser with maximal output power of 101 W was realized. In this laser, the focal lengths of the two lenses were fixed, so the laser only would be operated at a given incident pump power, and simultaneously the optical length between the imaging lenses had to be precisely adjusted. To this end, a self-mode-matching laser with four laser crystals in a single resonator was further designed. The total four laser crystals were used for both laser gain media and mode-matching elements. Under an appropriate combination of pump powers on four crystals, a stable CW single-frequency 1064 nm laser with 140 W power was obtained.Conclusions and Prospects: Introducing nonlinear losses within the resonator is a robust way to realize SLM laser output, which has been experimentally proved. With multiple gaining crystals inserted in one cavity, the heat load on each crystal is effectively shared, so more total power is tolerable. With suitable mode matching and mode reproducing in the resonant, a high-power single-frequency CW ASSL has been designed and built which can deliver 140 W single-frequency CW laser, this is to our knowledge the highest SLM ASSL power. The progress in high-power single-frequency ASSL has significantly broadened its potential applications and made substantial contributions to the advancement of related disciplines.
Jan. 25, 2024Vol. 53 Issue 1 20230592 (2024)
© Copyright 2018-2021 | Chinese Laser Press.
All Rights Reserved 沪ICP备15018463号-20