


 View fulltext

2023
Volume: 52 Issue 9
34 Article(s)

Longhai Yin, Yanwei Li, Junchi Li, Xin Li, He Huang, Xinwang Xie, Shengtao Fang, and Binzhi Zhang
ObjectiveWith the increasing requirement of satellite imaging quality, the aperture of the main mirror of the optical system is also increasing, and the large-aperture mirror must be designed with lightweight structure. In order to improve the processing efficiency, the main mirror needs to be roughed before polishing to remove the surface allowance during the sintering casting of the mirror embryo, but the ultra-thin and lightweight design of the mirror makes roughing very difficult. On the one hand, the ultra-thin mirror increases the brittleness of the mirror itself, and it is easy to crack the mirror surface by excessive stress during processing. On the other hand, the design of the lightweight hole on the back of the mirror will reduce the stiffness and natural frequency of the mirror, resulting in the mirror easily resonating with the processing system during the milling process, so that the mirror is destroyed. At present, manual grinding or ultrasonic vibration milling methods are generally used for rough machining, but these two processing methods have low surface removal efficiency and long processing cycle, which can't meet the needs of space optical systems for development cycle. Therefore, it is necessary to establish a milling method with higher surface removal efficiency and accuracy. For this purpose, an ultra-precision milling technology of large-aperture ultra-lightweight SiC mirror is established in this paper.MethodsA five-axis high-efficiency milling ultra-precision machining method was proposed by using finite element analysis. Through the analysis of the resonance mechanism in the milling process of the mirror, the causes of resonance were explained (Fig.4). The finite element analysis method was adopted to simulate and verify that the mirror would not be damaged and the system would not have resonance during the machining process (Fig.6-8). An ultra-lightweight SiC mirror was quickly milling (diameter is 510 mm, the wall thickness is 4 mm, the lightweight rate is 92%) with the support of designed ring tooling (Fig.10).Results and DiscussionsThe mirror is machined by means of parallel feed cutter, and the shape of the mirror is measured by interferometer. The initial Peak-to-Valley (PV) value of the mirror was 956.1 μm (Fig.11), the mirror removal amount is 1 mm, and the processing time is only 48 h, which is 90% lower than that of manual grinding. The PV value of surface is 3.5 μm (Fig.11), which meets the requirement that the PV value before mirror polishing should be better than 4 μm. The experimental results show that the scheme is feasible and can be used for high-efficiency and high-precision machining of large-caliber ultra-lightweight mirror ConclusionsAiming at the problem that the surface roughness of large-caliber ultra-thin lightweight silicon carbide mirror is difficult and the cycle is long, a five-axis high-efficiency ultra-precision milling method is proposed. Using the milling method of parallel cutter feeding, the annular tool was used to assist the edge support of the mirror, and the advanced CAE simulation technology was used to verify the fast milling process of the large diameter Ф510 mm lightweight silicon carbide mirror. Simulation and testing results show that compared with manual grinding, this processing method can reduce the processing cycle by 90% under the premise of ensuring the processing accuracy, and there is no mirror damage and system resonance in the processing process. This method has been successfully used in the rough machining of large-diameter ultra-thin lightweight silicon carbide mirror, which can replace the traditional grinding method and can be used as a technical reference for other large-diameter mirror machining.
Sep. 25, 2023Vol. 52 Issue 9 20230270 (2023)
Weifeng Du, Yanqing Wang, Lihui Jiang, Xiaonan Mao, and Nan Chen
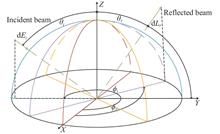
ObjectiveStar sensor are mainly used to achieve star attitude and perceive non-cooperative targets. When the equivalent magnitude of a constant star or non-cooperative target is large, the detection and capture of stars or sensing targets will cease to be effective due to the influence of stray light. Therefore, the suppression performance of stray light is a key technical indicator of situational awareness sensors. Engineering experience has shown that a first-order sunshade can reduce sunlight to 10-5-10-6, effectively reducing sunlight pollution on the detector image surface and improving the probability of target capture. In the design stage of the baffle, the scattering characteristics of the extinction coating on the inner surface of the baffle are often modeled as Lambert bodies, resulting in significant differences between the actual and expected values of the extinction performance; During the processing stage of the light retaining ring, the thickness of the cutting edge is often ignored, resulting in significant differences between the actual and expected values of the extinction performance of the light retaining ring. MethodsTo solve the technical problem of projects mentioned above, this article conducts theoretical and engineering research from two technical approaches of measurement and modeling of BRDF, and cutting edge thickness measurement. Firstly, based on the commonly used fitting formula of BRDF, the visualized model for the scattering characteristics of Magic black extinction coating on the aluminum alloy base of 1.0 μm thickness is built. The blue box represents the measurement data and the white box represents the fitting data (Fig.4). The figures demonstrate the scattering characteristics of the coating surface BRDF values changing with different incident zenith angles and reflected zenith angles when the detection azimuth angle is 180° and the incident light wavelengths are 500 nm, 550 nm, 600 nm, 650 nm, and 700 nm, respectively; Secondly, edge thickness detection is carried out (Fig.5). Considering the particularity of the position of the edge structure, this paper proposes a dual telecentric coaxial light illumination scheme for edge thickness detection. The detection optical path is shown (Fig.6). The basic principle is that the collimated light source is incident onto the right side optical path through a semi-transparent and semi-reflective mirror, and is reflected onto the edge of the light blocking ring through a reflector. Due to the use of a coaxial telecentric optical path, the edge imaging is clear and sharp. The beam scatters return to the optical path through the edge. After passing through a semi-transparent and semi-reflective mirror, the imaging side's telecentric optical path is incident onto the detector's image plane. As shown in Fig.9, calibration with the imaging instrument, the measurement accuracy is better than 1.2 μm. The measurement data of the cutting edge is shown (Fig.12), 30 points are collected from each light blocking ring cutting edge, evenly divided into one circle. The figures show that the thickness of the cutting edge at each point is different, while the thickness variation range is controlled within 20-27 μm.Results and DiscussionsIn the article, quantitative testing of the extinction ratio of the light shield and outdoor stray light observation testing are used to evaluate the stray light suppression performance of the baffle. The quantitative testing plan and equipment used for extinction ratio are shown (Fig.13, Tab.2), and the test data is shown (Fig.15). The three extinction ratio curves represent the theoretical values, measured values, and Lambert scattering model values after using the BRDF model. The starting angle of the test is 24° and the ending angle is 72°. From the graph, it can be seen that within the range of 24° to 60°, the test value is close to the theoretical value, with a deviation of about 12%, and the data trend is consistent; The dark room stray light test (photoelectric whole machine test) is shown (Fig.16), and the test data is shown (Fig.17). When the sunlight and the optical axis of the situation sensing sensor are incident at 24°, the average gray level of the image plane is 55.80, the maximum gray level is 134, the RMS is 10.73°, and the entropy is 6.18. As the testing angle gradually increases, the average gray level is 51.35 at 12°; The field stray light star observation test site is shown (Fig.18), and the experimental data is shown (Fig.19). Under stray light irradiation conditions, the background gray level of the image increases, and the signal-to-noise ratio between the original star target and the deep space background decreases. The stray light contaminated area may produce false star point targets or equivalent dark current noise or detector electronic noise, resulting in errors in attitude recognition process.ConclusionsThis article demonstrates the detection result of key components of the baffle in the process of suppressing stray light for situational awareness sensors from two different stages of design and processing. The design stage mainly tests the bidirectional reflection distribution function based on the scattering characteristics of the Magic black extinction coating on the process components, and fits visual data suitable for optical simulation analysis; In the processing stage, based on the key characteristics of the cutting edge, a coaxial dual telecentric optical path is proposed to detect its thickness, a testing platform was built, and the measured data of the cutting edge were obtained; In the verification section of the article, quantitative testing of the extinction ratio of the baffle was carried out, and its extinction performance was further verified by testing the stray light of the entire machine. The data shows that the deviation between the quantitative test value and the theoretical simulation value of the extinction ratio was 12%, and the average gray level of the image caused by sunlight incident at 24° on the hood was 55.80; The accuracy of star point positioning is changed from 2.5″ (3σ) without stray light pollution to 3.0" (3σ). This article provides a theoretical basis and technical support for the detection method of the situation perception sensor cover for other optoelectronic sensors.
Sep. 25, 2023Vol. 52 Issue 9 20230450 (2023)
Guoyan Sun, Xiabin Ji, Jiaoteng Ding, Jigong Zhang, and Hang Cheng
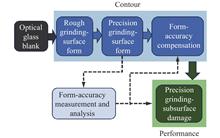
ObjectiveLarge Aperture Off-axis Aspherical Optical Elements (LAOAOE) have been increasingly demanded, such as space/ground-based large aperture telescopes, aerial optoelectronics or ground tracking & sighting instruments. Moreover, the requirements for the larger aperture and shorter processing cycle make it be the core problem to manufacture the large aperture off-axis aspheric optical elements with the highly efficient and high-precision manufacturing. For instance, the processing cycle for the LAOAOE with the diameter of 1 meter is required to be 2-3 months. As the highly efficient removal process for the LAOAOE, surface form accuracy and damage depth of precision grinding having directly determined the processing difficulty and processing cycle of the subsequent polishing processing. Therefore, the high precision grinding process of shape-performance control for LAOAOE are investigated in this paper. In other words, it is required to improve the surface form accuracy and reduce the depth of grinding damage, simultaneously. The numerical collaborative approximation of both items is needed to be achieved in the end.MethodsIn terms of the surface form control, it was identified the main factors for the machine tool structure, which affect the surface form accuracy of low-frequency surfaces. To achieve collaborative control and accuracy optimization of process parameters, the investigations were conducted to explore the influence laws between the surface shape accuracy and the A-axis zero error, Y-axis alignment error, shape and size error of grinding wheel, grinding wheel path, Z-axis surface compensation and so on. For the performance control, the influence laws between the grinding damage depth and grinding parameters were obtained, and the mapping relationship between the grinding damage depth and grinding surface roughness were established. The suppression strategy of the subsurface damage strategies for LAOAOE was proposed in the end. Results and DiscussionsFirstly, the form accuracy (PV) of the grinding surface was significantly affected by multiple factors. The A-axis zero error variation of 0.001° had led to the change of 5.47 μm (the theoretical value)/6.9 μm (the experimental value) in surface form accuracy (PV). The Y-axis alignment error variation of 0.07 mm had caused the change of 7.9 μm (the theoretical value)/9 μm (the experimental value) in surface form accuracy (PV). Surface form accuracy had also been significantly affected by the profile error of grinding wheel, grinding method and approach as well as the Z-axis error compensation. For the reasons as above, the improvement of grinding surface form accuracy is subject to the collaborative control and optimization of the above factors. Moreover analysis based on indentation fracture mechanics revealed that there was a corresponding relationship between the grinding subsurface damage depth and surface roughness. When the damage depth was less than 5 μm in the experiment, the surface roughness Ra was below 30 nm and Rz lower than 0.25 μm, all of which could be used as the basis to control the grinding damage. Finally, after the shape and property-controlled grinding of off-axis aspheric lens with an aperture of 640 nm, the surface form accuracy could reach 3.1 μm with the surface roughness Ra less than 24 nm, Rz lower than 0.2 μm. According to the relationship between the surface roughness and the depth of the subsurface damage, the estimated depth of damaged layer was lower than 5 μm. It was verified that the subsequent polishing duration had been significantly shortened. ConclusionsFor the LAOAOE, the grinding surface form accuracy can be efficiently improved by the deterministic analysis, control and compensation on the various factors affecting surface form accuracy. By mastering the mapping law between the grinding subsurface damage depth and surface roughness, the measurement on surface roughness can realize the indirect control of subsurface damage depth. Also, the combinatorial optimization of grinding process can achieve the efficient improvement and collaborative control of form property precision, which will lead to the significant reduction of polishing period for the optical elements with large aperture. It will be of great reference value for the efficient high-precision processing of optical elements with large aperture.
Sep. 25, 2023Vol. 52 Issue 9 20230454 (2023)
Mengxue Cai, Xiaokun Wang, Zhiyu Zhang, Lingzhong Li, Jing Wang, Wenhan Li, and Xuejun Zhang
ObjectiveThe instrument transfer function, which accurately reflects the instrument's response characteristics in spatial frequency, is widely used in instrument specifications. Currently, flat test boards engraved with single-step features or sinusoidal features of different periods are commonly used to measure the instrument transfer function of interferometers. However, when it comes to calibrating the instrument transfer function for high-steep spherical/non-spherical mirror testing, there is an issue with using flat test boards.MethodsTo address this problem, a method is proposed to calibrate the instrument transfer function for high-steep mirror testing on spherical surfaces using sub-aperture stitching, based on a spherical step test board. The spherical step test board is manufactured using ultra-precision turning technology, and the steps within the measuring apertures are located and sampled using gradient localization and rotation matrix operations. The power spectral density of the measured surface shape of the steps is obtained using Fourier transform methods, and then compared with the power spectral density of an ideal surface shape to obtain the instrument transfer function.Results and DiscussionsBy combining examples, a spherical step test board with a diameter of 100 mm, a curvature radius of 100 mm, and concentric circular step structures was subjected to stitching testing and data analysis. The experimental results show that within the spatial frequency range of 1 mm-1, the average testing level of each sub-aperture for high-steep mirrors can reach 82.72%, indicating a good testing accuracy. However, as the spatial frequency approaches 1.5 mm-1, the testing level decreases to only 40%-60% for each sub-aperture, indicating poorer performance of the instrument transfer function. ConclusionsThis article proposes a method for calibrating the sub-aperture stitching instrument transfer function of high-steep mirror surfaces using a designed spherical step test board. In this method, a spherical test board with concentric circular ring step structure is used, which allows for the calculation of the instrument transfer function at different positions of each sub-aperture. The testing accuracy of each sub-aperture can be obtained, thereby achieving the overall calibration of the instrument transfer function.
Sep. 25, 2023Vol. 52 Issue 9 20230462 (2023)

Dong Yan, Chengli Guo, Quan Liu, Fazhi Li, Chenyang Yu, Yang Ma, Yulong Zhang, and Lisong Yan
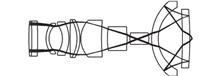
ObjectiveTo fulfill the stringent high-resolution prerequisites of the imaging system deployed for semiconductor defect detection, a catadioptric objective lens with a large numerical aperture, specialized for near-ultraviolet to visible light wavelengths, has been meticulously devised in accordance with the distinct characteristics and design parameters of the system. The dispersive traits of optical glass materials within the near-ultraviolet to visible light spectrum are subjected to comprehensive analysis. In order to ameliorate the secondary spectrum of the optical system, a judicious selection of appropriate glass material is undertaken based on rigorous theoretical calculations of the second-order spectrum. The constructed objective lens, comprising an assemblage of 11 spherical lenses, exhibits a compact architectural arrangement. Specifically engineered for spectral coverage spanning 360-520 nm, the objective lens boasts a numerical aperture of 0.9, a focal length of 5.65 mm, a field of view measuring 0.8 mm, and an operative distance of 0.8 mm. This innovative design embodies an infinite conjugate catadioptric configuration. The results of this design endeavor reveal a favorable Modulation Transfer Function (MTF) for the objective lens, with wave aberrations across the entire field of view quantified at less than 0.09λ (λ=632.8 nm). Furthermore, diverse geometric aberrations are effectively rectified, aligning with the stringent apochromatic prerequisites. The resultant objective lens configuration not only conforms to these demanding optical standards but also underscores simplicity in its architectural layout and an extensive operational working distance. This facilitates convenience in practical production assembly and application. MethodsIn the context of wide-spectrum large numerical aperture objectives, the mitigation of field curvature and secondary spectrum emerges as a focal point meriting dedicated consideration. Consequently, meticulous assessment of the field curvature and axial chromatic aberration within the system is conducted in accordance with foundational principles governing primary aberrations intrinsic to thin lens configurations. Subsequently, optimization of the objective lens ensues through a judicious amalgamation of suitable glass materials and structural arrangements, with a particular emphasis on addressing secondary spectrum intricacies. In the realm of catadioptric mirror assemblies, the formulation of the catadioptric mirror group is informed by the principles underlying the Mangin mirror.Results and DiscussionsFollowing optimization procedures, the imaging fidelity of the objective lens has satisfactorily adhered to the stipulated image quality criteria. The graphical representation illustrated in Figure 2 showcases the near-optimal alignment of the system's full field of view with the theoretical limits imposed. Evident in Figure 3, the intricate challenge of axial chromatic aberration within the optical system has been effectively ameliorated, with the secondary spectral chromatic aberration quantified at approximately 0.18 μm—this accomplishment aligns harmoniously with the prescriptive image quality prerequisites governing the system. According to Figure 4 and Figure 5, field curvature, distortion, and astigmatism are well corrected, the distortion is only 0.073% at 520 nm, and the all-encompassing wave aberration well below 0.09λ, it is judicious to assert that the optical system demonstrates commendable imaging fidelity. The objective lens, embracing an infinity-conjugate configuration, accommodates a maximal angular field of view for emitted parallel light of approximately 3°. To cater to various magnification needs, a tube lens, appropriately matched in parameters, can be affixed posteriorly to the objective lens. For instance, coupling the objective lens with a standard tube lens possessing a focal length of 200 mm, as delineated by the formula (2), facilitates the realization of a magnification factor of 35×. ConclusionsIn response to the high-resolution demands inherent to optical systems within the domain of semiconductor defect detection, this paper introduces a catadioptric objective lens featuring a numerical aperture of 0.9 and an operational wavelength range spanning 360 nm to 520 nm. With a remarkably streamlined configuration composed of just 11 lenses, the lens design effectively meets the stringent criteria for high-resolution output. By effectively addressing challenges related to field curvature and secondary spectral chromatic aberration, the lens achieves comprehensive correction. Wave aberration analysis demonstrates that the entire field of view remains well below 0.09λ. The integration of a catadioptric structure serves to condense the optical path while concurrently simplifying its intricacy. Notably, the designed objective lens can be seamlessly paired with commercially available standard tube lenses of varying focal lengths, thereby offering the flexibility to attain diverse magnification levels as required for inspection imaging purposes.
Sep. 25, 2023Vol. 52 Issue 9 20230470 (2023)
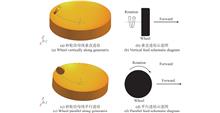
Jiyou Peng, Bing Guo, Shihui Wang, Huahai Nie, Bianbian Meng, Qingliang Zhao, and Huan Zhao
ObjectiveThe application of complex surfaces in aerospace, optical engineering, shipbuilding, and other fields is becoming increasingly widespread. The surface roughness of complex surface components directly affects their performance, efficiency, and lifespan. Improving the surface quality of complex surface components has a significant impact on enhancing their operational performance. The substantial demand for high-precision machining imposes higher requirements on the surface accuracy and complexity of related optical elements. To address the challenges in machining difficult optical elements, such as processing deep cavities and high steepness optical components, this paper proposed a robot-assisted wheel abrasive belt grinding method. Additionally, a gravity compensation system for the wheel abrasive belt grinding device was designed, and the constant force loading and smooth control problems in robot-assisted wheel abrasive belt grinding under arbitrary processing orientations were investigated.MethodsThis paper proposed a robot-assisted wheel abrasive belt grinding method (Fig.1) and analyzed the influence of the end effector's gravity component on the output pressure. A gravity compensation system for the wheel abrasive belt grinding device was designed (Fig.4), and a physical prototype of the device was built (Fig.5). The performance of the gravity compensation system was tested. Based on Hertz contact theory and Preston equation, the removal function of the wheel abrasive belt grinding device was established (Fig.11). The effectiveness of the device was validated through grinding experiments on a sinusoidal silicon carbide (SiC) surface (Fig.16) and a zinc sulfide (ZnS) aspheric surface (Fig.19).Results and DiscussionsDue to the influence of the gravity from the cantilever structure of the grinding device itself, when the grinding tool undergoes changes in posture, the output pressure at the end of the grinding device's contact wheel will experience noticeable variations. To address this, we established a model for the gravity component of the cantilever and designed a gravity compensation system. During the operation of the gravity compensation control system, real-time communication was established between the upper computer, attitude sensor, and DA conversion module. The system received angle change signals from the attitude sensor and processed the data using the gravity compensation algorithm. Subsequently, the system sent corresponding signals to the DA conversion module, triggering the electrical proportional valve to respond, control the current, and output the compensated air pressure, thus achieving a stable control of the output pressure for the MQQTB10-10D low-friction linear cylinder. The system was capable of achieving constant force control within the range of 0-63 N (Fig.6), with maximum pressure fluctuations less than 0.36 N. The response time of the gravity compensation system was less than 300 ms, enabling constant force loading of the wheel abrasive belt grinding tool under arbitrary postures.ConclusionsIn this paper, a constant force loading system was established for the public-self-rotation wheel abrasive belt grinding tool of the robot-assisted wheel abrasive belt grinding system. A gravity compensation system based on attitude sensors was designed. The wheel belt grinding process was applied to both atmospheric pressure sintered SiC and ZnS aspheric surfaces. For SiC, the Ra value decreased from 0.168 μm to 9.565 nm after machining, resulting in a sinusoidal surface with a PV value of 1.414 μm. As for ZnS aspheric, the Ra value reduced from 0.492 μm to 10.2 nm, and the PV value converged from 8.4 μm to 2.7 μm after the grinding process. This validated the processing stability of the wheel abrasive belt grinding tool and the rationality of the grinding algorithm. The study can provide theoretical guidance for robot-assisted grinding of complex surface optical elements and hold practical value in this field.
Sep. 25, 2023Vol. 52 Issue 9 20230471 (2023)

Zhaoming Wang, Mengjuan Li, Qiuyue Yu, Chunlin Li, Ziyue Zhao, Jinghua Wang, Tianbin Lv, Zhaojian Zhang, and Changsuo Yu
ObjectiveWhen the aspheric primary mirror and fourth-mirror integrated molding manufacturing method is used in coaxial four-mirror optical system, the complexity of system parts and weight of the whole machine would be reduced, and the installation efficiency could be improved greatly. Besides, the degree of freedom is constrained in later optical system assembly, so the optical axis of the two aspheric mirror needs maintain a high degree of consistency in the mirror manufacturing process. On the basis of the existing interferometry method, a new method is proposed to measure the optical axis deviation of two-sided community aspheric mirror.MethodsBased on the existing interferometric measurement method, a method of calculating the optical axis consistency of CGH interferometric wavefront tilt is proposed. The principle of the measurement method is introduced in detail (Fig.1). Figure 1 (a) shows the CGH optical measurement system of the two-sided community aspheric mirror. The surface of the aspheric mirror to be measured is S1 and S2. Interferometer 1 and CGH1 are used to measure the surface shape of the aspheric surface S1. The optical axes of CGH1 and aspheric S1 will reach a high consistency after the primary aberration is controlled strictly in the interferometric measurement optical system. Similarly, the optical axes of CGH2 and aspheric S2 would also be consistent. The optical axes of CGH1 and CGH2 would respectively characterize the optical axes of S1 and S2. The optical axes of CGH1 and CGH2 are both perpendicular to their optical surfaces in the design model. Figure 1 (b) shows the interferometric optical system for measuring the angle between two CGHs. CGH1 is designed to emit parallel laser in a specific area, and after reflection by CGH2, an interference fringe representing the angle between two CGH compensators is formed in the interferometer. The optical axis deviation of the two aspheric surfaces can be obtained by solving wavefront tilt of the interference fringe (Eq.1).Results and DiscussionsFor a diameter Φ500 mm two-sided aspherical mirror, the optical measurement model was designed and simulated, the design parameters were given (Tab.1-2). The diffraction stray light in the measurement optical path was simulated and analyzed (Fig.3). The error sources affecting the measurement accuracy (Fig.4-5) were decomposed. The main error sources are CGH manufacturing error, optical path misalignment error, and angle measurement error between CGH1 and CGH2. Simulation analysis shows that the measurement accuracy is 1 s. Two CGH were designed and processed, and the interference measurement optical system was built (Fig.6). The optical axis angle was calculated as (0.007 0°, 0.002 0°) when the wavefront tilt was (1.544λ, 0.441λ). The angle between the two CGH remeasured by theodolite was (0.007 1°, 0.001 9°). The profiler method was used to compare and verify CGH measurement result, the surface contours of the primary mirror and the four mirrors was scaned respectively, and the optical axis deviation was (0.007 1°, 0.002 0°) after unifying in one coordinate system. ConclusionsIn order to solve the problem of optical axis consistency measurement of two-sided aspherical mirror, a new method of calculating CGH interference wavefront tilt was proposed based on the existing interferometric method. The principle of the method was introduced, the simulation design and error analysis of the measurement optical system were carried out, which show 1 s accuracy. The optical system was built and the method of profilometer was compared to verify the measurement accuracy of the method. This method has the advantages of intuitiveness and high measurement accuracy, and has been successfully applied to the integrated molding manufacturing of coaxial four-trans optical system.
Sep. 25, 2023Vol. 52 Issue 9 20230476 (2023)
Xiaoli Zhou, Chao Bei, Nan Zhang, Xing Xin, and Zuoming Sun
ObjectiveEvent camera can capture the real-time changes of the scene. It only outputs brightness changes of the pixel level and asynchronous event stream with microsecond resolution. It has the advantages of high event resolution, high dynamic range, low delay and low bandwidth. Its application in the space target detection has gradually attracted the attention of researchers. At present, there are following challenges in the application of event camera. On the one hand, event camera is sensitive to environmental changes and outputs a lot of noise. On the other hand, the remote detection of space target will output the point-target event stream, resulting in a low signal-to-noise ratio, which demands higher requirements for the processing algorithm of space event stream. Therefore, denoising algorithm for space target event streams is very important for data preprocessing. For this purpose, denoising algorithm based on event camera is proposed.MethodsFor event stream data of space targets, this paper proposes the Neighborhood Density-based Spatiotemporal Event Filter (NDSEF), which is based on the neighborhood density, to reduce the local spatial neighborhood noise of each time neighborhood by compressing the image frame. Combined with the characteristics of space target trajectory, a circular local sliding window is set to adjust the selection range of spatial neighborhood, and noise filtering based on spatial information is realized (Fig.3). On this basis, this paper proposes a cascade filter based on NDSEF for different scenes and targets in the space environment. Through multiple stages of increasing the cumulative window of pixel dimensions, the multi-dimensional combination filter can gradually refine the event data and obtain the best noise reduction performance.Results and DiscussionsThis paper demonstrates the high-speed and high-generalization ability of the denoising algorithm in the public datasets and the simulation datasets. The scene information of the experimental datasets is shown (Tab.1-2), including three single-target scenes, a double-targets scene and a simulated space scene. The proposed filter outperforms the classical filter in signal-to-noise ratio and noise ratio (Fig.6, Tab.3), and the event processing speed can reach 10 μs, which meets the requirement of real-time detection of the space targets. Meanwhile, noise events can be effectively processed for multi-target event streams (Fig.5, Fig.7). The experimental results show that the proposed filter can ensure the accuracy and processing speed of the denoising algorithm in the space scene with low SNR.ConclusionsThis paper introduces denoising algorithm for space target event streams based on event camera, namely NDSEF algorithm, which makes full use of spatio-temporal constraints and signal characteristics of low signal-to-noise ratio. By compressing image frames, local spatial neighborhood denoising is processed for each time neighborhood. By combining space target trajectory characteristics, circular local sliding window is set to adjust the selection range of space neighborhood. On this basis, the cascaded filter based on NDSEF is proposed to increase the accumulation of pixel dimension windows to achieve a high degree of the algorithm optimization. The experimental results show that the proposed filter has obvious effect on denoising, the target signal is clearly visible. The signal-to-noise ratio and noise ratio are significantly improved, and the event processing speed is up to 10 μs. For space multi-target event streams under extreme conditions, it has the advantages of accuracy and real-time, which lays the foundation for the space multi-target detection based on event camera.
Sep. 25, 2023Vol. 52 Issue 9 20220824 (2023)
Siyu Wang, Xiaogang Yang, Ruitao Lu, Qingge Li, Jiwei Fan, and Zhengjie Zhu
ObjectiveInfrared time-sensitive targets refer to infrared targets such as ships and aircraft, which have high military value and the opportunity of attack is limited by the time window. Infrared time-sensitive target detection technology is widely used in military and civilian fields such as unmanned cruise, precision strike, battlefield reconnaissance, etc. The target detection algorithm based on deep learning has made great progress in the field of target detection due to its powerful computing power, deep network structure and a large number of labeled data. However, the acquisition of some high-value target images is difficult and costly. Therefore, the infrared time-sensitive target image data is scarce, and the multi-scene and multi-target data for training is lacking, which makes it difficult to ensure the detection effect. Based on this, this paper proposes an infrared time-sensitive target detection technology based on cross-modal data enhancement, which generates "new data" by processing the data, expands the infrared time-sensitive target data set, and improves the model detection accuracy and generalization ability.MethodsWe propose an infrared time-sensitive target detection technology based on cross-modal data enhancement. The cross-modal data enhancement method is a two-stage model (Fig.1). First, in the first stage, the visible light image containing time-sensitive targets is converted into infrared images through the mode conversion model based on the CUT network, and then the coordinate attention mechanism is introduced into the second stage model to randomly generate a large number of infrared target images, realizing the data enhancement effect. Finally, an improved Yolov5 target detection architecture based on SE module and CBAM module is proposed (Fig.3).Results and DiscussionsThe proposed cross-modal infrared time-sensitive target data enhancement method combines the style migration model with the target generation model, and uses the visible light image data set to achieve infrared time-sensitive target data enhancement. We can convert remote sensing visible image into infrared image without losing size, structure and field of view, without distortion, noise, distortion and other problems. It can be seen from Fig.6 that the generated infrared time-sensitive target has good texture details and infrared characteristics, and is clearly distinguished from the background. An improved Yolov5 target detection model is proposed. SE and CBAM attention mechanisms are added to the CSP network to enhance the feature expression of the network and better achieve infrared time-sensitive target detection. It can be seen from the analysis of Tab.2 that compared with using the original data to train the deep learning detection network, the data enhancement algorithm proposed in this paper has significantly improved the detection ability of positive samples, the detection accuracy rate, the recall rate, and the average accuracy have increased by 14.57%, 5.99%, and 8.82% respectively. It can be seen from Tab.3 that compared with SSD, Fast R-CNN and Yolov5, the algorithm in this paper has a great improvement in accuracy, average accuracy and F1 index. Compared with the original Yolov5 network, the accuracy rate, the recall rate, the average accuracy, and the F1 index have increased by 7.36%, 5.43%, 2.74%, and 6.45% respectively. Some test results are shown (Fig.9).ConclusionDue to the lack of infrared time-sensitive target data and poor detection effect, we proposes a cross-modal data enhancement infrared time-sensitive target detection technology. In the aspect of two-stage model data enhancement, firstly, the visible light remote sensing image containing time-sensitive targets is converted into the target image with infrared characteristics using the mode conversion network. Secondly, the coordinate attention mechanism is introduced into the sample random generation model. Finally, the Yolov5 detection technology based on the improved CSP module is proposed. Multiple sets of experimental results show that the detection accuracy of the algorithm in this paper is up to 98.06% in the infrared time-sensitive target data set, which solves the problem of the lack of infrared time-sensitive target data and has good target detection ability.
Sep. 25, 2023Vol. 52 Issue 9 20220876 (2023)
Xiangjun Wang, and Hui Zhu
ObjectiveTarget tracking plays an important role in the military, medical and other fields, and Field Programmable Gate Array (FPGA) is widely used in the direction due to its good performance and high flexibility. However, at present, limited to the complexity of high-precision tracking algorithms, most of the target tracking systems are implemented by foreign high-performance chips, which leads to weak autonomy and controllability. If domestic chips are used to achieve target tracking, it will face the problem that there are few IP cores and most modules need to be designed in Verilog. In addition, the feasibility of the research algorithm in other domestic FPGAs needs to be considered. Therefore, the objective is to study a tracking algorithm that is easy to design in Verilog, has generalization, and improves real-time and robustness.MethodsTemplate matching is easy to design with pipelines and is selected as the basic algorithm, which is widely used due to its simplicity and accuracy. Among them, the template matching algorithm based on Sum of Absolute Difference (SAD) has no multiplication and division operation, which is suitable for FPGA implementation with limited resources. This tracking algorithm has too strict constraints, which leads to the problem of insufficient robustness. Based on the Sum of Absolute Difference (SAD) similarity measurement method, a method for finding the Sum of Minimum Absolute Difference (SMAD) in the window is proposed. In order to reduce resource usage, the maximum and minimum filtering (Fig.3) is used to preprocess the image data in the window and then the minimum absolute difference is obtained, which reduces the resource consumption of the addition and subtraction of the SMAD method to 31.8%. Moreover, a pyramid-like update strategy (Fig.4) that is easy to implement by FPGA hardware is proposed to better adapt to the scale change of the target. In order to verify the tracking performance of proposed algorithm, Unigroup FPGAs are used to implement it and build a real-time target tracking system (Fig.5).Results and DiscussionsBased on the two indicators of Average Overlap Rate (AOR) and success rate, the algorithm comparison experiment was carried out with the OTB dataset. It verified that the proposed algorithm has certain anti-occlusion and scale adaptability (Fig.10). Compared with the SAD method, the tracking metrics in each scenario are improved. In the scale change and synthesis scenario, after the SMAD method is added to the pyramid-like strategy, its success rate and AOR are improved, which verifies the effectiveness of the pyramid-like update strategy (Tab.2). Compared with the robust DDIS algorithm, the proposed method improves the average success rate and overlap rate by 1.18% and 0.13%, respectively, and is easier to design with FPGA. Then the target tracking system is implemented by domestic FPGAs. The delay time is 16 line synchronization cycles plus 37 clock cycles and tracking frame rate can reach 100 frames per second. Different outdoor backgrounds were selected to test the tracking of the system when the target changed in scale, direction of motion and speed (Fig.12). The anti-occlusion test experiment of the tracking platform shows that (Fig.13) when the target is partially occluded, the tracking system can still successfully track the target, which further verifies the feasibility of the proposed method.ConclusionsIn order to break the technology monopoly and improve the autonomy of target tracking application products, the traditional SAD template matching method is improved considering the limitations of domestic FPGA and the performance of tracking algorithms. The SMAD method is proposed and its resource consumption is optimized. Combined with a pyramid-like template update strategy, its tracking performance is improved. The experiments of OTB dataset and domestic tracking system verify its tracking effect. It provides a reference scheme for the localization of high frame rate target tracking system.
Sep. 25, 2023Vol. 52 Issue 9 20220905 (2023)
Wenjing Liu, Lianqing Zhu, Dongliang Zhang, Xiantong Zheng, Yichen Yang, Wenjie Wang, Yuan Liu, Lidan Lu, and Ming Liu
ObjectiveInfrared photodetectors are useful for a variety of military and civil applications, such as space science, military equipment, industrial production and so on. Presently, infrared photodetectors are developing towards high performance and low cost to meet the technical requirements. Compared to single color detectors, dual-band infrared detectors covering different atmospheric windows allow for simultaneous acquisition of target information in both wavelengths which is the most obvious advantage. Therefore, the dual-band capability of the detector makes it possible to discriminate between different temperatures and objects, improving the accuracy of temperature measurement and target recognition. Complex infrared backgrounds can be suppressed and it is possible to reduce the false alarm rates significantly in early warning, searching and tracking systems. Mid-long wavelength dual-band infrared detectors based on type II superlattice have great advantages in terms of cost and performance, and have become a popular research topic in the field of new infrared detectors. However, infrared detectors need to reduce dark current density and crosstalk to achieve better performance. The nBn superlattice detector has a unique band gap engineering approach, which can work at a higher temperature and has better thermal stability compared to traditional single color detectors. This leads to better performance and longer operating life in harsh environments. Additionally, the nBn structure has a high absorption coefficient, resulting in a high detectivity and low noise. However, the development of nBn superlattice dual-band detectors faces several challenges, such as the difficulties in fabrication and the limitations in performance. The fabrication of the nBn structure requires precise control of the layer thickness and doping levels, which is a complex process. Besides, the performance of the nBn detector is limited by dark current and temperature. These issues need to be addressed through further research and development. To this end, the paper designs an InAs/GaSb superlattice mid/long dual-band infrared detector with nBn structure to reduce dark current density and crosstalk by simulation of silvaco.MethodsThe materials of the mid-band and the long-band absorber are selected by calculating the band gap of InAs/GaSb using the k.p model to meet the requirements of the design objectives. The mid/long dual-band infrared detectors model with nBn structure is eatablished by silvaco, and the responsivity and dark current density values of the mid/long waveband channels are compared by simulating some device structures at different bias voltages. The effects of the barrier layer thickness, absorber layer thickness, and doping in different regions are analyzed to obtain the best model parameters to reduce the dark current density and crosstalk.Results and DiscussionsBy modeling and simulating the nBn type II superlattice mid/long dual-band infrared detector structure, the thickness of the absorber and barrier layers and the doping concentration are optimized to reduce the dark current and the crosstalk in the mid-band and the long-band channel. At 77 K, the cutoff wavelengths of the dual-band detector are 4.8 µm (50%) at 0.3 V and 10.5 µm (50%) at -0.3 V (Tab.8) with the detectivies of 3.9×1011 cm·Hz1/2W-1 and 4.1×1011 cm·Hz1/2W-1 (Tab.9). The dark current density is 4×10⁻⁵ A·cm-2 and 1.3×10⁻⁴ A·cm-2 respectively (Tab.7). This provides a theoretical basis for subsequent material growth and device processes. ConclusionsThe advantages of the designed superlattice mid/long dual-band infrared detector are simple device structure, low dark current density, and similar detection rate compared with the foreign InAs/InAsSb infrared detectors based on nBn structure and domestic InAs/GaSb infrared detectors based on PπMN structure. The simulation performance will have some differences with the actual device performance, so the subsequent material growth and device process will be carried out to further feedback the simulation, and the device structure will be further improved.
Sep. 25, 2023Vol. 52 Issue 9 20220837 (2023)
Qingjun Liao, Xiaoning Hu, Aibo Huang, Honglei Chen, Zhenhua Ye, and Ruijun Ding
ObjectiveHyperspectral imaging can not only get the two-dimensional geometric spatial information of the observed objects, but also obtain the continuous high-resolution spectral information which can reflect the physical and chemical characteristics of the target. It is a very important method for target detection and recognition based on hyperspectral remote sensing information. Spectral range of typical imaging spectrometer is 0.4-2.5 µm due to the ground objects' reflection of solar radiation. Mercury Cadmium Telluride (Hg1-xCdxTe) detectors cover a bandwidth of 0.8-30 µm as the alloy composition of Hg1-xCdxTe material is tuned in terms of cut-off wavelength. Hg1-xCdxTe detectors are the major part of the imaging spectrometer for detection in short waveband. As the swath width of the imaging spectrometer increased, larger scale infrared focal plane array (IRFPA) is needed. Mosaic ultra-large scale shortwave infrared (SWIR) detectors can meet the demand for wide field of view detection in space application. The detector modules for butting have their own spectral responsivity. Hyperspectral imaging demands that the mosaic IRFPA has high uniformity of the spectral response. Therefore, it is necessary to measure and analyse the spectral responsivity specification of the mosaic IRFPA accurately and quantitatively for the hyperspectral imaging application. For this purpose, a method for evaluating the absolute spectral responsivity of the mosaic SWIR detectors is proposed in this paper. MethodsThis paper presents a method for measuring the absolute spectral responsivity accurately and quantitative analysis of the spectral responsivity specification of the mosaic 2 000×256 SWIR detector for imaging spectrometer. The relative response spectrum is measured by a precisely calibrated grating monochromator system. Five optical filters with different center wavelength (CW) and full width at half maximum (FWHM) were chosen to analyze and measure the narrow band responsivity (Tab.1). The center wavelength of the filter is 1225 nm, 1670 nm, 2062 nm, 2420 nm and 2470 nm respectively. The bandwidth is 10 nm and 50 nm, and the cut-off depth is OD3 (optical density). Spectral responsivity is calculated by relative response and narrow-band responsivity.Results and DiscussionsThe cut-off wavelength of detector to be tested is 2.6 μm, and its pitch size is 30 μm×60 μm. The integration time of the read-out integrated circuit (ROIC) is 4.4 ms and integration capacity is 65 fF. F number of the Dewar is 0.9. The results of output signal analysis with filter of different CW at different black body temperature show that narrow-band responsivity is much lower than out-of-band response (Tab.2, Fig.3) with 1# filter and much higher (Tab.2, Fig.4) with 5# filter. The possibility of narrow-band signal's accurate measurement at 1200 nm is discussed if the bandwidth is widened to 200 nm and the cut-off depth is adapted to OD4 and OD5 (Tab.3). It shows that narrow band responsivity can be measured precisely only when cut-off depth is smaller than OD5 and FWHM is wider than 200 nm. Based on the result of the analysis, for HgCdTe SWIR detector the measurement error is smallest when the filter's center wavelength is 2470 nm, FWHM is 50 nm, and cut-off depth is OD3 at 80 ℃ black body temperature. The absolute spectral responsivity of four HgCdTe detectors is measured by the relative response curve and narrow-band responsivity (Fig.7). According to the spectral responsivity curve, the responsivity non-uniformity of four detectors can be calculated to be 6.23%, 6.06%, 4.07% at 1 μm, 1.9 μm and 2.5 μm respectively (Fig.8). ConclusionsIn this study, a quantitative method for measuring the spectral responsivity accurately and analyzing the spectral responsivity specification of the mosaic 2000×256 SWIR detector for imaging spectrometer is proposed. The results of this study demonstrated that spectral responsivity of Hg1-xCdxTe SWIR can be measured accurately when the filter's center wavelength is 2470 nm, FWHM is 50 nm, and cut-off depth is OD3 at 80 ℃ black body temperature. Narrow-band spectral response output signal is much larger than signal caused by out-of-band response. The spectral responsivity non-uniformity of the four detectors helps to evaluate the response uniformity of spectral dimension response of 2000×256 SWIR detector quantitatively. The results have demonstrated that the use of this measuring method promotes appropriate application of IRFPA detectors in hyperspectral imaging.
Sep. 25, 2023Vol. 52 Issue 9 20220890 (2023)
Jiaqi Shao, Honglei Chen, and Ruijun Ding
ObjectiveCurrently, 3D image sensors based on time-of-flight ranging have been widely used in military and civil applications, such as astronomical detection, target identification, and unmanned vehicles. They are currently being developed in the direction of high sensitivity, high accuracy, and low power consumption in the future. Hybrid time-of-flight ranging, which can achieve high accuracy and high range of lidar ranging, is based on the principle of indirect time-of-flight ranging while incorporating the notion of direct time-of-flight ranging. It has become one of the development paths of time-of-flight ranging. For this purpose, a hybrid ranging model and a 5×5 array readout circuit with 50 µm center distance are designed based on an APD in linear mode as the detector.MethodsA two-segment, two-phase hybrid ranging model is built in this paper (Fig.4). Based on this model, the time-of-flight solution was implemented and the error of background light and counter clock frequency was simulated (Fig.6-7). In order to adapt to the model, the readout circuit selects Capacitor Feedback Transimpedance Amplifier (CTIA) as the input stage, outputs a voltage signal through a sample-and-hold circuit, and generates an 8-bit digital signal through a positive feedback comparator and True Single Phase Clock counter (Fig.3). The accuracy of intensity information is determined by calculating the linearity of the analog voltage output (Fig.9). The accuracy of distance measurement is analyzed by combining analog and digital signals, calculating the time of flight in the vicinity of 108.75 m, and comparing the result to the ideal value (Fig.10).Results and DiscussionsThe hybrid ranging readout circuit can be passively integrated over a range of 0.5 V to 2.5 V with high injection efficiency. CTIA output voltage has 99.83% linearity (Fig.9). In the hybrid ranging simulations over a range of 108.75 m, the K values were correctly determined for most subperiods. The maximum and average errors in the last subperiod are 11.355 cm and 4.415 cm respectively (Fig.10). This error can be greatly reduced by optimizing the data at the first and last ends. Performance of the readout circuit meets design requirements. The simulation results of the main parameters are compared with the advanced designs at home and abroad in various ranging modes (Tab.1). It can be seen that the small array readout circuit based on LM-APD in the paper achieves a much higher range than indirect ranging at a lower modulation frequency using a medium process. It also achieves a higher accuracy with a very low counter cost and good linearity compared with the direct ranging scheme. It provides a hybrid ranging scheme that can be applied to near-medium range.ConclusionsIn this study, a hybrid ranging model is established and systematically analyzed by combining the advantages of direct ranging and indirect ranging. Based on the model, the intensity of reflected background light and continuous pulse light can be found. By using LM-APD, a 5×5 array with 50-μm pixel center distance two-stage two-phase hybrid ranging readout circuit is designed. It consists of two sub-frames of phase in a single frame, with two steps of integration process in each sub-frame. Both a voltage analog output and an 8 bit counter digital output are available from the readout circuit, which employs CTIA as its input stage. Simulation results show that the analog output achieves 99.83% linearity at a modulation frequency of 20 MHz, and the readout circuit achieves a maximum error of 11.355 cm and an average error of 4.415 cm over a hybrid ranging range of 108.75 m. It extends the range to 29 times that of pure indirect ranging, and the readout circuit has great potential for key performance such as accuracy and range. The preliminary simulation results have shown the advantages of hybrid ranging and verified the feasibility of the hybrid ranging model, providing a theoretical and circuit reference for the design of a larger-scale infrared focal plane 3D imaging readout circuit. Further validation and improvement are pending after the flow of the chip.
Sep. 25, 2023Vol. 52 Issue 9 20220892 (2023)
Lixia Zheng, Yongqi Han, Chenggong Wan, Mouzhao Zhou, Xuyan Li, Jin Wu, and Weifeng Sun
ObjectiveUsing the highly sensitive detection ability of avalanche photoelectricity to weak photon signals, the time of flight can be detected which is obtained after the active laser light source is reflected by the target object. The spatial distance distribution of the measured object, namely the depth of scene information, can be obtained, and the geometric contour image of the target object can be reproduced through relevant algorithms. This Laser Detection and Ranging system composed of APD and readout integrated circuit has the advantages of small size, fast detection rate, high sensitivity, strong anti-interference ability, and is widely used in laser radar, quantum communication, map construction, safe distance detection, unmanned navigation and other fields. With the continuous expansion of the scale of SPAD array and the complexity of application scenarios, higher requirements are put forward for the performance of ROIC. This design focuses on high-precision resolution under low-power constraints. Based on the detailed analysis of the mutual constraints of ROIC array precision, range, area and power consumption, the controllable built-in GRO high-frequency clock drive pixel architecture and event-driven operation mode are adopted to reduce the system power consumption and meet the application requirements of short-range and high-precision ranging imaging.MethodsThe readout integrated circuit for high-precision imaging is established. The ROIC array architecture selects the TDC fully built-in structure, which has unique advantages such as small nonlinearity and good clock phase-splitting uniformity, and eliminates many problems caused by the long-distance routing of polyphase high-frequency clock signals (Fig.1). At the same time, in order to reduce the power consumption, the quantization timing adopts the event-driven quantization method (Fig.3). In order to further pursue higher resolution at rated frequency, the TDC circuit adopts a two-stage structure (Fig.4). In order to ensure clock uniformity and low jitter clock, an external PLL driver with built-in GRO is used to provide the required clock signal (Fig.5).Results and DiscussionsThe packaging and related testing of the samples prepared by the MPW chip are completed using the test instrument provided by the laboratory. The PLL outside the array and the GRO inside the pixel meet the requirements, and the GRO function also meets the requirements (Fig.7). The quantization function and performance of the array are tested, the average resolution of TDC is 102 ps (Fig.8). After evaluating the linearity of pixel TDC, the test results show that the differential nonlinearity of TDC array is not greater than 0.8 LSB, and the integral nonlinearity is not greater than 1.3 LSB (Fig.9). The uniformity of TDC array pixels is tested, and the test results show that the total relative deviation is within ± 0.65%, which indicates that the clock frequency and phase generated by each pixel GRO are different (Fig.10). Compared with similar design schemes at home and abroad, the high-precision TDC array designed can obtain larger range with the same accuracy (Tab.1).ConclusionsIn this study, a readout integrated circuit based on built-in clock is designed. The performance of the readout circuit is tested using the test instrument provided by the laboratory. The resolution of the readout circuit is 102 ps, the differential nonlinearity of the pixel TDC is not more than 0.8 LSB, the integral nonlinearity is not more than 1.3 LSB, and the total relative deviation of the uniformity of the TDC array pixel is within ± 0.65%. By testing the performance of the readout circuit, for the sparse photon detection application environment, the circuit can meet the application requirements of short-range and high-precision, and provide stable imaging function for short-range detection.
Sep. 25, 2023Vol. 52 Issue 9 20220896 (2023)
Yingqi Liao, Suhui Yang, Jian Song, Yan Hao, and Zhen Xu
ObjectiveLidar is widely used in underwater detection. However, laser is scattered during underwater propagation, and scattering is an important factor limiting the performance of radar systems. Lidar-radar techniques can suppress both forward and backward scattering, where the cut-off frequency of the scattered light is an important parameter. However, unlike backscattering which is easily separated from the target-reflected light in space, forward scattering is difficult to separate from the target-reflected light as they are intertwined in space. Therefore, we propose to separate the forward scattered light from the target-reflected light using vortex beams and analyze its frequency response to obtain the cut-off frequency of forward scattered light.MethodsVortex beams are used to distinguish between forward scattered light and target-reflected light in underwater target detection (Fig.3). The fast Fourier transform is done on the spatially filtered forward scattered light and the target-reflected light to obtain their frequency response (Fig.4). A Monte Carlo-based model for lidar-radar underwater target detection is also developed, and the fast Fourier transform of the forward scattered and reflected light in the echoes is also performed to analyze their frequency response (Fig.1). The simulation results are compared with the experimental results (Fig.2, Fig.6). A ranging experiment is designed to investigate the effect of modulation frequencies less than or greater than the cut-off frequency of forward scattering on the accuracy of ranging (Fig.7).Results and DiscussionsThe experimental results show that scattering has an averaging effect on the modulation, and the high-frequency component is difficult to be maintained in the forward scattering. On the contrary, the high frequency modulation is well maintained in the signal light (Fig.4). The higher the modulation frequency is, the higher the signal-to-clutter ratio is. In addition, in order to achieve a signal-to-clutter ratio of 1, higher modulation frequencies are required in more turbid water (Fig.6). The experimental results are consistent with the results of Monte Carlo simulations (Fig.2). The results of the ranging experiments show that when the signal-to-clutter ratio is less than 1, increasing the modulation frequency reduces the ranging error significantly. While when the modulation frequency is high enough to make the signal-to-clutter ratio greater than 1, continuing to increase the modulation frequency makes the ranging error decrease roughly, but not change much (Fig.9).ConclusionsA method for spatially distinguishing forward scattered light in underwater target detection echoes using vortex beams is proposed. Thereby, the forward scattered light and the target-reflected light are obtained separately in the experiment, and the frequency response of both is analyzed by fast Fourier transform to calculate the modulation frequency sufficient to suppress the forward scattered light in the lidar-radar technique. The frequency response of forward scattered light and target scattered light in underwater target detection is simulated based on Monte Carlo method and compared with the experimental results. Both simulation and experimental results show that a high modulation frequency can improve the signal-to-clutter ratio of the underwater lidar system. And for turbid water, a higher modulation frequency is required for more effective suppression of forward scattering. To achieve a signal-to-noise ratio greater than 1, modulation frequencies greater than 700 MHz are required for an attenuation length of 11 and greater than 900 MHz for an attenuation length of 12. Ranging experiments also demonstrate that when the modulation frequency is not high enough to make the signal-to-clutter ratio greater than 1, increasing the modulation frequency results in a significant reduction in the ranging error. While when the modulation frequency is high enough to make the signal-to-clutter ratio greater than 1, continuing to increase the modulation frequency results in a general reduction in the ranging error. When the modulation frequency is high enough to make the signal-to-clutter ratio greater than 1, the ranging error decreases roughly, but the change is not significant. The findings of this study can be used as a reference for the design of carrier modulated underwater lidar systems.
Sep. 25, 2023Vol. 52 Issue 9 20220831 (2023)
Ronghua Li, Yufeng Qi, Hui Xie, and Xingyuan Han
ObjectiveThree-dimensional lidar is widely used in simultaneous localization and mapping (SLAM) research due to its accurate and reliable measurement performance, and has achieved fruitful results. However, in the scene where the geometric features such as long corridors and tunnels are not rich enough, the point cloud registration will have an additional degree of freedom in one direction, and the laser SLAM based on the point cloud information will degenerate, resulting in the failure of robot positioning and mapping, which will lead to the failure of subsequent navigation tasks. That is to say, when moving along a long corridor, the laser point cloud obtained is the same, which makes the matching algorithm unable to accurately estimate the motion in this direction. And in the conventional environment, the accumulated error of the front-end odometer increases with the increase of the scene. The loopback detection method based on the Euclidean distance of the traditional laser SLAM algorithm has the problem of missing detection and cannot eliminate the accumulated error of the front-end odometer. For this reason, a close-coupled laser SLAM method for an unknown environment is proposed in this paper.MethodsFirst of all, a close-coupled framework (Fig.1) is used to fuse LiDAR and IMU information, correct IMU bias, and provide high-precision prior information for the LiDAR odometer. Secondly, the LiDAR odometer Jacobi matrix is calculated, the environmental geometric information dimension is detected in real-time, the wheel odometer and IMU data is integrated, and the freedom of LiDAR odometer is compensated. Finally, in view of the loopback detection method based on Euclidean distance that has missed detection due to the accumulated error of the odometer (Fig.2), a variable-threshold loopback search model is constructed, and the corresponding threshold key frame information is analyzed by different registration methods to improve the loopback detection recall rate (Fig.3).Results and DiscussionsA-LOAM, LIO-SAM and the method in this paper are used to test in a 76.78 m long and 1.85 m wide corridor respectively. The corridor is flanked by large white walls, with high scene repetition and fewer geometric features in the direction of motion. In the long corridor degradation scenario, the scene restoration degree of the method in this paper reaches 99.71%, and the odometer drift is reduced to 0.12 m, which is 91.04% and 97.37% lower than A-LOAM and LIO-SAM, respectively (Tab.1). In addition, the data sets with three drift thresholds are selected, and 20 data sets are selected for each threshold to test the loopback detection performance. Under the condition that the accuracy of loopback detection is 100%, the recall rate of loopback detection is 98.3%, which is 35% higher than that of the LIO-SAM algorithm on average (Tab.3).ConclusionsIn this study, a close-coupled laser SLAM method for an unknown environment is proposed. This method uses a tight coupling framework to improve the efficiency of sensor information utilization, and can detect the geometric information dimension of the environment in real-time. In the environment of fast-rotating scenes and missing geometric information, it can still achieve high-precision positioning and mapping. A variable threshold loopback search model is builded, which can maintain a high loopback detection recall rate in large scenes. The position and posture of historical frames are corrected, and the global consistency of the map is ensured. The proposed method is proved to be robust and accurate by many scene experiments.
Sep. 25, 2023Vol. 52 Issue 9 20220839 (2023)
Huipeng Wang, Sicong Zhai, Jie Yang, Lihong Dong, and Haidou Wang
ObjectiveLaser long pulse thermography technology has distinct advantage in quantitative detection of the width of surface microscopic cracks, which is of great importance to the service safety of aluminum alloy structure. However, the heat source excited by long pulse laser decays rapidly in the vicinity of the crack when it expands, which limits the accuracy of the crack width. Besides, crack width detection based on temperature magnitude would be affected obviously even if with slight measurement error. While temperature rise distribution of the crack along the direction of the long pulse laser under the quasi-steady-state temperature field could reflect the width of the surface crack precisely. Therefore, it is necessary to establish the temperature rise characteristics for width detection of microscopic surface crack of aluminum alloy structure. For this purpose, the heat conduction law of surface crack of aluminum alloy under the quasi-steady-state temperature field excited by long pulse laser is proposed, and a systematic experiment is designed in this study.MethodsIt is found that the temperature rise is minimum at the center of the crack, and the amplitude of temperature rise reduces with the increase of the crack width based on systematical analysis of the quasi-steady-state temperature field distribution excited by long pulse laser at the surface crack. After that, a laser thermal imaging test platform is built, and temperature rise distribution of cracks with different width is collected. The contour distribution of the highest temperature rise at the center of the laser line is extracted (Fig.8), and the weight vector of the crack surface temperature rise distribution is calculated by using the principal component analysis method (Fig. 10-11). The normalized Euclidean norm of the temperature rise curve is extracted based on the temperature rise change at the crack within 4 s after the long pulse laser excitation (Fig.13).Results and DiscussionsBoth parameters decrease rapidly with the increase of the crack width, γ is constructed based on the contour distribution of the quasi-steady-state distribution of temperature (Fig.12), δ is defined based on the Euclidean norm of the temperature rise phase excited by long pulse laser (Fig.14). After that, composite parameter Λ, combined γ with δ, is constructed to eliminate the influence of laser power. The results show that, when the crack width is smaller than 700 μm, parameter Λ shows good linearity to the crack width, and the width pathology effect could be reduced effectively. The detection of crack width would be affected by the resolution of the thermal imaging camera. In this study, a single pixel of the thermal imaging camera is about 256 μm. So when the crack width is smaller than 300 μm, the temperature of the crack collected by the camera is not only from the crack, but also from the edge of the crack, which would affect the accuracy of the width calculation. And the accuracy would be improved by the improvement of the thermal imaging camera resolution. ConclusionIn this study, the thermal response of the crack width on the surface of aluminium alloy excited by long pulse laser is analysed based on the heat conduction law. Temperature rise distribution and temperature rise variation of cracks with different width under long pulse laser excitation are investigated. According to the characteristic parameters of temperature rise distribution and temperature rise variation of crack of different widths, a composite index of crack width independent of laser power was established by using ratio definition method. The results show that the composite index of spatial characteristic parameters can greatly improve the reliability and accuracy of crack width detection, and can achieve quantitative detection of cracks of 50-700 μm, which can lay a solid foundation for the application of laser infrared thermography in aerospace crack quantitative detection.
Sep. 25, 2023Vol. 52 Issue 9 20220902 (2023)
Han Xue, Ziang Zhang, Jingqi Fu, Lingtian Diao, and Liwei Mu
ObjectiveFree-space laser time-frequency transmission technology has the advantages of high capacity, extensive coverage, long transmission distance, and high confidentiality. Its accuracy is expected to reach the standard quantum limit, making it an important technical development direction for space high-precision time-frequency transmission in the future. The precision of laser range directly affects the accuracy of laser time-frequency transmission, which is determined by the accuracy of measuring the pulse round-trip time interval. Compared with traditional time interval counting method, the measurement accuracy of event timing method has reached ps level, and it has become an essential measurement technology in high-repetition-rate laser ranging technology. In this research, an index evaluation model for the measurement performance of the event timer was established in order to provide a reference for the assessment of event timer in free-space laser time-frequency transmission with greater precision and longer distance.MethodsThe performance assessment model for event timers presented in this work mixes deterministic and random elements. Frequency stability (time-domain variance) and power-law spectral noise are random parameters, and frequency accuracy and frequency drift rate are deterministic ones. Time series from accurate frequency sources can be measured to obtain a number of indicators that describe the effectiveness of the event timer, such as those based on the minimum double-dimensional frequency accuracy and frequency drift rates, as well as time-dome differences that describe the stability of frequencies, such as Allan variance, Modified Allan variance, Time variance and Hadamard variance. The power law spectrum model contains five random noises, including random walk noise, frequency-modulated white noise, frequency-modulated flicker noise, phase-modulated white noise and phase-modulated flicker noise, which can be separated from the event timer measurement data. The measurement method was created using the performance assessment model (Fig.2), which contrasts the performance of two common, high-precision event timers (A033 and GT668) that are on the same accuracy level.Results and DiscussionsThe high-precision event timers A033 and GT668 are being evaluated for their measurement performance using the specified event timer performance assessment model. The dispersion degree of the GT668 was lower than that of the A033 (Tab.2). The frequency measurement accuracy of the event timer A033 was superior to ${\text{7}} \times {\text{1}}{{\text{0}}^{{{ - 12}}}}$ (Fig.6); The event timer GT668 was superior to ${\text{3}}{\text{.1}} \times {\text{1}}{{\text{0}}^{{{ - 12}}}}$. Compared to frequency drift rate, the frequency drift rate indicators of A033 was ${\text{2}}{\text{.096}} \times {\text{1}}{{\text{0}}^{{{ - 15}}}}$, and frequency drift rate of the GT668 was ${{ - 1}}{\text{.071}} \times {\text{1}}{{\text{0}}^{{{ - 15}}}}$. The short-term stability Allan standard deviation (1 d) increased from ${\text{7}} \times {\text{1}}{{\text{0}}^{{{ - 12}}}}$ to ${\text{4}} \times {\text{1}}{{\text{0}}^{{{ - 12}}}}$ (Tab.4). There is no discernible difference between FM scintillation noise and FM white noise, and GT668 is more steady in the trend of the random walk noise curve (Fig.8). The performance of high-precision event clocks may be assessed and studied using the performance evaluation model, and the variations between various event timers on the same performance index can be observed. ConclusionsThe performance of the picosecond event timer was assessed from the perspectives of deterministic factors and random factors, according to the designed performance evaluation method, and the key performance indicators such as frequency accuracy, frequency drift rate, dispersion degree, frequency stability (time domain variance), and power law spectrum noise were obtained. The experiments validated the event timer assessment method by measuring the event timing of the fixed latency of the passive hydrogen maser VCH-1008 (VREMYA-CH) using the event timers A033 and GT668. The experiment demonstrated that the performance of a high-precision event timer was able to be assessed and analyzed by the evaluation model presented in this paper, ascertain its accuracy and dependability, and provide an analytical foundation for its applications.
Sep. 25, 2023Vol. 52 Issue 9 20220913 (2023)
Tuanjie Xia, Weiwen Zhou, Jianfei Yin, Wenhao Liu, and Yufei He
ObjectiveThe tail flame radiation intensity (W/sr) of large high-speed moving targets is about tens of thousands of watts, while the radiation intensity of the target body is hundreds of watts, a difference of two orders of magnitude, and it is difficult for a single infrared imaging to achieve tail flame anti-interference and body identification, which in turn causes deviation in tracking position. In order to solve the accurate detection of the strong tail flame and weak body of high-speed targets, the laser scanning composite mode is introduced to accurately locate the target position according to the tracking deviation. Based on this, in order to make up for the shortcomings caused by the system detection requirements, the design of high-speed and high-precision scanning trajectory schemes has become a crucial part. Since the existing research has not proposed a design method for lidar rose scanning to match high-speed target detection, it is particularly important to design scanning algorithms and study trajectory uniformity and density to achieve high detection probability of targets under these high-speed conditions, which can effectively guide the application of high-speed laser scanning.MethodsA single-pulse laser rose scanning system is constructed (Fig.1). The single-pulse laser detection system reduces the beam scattering angle (not more than 360 μrad) and increases the peak power of the transmission to achieve a detection distance of more than 4 km at a high altitude (APD detector sensitivity is better than 3×10⁻⁸ W), and achieve a detection response time of more than 2 s under high-speed movement of the target (Fig.2). At the same time, in order to make up for the lack of laser detection field of view caused by the smaller beam scattering angle, the scanning field is expanded by scanning, the piezoelectric method is used to achieve sufficient resonant frequency, the effective detection area of 2°×2° is completed, the pulse frequency and scanning algorithm are designed, and the density and uniformity of the pulse point and target opening angle are evaluated (Fig.3) to achieve target search with a large field of view and no less than 90% of the target detection efficiency (Fig.4). Blind-spot-to-detectable-area distance (BDD) is introduced to calculate its maximum value and rms to visually measure the size, uniformity of the continuous blind zone and proportion of the detection area (Fig.5), and realize the optimal design of the rose line scanning mode. Results and DiscussionsProbing design simulation is used to calculate the optimal sweep parameters through experiments. The scanning trajectory f1=500 Hz, f2=450 Hz, the peak power of laser single pulse emission is 40 kW, the repetition rate is 40 kHz, and the single field of view covers 20 rose leaves and 800 pulse points. The scanning closed-loop bandwidth is 1000 Hz, the field center repetition rate can reach 1000 times per second, and there are at least 50 field refresh cycles per second (Fig.6). In the optimal scanning mode, the BDD statistic is the smallest, the continuous dead zone is the smallest, and most of the blind spots are in the peripheral area of the detection field of view (Fig.7-8). Under a single field of view update, 100% detection probability feedback can be achieved, the scanning point distribution is uniform, the maximum proportion of detectable area is 55.34%, and the minimum BDD is 1.26 (Tab.1), which has the ability to reliably detect high-speed targets. ConclusionsIn this study, a laser pulse long-range, high-frequency, high-probability scanning application system is designed, and the target detection system model and the optimal scanning algorithm scheme of laser pulse matching high-speed target detection are optimized. High peak power and small laser beam scattering angle are designed to achieve active laser long-distance detection at a high altitude of more than 4 km. The highly dynamic piezoelectric scanning mechanism stroke is designed to expand the laser detection field of view by more than 2°. Research on high-speed pulse frequency and sweep trajectory algorithms is conducted. The density, uniformity and coverage of the laser pulse point opening angle and the target opening angle in the scanning projection field of view are evaluate. A scanning closed-loop bandwidth of not less than 1000 Hz and a field of view refresh rate of 50 Hz (matching 20 ms image cycle) are achieved. The 100% detection probability feedback under a single field of view refresh of high-speed targets is realized. The detectable area under the condition of breaking through the limit detection (head-on or tail chase) accounts for more than 55%, the quantitative evaluation of BDD index was carried out, which achieved the purpose of accurately aiming at the target body, completed the real position and angle feedback of the target, and verified the achievability and good detection performance of high-speed target detection.
Sep. 25, 2023Vol. 52 Issue 9 20220916 (2023)
Yingying Li, Ziwei Liu, Jingkun Zhang, Linlin Wu, Xue Ji, and Mingchang Wang
ObjectiveMonochromatic airborne LiDAR bathymetry becomes considerably favorable for topography and geomorphology detection over coastal area by means of its low cost, low load and high sampling rate. However, addressing the limitation of single wavelength to realize the accurate division of full waveform data independently from auxiliary sensor becomes the critical part of coordinate calculation. Given the existing literatures, there is a lack of systematic evaluation analysis and general conclusions for waveform classification contraposing to full waveform morphological features.MethodsIn view of the latest development of waveform features extraction, refined waveform categories (anomalies, over-fitted, land, sea surface and bathymetry waveforms), 24-dimensional waveform features are designed and calculated upon systematic analysis on morphological characteristics of different waveforms, and then their classification performance and optimal feature combination are evaluated and quantitatively analyzed utilizing random forest feature selection and classification model.Results and DiscussionsThe results proved that the combination of 6-dimensional features (Fig.8-11), including deviation of amplitude between two adjacent points and oscillating main frequency, is the most effective in classifying five waveforms, with an overall classification accuracy of 98.55% and a Kappa coefficient of 0.982 0 (Fig.9-10, Fig.12, Tab.1). To verify the universality of the features, an additional experimental area was selected for validation and the overall accuracy of water and land classification was 96.81% (Fig.13).ConclusionsTo accurately identify waveforms, a systematic analysis was conducted to determine the morphological differences between different types of waveforms, and 24-dimensional feature parameters were extracted. After the optimal feature combination and classification performance evaluation, it was found that the 6-dimensional features of oscillating main frequency f, ratio of peak Rp, deviation of amplitude between two adjacent points ∆A, maximum intensity Wf-I, decay constant a, and first echo peak Fpk were highly effective in distinguishing these five types of waveforms, where 100% of the anomalies and over-fitted waveforms were extracted, strongly confirming the relevance and validity of the morphological features. After replacing the experimental area, the accuracy of the water and land classification reached 96.81%, proving that the features and methods used were adaptable and generalizable, and could meet the production requirements. The 2% decrease in waveform classification accuracy after changing the study area is mainly due to the varying equipment parameter settings and coverage feature categories in different experimental areas. Limited sample selection further compounds this issue. To maintain accuracy, the sample data can be appropriately supplemented according to the actual situation in the experimental area. Although the waveform morphology has been studied thoroughly, additional experimental evidence is necessary to ascertain the impact of intrinsic factors such as signal reception systems on the echoes. To this end, future research will focus on expanding the study's data and signal detection.
Sep. 25, 2023Vol. 52 Issue 9 20230096 (2023)
Yi Yang, Lirong Fan, Xiaobo Wang, Fengtao He, Zuoliang Duan, and Zhanwang Min
ObjectiveWith the increase of marine rights protection, marine resource development, and underwater exploration activities, wireless optical communication has become one of the key technologies for non-contact underwater information transmission due to its advantages of high speed, easy mobility, and good concealment. The absorption, scattering, and turbulence characteristics of visible light in seawater seriously restrict the underwater transmission distance of visible light communication systems. According to the transmission characteristics of visible light in seawater, blue-green light with the range of 450-550 nm is suitable for deep-sea wireless optical communication, which is less affected by seawater. In order to improve the capacity of wireless optical communication, high-order modulation methods such as Quadrature Amplitude Modulation (QAM) are often used in wireless optical communication systems. However, QAM modulation technology requires a linear light source and channel, which limits the emission power of the light source and reduces the underwater transmission distance for underwater wireless optical communication systems. In addition, it is difficult to quickly modulate a high-power laser light sources, so the high-power laser light cannot achieve high-speed optical carrier information transmission. Therefore, the wireless optical communication system with high-speed and high-power is one of the key technologies for long-distance underwater wireless optical communication. In order to obtain high-power signal light, Free Space Optical (FSO) communication usually uses optical amplifiers to directly amplify the signal light by combining the indirect modulation technology to output high-power signal light. However, it is difficult to directly amplify the blue-green light signal to achieve high-power underwater laser output in the UOWC system due to the lack of optical amplifiers in the blue-green light.MethodsA high-power and high-speed underwater optical wireless communication (UOWC) system (Fig.1) with wavelength conversion construction (Fig.3) is designed, which adopts the second harmonic theory of nonlinear optics, as well as the 1 064 nm high-speed external modulation and the amplification technology. After analyzing the optical system and system parameters, the wavelength conversion efficiency model is deduced, and the relationship between the angle range and the conversion efficiency at different temperatures is obtained. Finally, the communication system is set up (Fig.9), and experimental analysis is carried out.Results and DiscussionsThe effect of temperature on conversion efficiency and beam quality, as well as the performances of the square wave and sine wave are tested in this paper. The results show that the optimal matching can be achieved at an angle of around 1.57° (Fig.5), no matter how the wavelength and temperature change, the conversion efficiency can be maximized. At the same wavelength, the angle adjustable range corresponding to the wave vector mismatch would be increased with the increasing temperature, but the conversion efficiency will be decreased (Fig.6). Furthermore, the beam's uniform intensity distribution quality of doubling frequency mode is significantly better than that of the modulated fundamental frequency mode at room temperature (Fig.8). In addition, the width of the rising edge and the falling edge of the square wave signal would be compressed (Fig.10), whose relative variation of the rising edge tends to 0.27, and the relative variation of the falling edge tends to 0.06, but the compression phenomenon will converge with the increase of frequency (Fig.11). The sinusoidal signal has no noticeable distortion with the increase of frequency (Fig.12).ConclusionsThe designed system improves the beam quality compared to the modulated fundamental frequency light mode, and compresses the rising and falling edge widths of the square wave signal, which will converge with the pulse width decreases, but does not distort the sine signal with increasing frequency. So the system has no effect on the high-speed digital signal and high-frequency analog signal. It is verified that the designed system can achieve 1 W high-power 532 nm green light wireless output at room temperature, the analog signal frequency is higher than 1 GHz, and the digital signal rate is faster than 500 Mbps. The research results can provide theoretical and technical support for future long-distance high-speed underwater wireless optical communication.
Sep. 25, 2023Vol. 52 Issue 9 20220814 (2023)
Guoqing Yuan, Hong Li, Xinjian Luo, Lidan Lu, and Lianqing Zhu
ObjectiveFor the detection requirements of the immobilization status of the inner surface modifiers in capillary microreactors, the sensing detection by exciting the optical whispering gallery mode (WGM) of the capillary microreactor can achieve highly sensitive, unmarked, and directly quantitative real-time detection of the immobilization status of the inner surface modifiers in capillary microreactors. Therefore, the study of mode excitation in capillary microreactor WGM is crucial. The near-field coupling devices commonly used for coupled resonant excitation of capillary microcavity WGM resonance are mainly prisms and fiber cones. However, the prism coupling system is complex and the devices are large and difficult to integrate and miniaturize. Fiber cone devices are fragile and have poor robustness. To meet the practical application requirements of capillary microreactor inner wall condition detection, a coupled resonant system with certain robustness and a simple system that can be integrated and miniaturized is required. To this end, an optical fiber wedge end coupler that excites the WGM resonance of a microtubular cavity is proposed.MethodsA resonant model of fiber wedge end-face coupled with capillary microcavity was established (Fig.1), by theoretically studying the principle of coupling the wedge end-face to the microcavity swiftly, simulating the optical field distribution and coupling resonance of the wedge end-face (Fig.2), and analyzing the spectral characteristics of the coupling resonance of the fiber wedge end-face to the microcavity (Fig.3). The wedge-shaped end fiber (Fig.7) with 75° polishing angle was prepared by grinding (Fig.6), and the experimental system (Tab.1) was built for the corresponding experimental verification. The proposed WGM coupled resonance of wedge-shaped end surfaces and capillary microcavities is investigated by theoretical analysis, simulation, and experimental verification.Results and DiscussionsSimulation of the coupling of the fiber wedge end-face to the microtubular cavity is conducted using RSoft software. The fiber wedge end-face can be successfully coupled (Fig.2) to excite WGM resonance by choosing a suitable angle for phase matching and mode field overlap with the capillary microcavity. The transmission spectrum obtained from the coupled structure shows a Lorentz concave valley (Fig.4), which is consistent with the theoretical analysis. In the experiments, different coupling resonance states can be obtained by adjusting the coupling spacing (Fig.9) using two wedge-terminated fibers with polishing angle of 75°. The Lorentz concave-valley type coupled resonance spectrum (Fig.10) is collected, which is consistent with the theoretical study and simulation analysis. The free spectral range near the wavelength of the resonance spectrum 1 563.074 nm is about 1.734 nm and the Q value is about 6.15 × 10³. The proposed fiber wedge end coupler can effectively excite the WGM mode of the capillary microcavity. ConclusionsA fiber wedge end coupler for excitation of microtubular cavity WGM resonance is proposed. The coupler has good robustness, the coupling resonance structure is stable, and the system is simple and easy to be integrated into a small size. A suitable polishing angle is selected for the end-face of the wedge fiber to meet the phase-matching condition of WGM. By adjusting the appropriate coupling spacing, the wedge-shaped fiber end surfaces are formed to overlap with the microtubular cavity mode field. Resonance between the fiber optic waveguide mode at the wedge end-face and the capillary WGM mode occurs for effective energy exchange, which in turn effectively excites the capillary microcavity WGM. The coupling structure was simulated and analyzed using RSoft, and the system was built. Experimental tests were performed using an optical fiber wedge end coupler with a polishing angle of 75° and a quartz capillary with an outer diameter of 370 μm and a wall thickness of 60 μm. The experiment was successfully coupled to excite the WGM resonance with a free spectral range of about 1.734 nm near the resonance wavelength of 1 563.074 nm and a Q value of about 6.15 × 10³. The proposed fiber optic wedge end coupler can be effectively used for mode excitation of capillary microreactor WGM resonance, which is an important guideline for capillary microreactor biochemical assay applications.
Sep. 25, 2023Vol. 52 Issue 9 20220851 (2023)
Weihong Zhu, Yang Wang, Lihao Wang, Yichen Liu, and Zhenyu Wu
SignificanceFast steering mirror (FSM) is widely utilized in satellite laser communication, super-resolution imaging, high-precision laser aiming and other fields for its quick response, high precision and high resolution. The acquisition tracking and pointing (ATP) system relies heavily on FSM. The main challenge of satellite laser communication is the extremely precise beam stabilization and pointing for maintaining laser communication between moving satellites. In order to overcome this problem, satellite laser communication terminals must rely on the tilt mirror device called FSM to guide and stabilize these laser beams. Traditional FSM is primarily driven by piezoelectric ceramics and voice coil motors. However, thanks to the disadvantages of size and weight of traditional FSM, FSM based on micro electro mechanical system (MEMS) technology is becoming the perfect solution. There are three types of MEMS FSM with electrostatic, electromagnetic and piezoelectric driver. Besides fulfilling the deflection and speed requirements for steering the communication beams, FSM on satellite must also fulfill rigorous space qualification requirements. It is worth mentioning that the reliability of MEMS FSM as novel device applied to satellite laser communications urgently needs further research, but there is less comprehensive research work on this topic.ProgressThere is no universal rule for what it means to be "space qualified", so the reliability environmental tests and standards need specify individually space qualification tests and protocols for FSM used in satellite laser communication. It includes vibration and shock test, vacuum test, radiation tolerance and thermal test. These tests address the main environmental stresses on systems during launching and operation in space. Fine aiming and advance targeting are the main roles of FSM in space laser communication terminals. Therefore, FSM not only needs to pass the above environmental tests, but also should pay attention to the changes in the optical characteristics before and after the test, such as optical surface flatness, optical reflectivity and control accuracy. Traditional FSM driven by piezoelectric ceramics (Fig.1) and voice coil motors has already withstood many performances and reliability testing for tip-tilt systems used in laser intersatellite communication. It is relatively mature and has already been working on track. However, MEMS FSM driven by electrostatic (Fig.2), electromagnetic (Fig.3) and piezoelectric (Fig.4) has advantages (Tab.1) of highly integrated, low power consumption and miniaturization, and is a very promising approach in the future. Actuators based on AlN material with self-polarizing characteristics and stable performance have been fully verified in the aerospace field, and the piezoelectric actuated MEMS FSM has been also verified in the non-space field. Finite element analysis (Fig.5) is often performed at the beginning of the design and manufacturing process to study the reliability of FSM, which can shorten the development cycle and anticipate some potential problems. Accelerated life tests with accelerating factors (Tab.2) provide a reasonable lifetime assessment of FSM in orbit, while failure criteria (Tab.2) in life tests and reliability environment tests provide verification for the qualification of FSM. The failure analysis method (Fig.6-7) is commonly used to inspect the failed FSM with or without damage, which can provide the failure mechanism of FSM and guide the reliability reinforcement and design optimization (Fig.8).Conclusions and ProspectsThe working principle, environmental adaptability and the reliability requirements of FSM are introduced in this study. The failure mechanism, evaluation method and reliability reinforcement methods of the existing FSM based on different actuation principles and structures are also reviewed. Finally, the improvement of the construction and reinforcing technology of MEMS FSM is discussed and the application for satellite laser communication is proved to be viable, through comprehensive analysis and simulation. In summary, the MEMS FSM can meet most requirements of satellite laser communication, and further verification of aerospace reliability is needed in the future.
Sep. 25, 2023Vol. 52 Issue 9 20230179 (2023)
Lin He, Wudong Deng, Liguo Song, Xuguo Zhang, Yeping Huang, Yuchen Liu, and Wenping Lei
ObjectiveSpace target detection is the basis of space situation awareness, and space-based space target observation can be independent of the geographical location of ground-based observation stations, with unique advantages. For geosynchronous orbit (GEO) targets, the current space-based system mainly uses optical observation means. In order to improve the detection sensitivity of distant and dim targets, it is usually necessary to increase the aperture of the visible light camera to increase the light collecting capacity. As a result, the weight and volume of the camera will be significantly increased, and the resource occupation and development cost of the satellite platform will be greatly increased. Therefore, it is necessary to study a new camera observation method, which can not only achieve higher sensitivity detection, but also meet the requirements of small and light payload for satellites.MethodsIn order to meet the requirements of observation GEO target from LEO, the time delay integration (TDI) push-scanning image technology of linear array CCD usually used in the earth observation camera is applied to the area array CCD, and the time delay integration (TDI) imaging mode of the area array camera is designed (Fig.2). According to the orbit characteristics of low-orbit zero inclination satellite, the GEO target speed with different inclination angles is analyzed (Tab.1), and the CCD charge transfer speed is designed to match the target speed. The point target signal is enhanced through charge accumulation, so as to improve the detection sensitivity of the camera. The principle of TDI imaging with area array is described, the calculation model of camera signal to noise ratio is derived, the main imaging parameters such as target motion, integration time, detection sensitivity and signal to noise ratio are calculated, and the influence on point target detection imaging is analyzed. In TDI mode, the east-west relative velocity of the target is compensated to zero (Fig.3), the north-south vertical image movement and the maximum integration time of the typical inclination target are calculated (Tab.2). It can be concluded that the longer the integration time is, the greater the north-south vertical image movement is. The larger the target dip angle is, the greater the north-south velocity component is, and the greater the image movement is. The maximum integration time allowed by the camera is 3.2 s when observing a target at an inclination of 15° under extreme conditions (Tab.2). Finally, the design parameters of the camera are determined. The angular resolution of the camera is 15", the aperture is 160 mm, the integration time is 3 s, and the detection sensitivity is 15 Mv (Tab.3).Results and DiscussionsA principle prototype is developed. The star simulator is used as the dim point target in the darkroom. The principle prototype is installed on a high-precision turntable to image the point target. The turntable is used to simulate the relative speed of the camera and the target. The turntable speed is adjusted to match the charge transfer speed of the camera. The camera works in the area array TDI mode to image the target and collect images. The point target image signal-to-noise ratio formula is used to calculate the camera SNR, and then complete camera sensitivity and signal-to-noise ratio index tests. Different TDI stages are adjusted to complete the camera response linearity test under different integration times. The test results show that the camera has 96 TDI stages, the sensitivity is better than 15 magnitude, the signal-to-noise ratio is greater than 5 (Fig.4), and the linearity response is good (Fig.5), which verifies the correctness of the camera design indicators.ConclusionsA visible light camera based on the area array TDI imaging mode is studied for observing GEO targets from low-orbit zero inclination satellites. Compared with the natural rendezvous and array staring imaging modes, area array TDI mode can increase exposure time through time delay integration without increasing the camera optical aperture or adding gimbal, so as to improve the camera detection sensitivity. On the one hand, it improves the camera detection sensitivity when the camera aperture is unchanged; On the other hand, the camera adopts the area array output mode, which can ensure the observation arc length requirements and facilitate the ground system to determine the target orbit. It provides a new technical approach for realizing higher sensitivity detection of GEO target from LEO.
Sep. 25, 2023Vol. 52 Issue 9 20230022 (2023)
Cong Pan, Yu Ye, Bozhong Gu, and Yulin Shuai
ObjectiveThe extinction tube of the 2.5-meter large-field and high-resolution telescope receives thermal radiation from the main focal point, heats the air in the lens barrel, generates random turbulence, reduces the astronomical seeing, and affects the imaging quality of the telescope. In order to solve this problem and meet the temperature control index requirements of temperature control, the Smith-Active Disturbance Rejection Controller (ADRC-Smith) is designed.MethodsThe designed ADRC-Smith controller uses the automatic disturbance rejection control combined with the Smith predictor method, which adds a Smith estimation module to the ESO signal input of the linear ADRC, uses the Smith predictor to cancel the time delay term in the closed-loop characteristic equation, and uses the automatic disturbance rejection controller to improve the response speed and robustness of the temperature control system to achieve accurate control of the extinction cylinder wall temperature. Firstly, the mechanism modeling and model parameter identification of the extinction cylinder temperature control system are carried out (Fig.3), the model of the extinction cylinder temperature control system is established, and the structure (Fig.5) as well as the parameter adjustment method of the ADRC-Smith controller are given. Secondly, according to the system model, the temperature control system of the matting cylinder is simulated when the model is accurate and the model is out of alignment to analyze the feasibility of the controller (Fig.6-7). Finally, the temperature control system of the matting cylinder at the main focus is set up for carrying out stability and reliability test to verify the practicality of the controller (Fig.1-2).Results and DiscussionsThe experiment results of the stability test show that the ADRC-Smith controller can quickly track the ambient temperature, control the temperature of the extinction cylinder wall within 2 ℃ of the ambient temperature, and the corresponding response time and settling time are about 59 s and 173 s respectively, and the following error is about 0.14 ℃ (Fig.9, Tab.1). After that, the reliability test of the controller is carried out, and the reliability of the controller is further verified by introducing heat source interference to cause large fluctuations in the ambient temperature (Fig.10). The results show that the ADRC-Smith controller can improve the performance of the extinction tube temperature control system of the 2.5-meter large-field and high-resolution telescope.ConclusionsAiming at the temperature control research of the 2.5-meter large-field and high-resolution telescope extinction tube, the control goal is to control the temperature of its outer wall within 2 ℃ of the ambient temperature. The temperature control system of the extinction cylinder was designed and built. The temperature control system model was established through mechanism analysis and model parameter identification. According to the characteristics of the controlled object, the ADRC-Smith controller is designed by combining Smith predictor and active disturbance rejection controller. The controller has no system deviation, which can overcome the large lag of the system, has fewer parameters and can be easy to get the parameters. On the basis of the simulation results which verify the feasibility of the controller, the stability and reliability test are carried out respectively, and it is verified that the controller can be applied to the extinction cylinder temperature control system of 2.5-meter large-field and high-resolution telescope, and the system performance can be improved. The research results can also provide guidance for the design of the temperature control system of its primary mirror and reflecting diaphragm.
Sep. 25, 2023Vol. 52 Issue 9 20230024 (2023)
Xiangxiang Meng, Han Shang, Mingrui Xin, Xudong Wang, and Mingjie Qiu
ObjectiveThe emission lens of the laser wireless power transmission system is mostly a collimated lens, which is designed using the optical fiber collimation principle and the non-focus mode of the optical design software. The end face of the optical fiber is placed at the focal plane of the lens, and the beam on and off the axis is emitted externally in the form of parallel beam. Because the end face of the optical fiber has a object height, there is a geometric divergence angle between the on-axis beam and the off-axis beam. For the collimated lens with the image plane at infinity, the off-axis beam and the on-axis beam present a staggered superposition state on the illuminated surface at a relatively close distance. Even if the illuminance distribution of the rectangular fiber core is uniform, the light spot on the receiving surface of the power transmission still presents a Gaussian distribution that gradually weakens from the center to the periphery, and the light spot boundary is not clear, which reduces the power transmission efficiency of the laser wireless power transmission system. In order to improve the optical power transmission efficiency of the laser wireless power transmission system and avoid the blurring of the light spot boundary and the poor illumination uniformity at the receiving surface at a distance of hundreds of meters caused by the use of a collimated lens, the development of a focusing transmission optical system based on the conjugate imaging principle was carried out.MethodsFirstly, the design principles of collimation method and conjugate imaging method are analyzed theoretically. Then, aiming at the 808 nm semiconductor laser light source output by optical fiber, a transmitting optical system with a focal length of 550 mm and an aperture of 260 mm is designed using conjugate imaging method (Fig.2). Focusing design is realized through the movement of optical fiber end face. The movement of optical fiber end face under different focusing distances is analyzed (Fig.4). Compared with the design results of collimation method after focusing, the wave aberration at 200 m-1 km is smaller (Fig.5). Lighttools software is used to simulate and compare the illumination spot before and after focusing.Results and DiscussionsThe simulation results show that by adding a focusing mechanism to the transmission optical system designed based on the conjugate imaging principle, clear light spot boundaries can be obtained at different distances (Fig.6). The structure of the laser emission optical system is designed. The focusing structure rotates 360° and the end face of the optical fiber moves 2 mm, which meets the requirement of 1.19 mm of total end face movement of the optical fiber in the range of 200 m-1 km. The laser emission optical system is processed. The test optical path is built with ZYGO interferometer, standard lens and plane reflector. The wave aberration RMS of the laser emission optical system when focusing to infinity is 0.092λ(λ= 632.8 nm) (Fig.9). The results show that the laser wireless power transmission system can obtain a clearer and more uniform illumination spot by using the focusing emission optical system designed based on the conjugate imaging principle. ConclusionsA focusing laser emission optical system is developed, which can be used for laser wireless power transmission at different distances. Through theoretical analysis of the collimation method and the conjugate imaging principle, the design method of the laser emission lens is determined in the case of non-infinite distance. The optical system design is carried out. The relationship between the focusing movement and the energy transfer distance is analyzed. The changes of the light spot before and after focusing at different distances are simulated and compared. Finally, the equipment development is completed, and the optical performance test is carried out to meet the design requirements.
Sep. 25, 2023Vol. 52 Issue 9 20230115 (2023)
Chenglong Wang, Bolong Yan, Mao Xu, and Jun Ma
ObjectiveThe linear Fresnel solar concentrator is one of the technologies of concentrator solar thermal power generation (CSP). Because the primary mirror are discrete flat mirrors and installed near the ground, the system has the advantages of strong wind resistance, which is especially suitable for large-scale construction in the northwest region of China with excellent solar energy resources but high wind speed. The existing research results show that the solar irradiation on the surface of the collector tube is very uneven in linear Fresnel concentrator system due to the different aiming strategies and the reflection profile of the secondary mirror. In addition, the medium in the tube is difficult to quickly divert the heat from the surface of the collector tube, the collector tube is easy to bend and deform, resulting in the breaking of the outer glass tube of the vacuum tube and the increasing heat loss of the system. The uniformity of heat flux density distribution on the absorber tube surface has a significant impact on the optical and thermal performance, as well as safe operation of linear Fresnel concentrating solar systems. Therefore, it is necessary to study the method for improving the uniform distribution of energy flux density to improve system efficiency and system security.MethodsA linear Fresnel concentrator model was built using Tonatiuh optical simulation software, a cylindrical reflector was selected as the research object, and the relationship between the focal length (radius of the reflector) and the position of the aiming point on the aiming plane and the width of the spot was studied. Based on the fact that the width of the spot is not greater than the width of the secondary mirror opening, the focal length of the mirror and the distance from the center of the aiming point are determined. According to the different distribution of aiming points, five different aiming strategies are proposed, and the specific data are shown (Tab.2). Based on this, the optical efficiency and uniformity of heat flux distribution of the linear Fresnel concentrator under different aiming strategies were explored.Results and DiscussionsWhen the height difference between the edge and the bottom of the mirror is 2.85 mm, the spot width is the smallest (Fig.3), and it is far less than the aperture width of the secondary mirror opening. The aiming point is more than 0.04 mm off center, the spot width exceeds the aperture width of the secondary mirror (Fig.5). Using the aiming strategy of uniform distribution of aiming points, the concentrator will maintain high optical efficiency while improving the uniformity of energy flow distribution on the surface of the collector tube (Fig.7). With the optimized aiming strategy, the optical efficiency of the linear Fresnel concentrator can reach 87.4% (Fig.8), the standard deviation of energy flux density on the surface of the collector tube is reduced from 45.3% to 30.7% (Fig.8), and the energy flux density at the top of the collector tube is increased by 10.2% (Fig.9).ConclusionsThe uniformity of energy flux distribution on the surface of the collector tube of linear Fresnel concentrators can be improved by adopting different aiming strategies. By rationally distributing aiming points evenly on both sides of the center, the best spot uniformity on the surface of the collector tube and the best optical efficiency of the system can be achieved. When the aiming strategy is applied to the preheating of the empty pipe of the linear Fresnel concentrators, the bending deformation of the collector tube is much smaller than the existing aiming strategy under the variable duty ratio tracking mode. The research results can provide theoretical support for the optimal design of linear Fresnel concentrator heat collection system.
Sep. 25, 2023Vol. 52 Issue 9 20230259 (2023)
Xiaomei Xue, Yanyan Qin, Yue Li, and Tong Zhang
ObjectivePhotonic integrated circuits composed of a variety of integrated functional devices on one chip have become the mainstream of the photoelectric fields due to their low loss, large bandwidth, and anti-electromagnetic interference properties, which are widely applied in optical sensing, radar, photon computing and medical testing. Due to the inherent thermo-optic characteristics of optical waveguide materials, the refractive index of the core and cladding materials will change with the temperature fluctuation, leading to the temperature stability which is one of the main problems in the engineering application of the photonic integrated circuits. Therefore, it is necessary to suppress and compensate for the drift of optical device performance with temperature to improve the temperature stability of the photonic integrated circuits. In this respect, a temperature-insensitive hybrid structure based on silicon nitride and long-range surface plasmon polariton (LRSPP) waveguides was proposed to suppress and compensate for the performance drift caused by temperature variation.MethodsFor the studies of the proposed temperature insensitive hybrid waveguide based on silicon nitride and LRSPP, the propagation properties, temperature stability and polarization characteristics were investigated. Firstly, considering the coupling efficiency between silicon nitride waveguide and LRSPP waveguide, the propagation model of silicon nitride waveguide and SPP waveguide was established. The mode coupling efficiencies and the optical propagation filed under different waveguide sizes were analyzed by using the finite difference time domain method. Then, the temperature stability was analyzed by the calculation of the phase change when the temperature fluctuated. Moreover, the polarization properties of the fabricated LRSPP waveguide were measured by the output spot and optical power under the transverse magnetic (TM) and the transverse electric (TE) mode.Results and DiscussionsThe mode coupling efficiencies between the silicon nitride waveguide and LRSPP waveguide were more than 99.9% in the optimal cases (Fig.3), resulting in the almost negligible coupling losses. What's more, the proposed hybrid waveguide still showed good propagation characteristics even with 100 nm offset in vertical direction between the silicon nitride waveguide and LRSPP waveguide (Fig.4). For the temperature characteristics of the hybrid waveguide, there was an optimal length ratio of the LRSPP and silicon nitride waveguide for the defined waveguide to realize temperature insensitivity. Specifically, when the thermo-optic coefficient of the LRSPP waveguide was -1.86×10⁻⁴/℃, the optimal length ratio was 0.077, leading to zero phase drift when the temperature changes (Fig.5). However, when the optimal length ratio is not met, the hybrid waveguide can still achieve temperature insensitivity through the active phase compensation performed by the core modulation of the LRSPP waveguide. When a voltage signal was applied directly to the core layer of the LRSPP waveguide, the temperature of the LRSPP waveguide rose and gradually stabilized to the required temperature to compensate for the temperature drift (Fig.6). A voltage of 2.5 V can achieve a temperature rise of 10 °C with the response time of 0.78 ms, which can quickly respond to the tuning needs of the waveguide, resulting in high tuning efficiency. In addition, since the LRSPP waveguide only supports TM polarization state, the proposed hybrid waveguide inherited the single-polarization characteristic. In the TM polarization state, the output of the LRSPP waveguide is good with the output optical power of -46 dBm. While in the TE polarization state there is almost no output and the output optical power is -110 dBm (the lowest detection limit of the detector) (Fig.7). Accordingly, the polarization extinction ratio was calculated as 64 dB, indicating that the LRSPP waveguide has good single-polarization characteristics. ConclusionsFrom the perspective of the basic waveguide, the proposed temperature-insensitive hybrid waveguide has the benefits of active tuning, low loss, single polarization and high universality, which can effectively address the performance drift of the silicon nitride waveguide caused by the temperature change and has broad application prospects in silicon-nitride-based photonic integrated circuits.
Sep. 25, 2023Vol. 52 Issue 9 20220881 (2023)
Guojian Ding, Xiaohui Wang, Qi Feng, Ping Yu, Haiqiang Jia, Hong Chen, and Yang Wang
ObjectiveThe photonic integration technology based on lithium niobate thin films has become increasingly prominent in the field of high-speed optoelectronics, and is widely used for various on-chip functions, such as electro-optical modulation, optical frequency comb, filter, nonlinear optical frequency converter, nonlinear quantum light source, laser etc. In the development of lithium niobate film photonic integration technology, there is an important technical bottleneck which is the effective coupling of lithium niobate film nanowaveguides and single-mode fibers, which is also the key to hinder the practical application of lithium niobate thin film photonic devices. On-chip mode size converter is widely used in mode field transformation to realize waveguide mode field transformation. Although the existing researches have improved the coupling efficiency by using bilayer tapered waveguides or composite structures, they are all coupled with tapered fiber or thin diameter fiber, which still cannot achieve effective coupling with single-mode fiber. To solve this problem, a mode size converter based on SiO2 waveguide, SiON tapered waveguide and bilayer LN tapered waveguide is designed to achieve efficient mode and energy transfer and conversion between lithium niobate film nanowaveguide and single-mode fiber. MethodsThe structure of the mode size convertor composed of SiO2 waveguide, SiON tapered waveguide and bilayer LN tapered waveguide is simulated by using the three-dimensional finite difference beam propagation method, and the structural parameters of each section are sequentially optimized through optical pattern matching design and adiabatic mode transmission design, and the optical coupling efficiency and adiabatic mode conversion efficiency of each section are simulated. Results and discussionsThe research results show that when the refractive index difference between the core layer and cladding layer of the SiO2 waveguide is 0.75% and the size of SiO2 waveguide is 6 μm×6 μm, the coupling efficiency between SiO2 waveguide and single-mode fiber is about 93% (Fig.6). When the mode field size of the wide end of SiON tapered waveguide is 2.5 μm×2.5 μm-3.5 μm×3.5 μm, the refractive index of the corresponding core layer is 1.48-1.51, the length of the SiON tapered waveguide (L1) is greater than 250 μm and the width of the tapered tip W3 is 0.1-0.3 μm, the optical mode is gradually converted from the SiO2 waveguide to the SiON waveguide, and the conversion efficiency of the SiON tapered waveguide is 93%-97.2% (Fig.8). The bilayer LN tapered waveguide includes the LN tapered planar waveguide and the LN tapered ridge waveguide. In the LN tapered planar waveguide, when the tapering length (L2) changes in the range of 200-300 μm, the width of the tapered tip W4 changes within 0.1-0.15 μm, and the width of the wide end (W5) changes in the range of 0.8-1.4 μm, the optical mode profile in LN tapered planar waveguide increases with the increase of the inverse taper width of LN tapered planar waveguide, while that in SiON layer decreases, and the conversion efficiency of the LN tapered planar waveguide is 96%-98.5% (Fig.9). In the LN tapered ridge waveguide, when the length of LN ridge tapered waveguide (L3) varies from 40 to 100 μm, and the width of the tapered tip of LN ridge tapered waveguide W6 varies from 0.1 μm to 0.3 μm, the optical mode is gradually converted into LN ridge waveguide optical mode, and conversion efficiency of the LN tapered ridge waveguide exceeds 99% (Fig.10). Through the above design, effective coupling with lithium niobate film waveguide and single-mode fiber can be realized, and the coupling efficiency is 82.2%-89.0% (Fig.11). At the same time, ± 1.8 μm fiber coupling alignment tolerance is obtained (Fig.12). ConclusionsThe proposed mode size converter based on SiO2 waveguide, SiON tapered waveguide and bilayer LN tapered waveguide provides a new method for the coupling and integration of lithium niobate thin film photonic devices, which can provide a reference for the next step of preparing highly efficient coupling lithium niobate thin film photonic devices, and is beneficial to further realize the integrated application of lithium niobate devices.
Sep. 25, 2023Vol. 52 Issue 9 20220897 (2023)
Wenlu Li, Li Pei, Bing Bai, Xiaoyan Zuo, Jianshuai Wang, Jingjing Zheng, Jing Li, and Tigang Ning
ObjectiveA tunable optical filter is the key component in the optical communication systems and optical processing systems. By tuning the central wavelength, it can be used to choose a signal with arbitrary wavelength according to the practical requirement. However, due to the high loss and large size, optical filter based on discrete devices cannot meet the requirements of some photonic signal processor. Recently, based on Mach-Zehnder interferometers network and ring-assisted Mach-Zehnder interferometer, some research groups have proposed integrated optical filter. However, this type of optical filter has the disadvantages of being difficult to train and having a single waveform, which restricts its application in the fields of multi-purpose adaptive signal processing. For improving the flexibility of optical filter, a novel tunable optical filter with an integrated photonic reservoir computing (RC) is proposed. Since the filtering properties can be controlled by intelligence algorithm, this optical filter, which improves the flexibility in applications, can be widely applied in optical cross interconnection system and microwave photon signal shaping.MethodsFirstly, the structure of integrated photonic RC is constructed in detail, and scattering matrix theory is used to analyze the transmission function of integrated photonic RC. Then, the simulated transmission spectra of the reservoir are carried out by simulation software. Particle swarm optimization (PSO) algorithm is matched for training reservoir transmission spectra in optical domain to find optimal weights. Based on thermo-optical effects, optical weights are implemented by optical modulators (OMs). During training the weights in readout layer, OMs are used to adjust the amplitudes and phases of the optical signal. Using this integrated photonic RC chip, the infinite (IIR) and finite (FIR) impulse response optical filters are realized. Finally, by adjusting the parameters of waveguide (WG) and directional coupler (DC) in the reservoir, the filtering properties is studied.Results and DiscussionsThe achieved IIR and FIR optical filter waveform are almost exactly matched to the ideal waveform (Fig.5(a), Fig.6(a)). The error value of the training results decreases in a step-like trend with the increase of the number of iterations, and eventually tends to be stable (Fig.5(b), Fig.6(b)). Based on the IIR optical filter simulation results, the effect of the free spectral range (FSR) on the WG length is analyzed (Fig.8). The WG length is negatively correlated with the FSR. As the WG length increases, the corresponding FSR becomes smaller. In addition, the influence of the DC splitting ratio on the transmission power is analyzed (Fig.9). According to the actual needs, the adjustment of different filtering intensities is achieved by setting the splitting ratio of the even number of output nodes of the reservoir. Moreover, the filtering wavelength, which is influenced by the phase of the WG in the reservoir from 0 to 3/2π, is continuously adjustable in the FSR of 1.18 nm (Fig.10).ConclusionsIn this study, a novel tunable optical filter basd on 12-node plum shaped integrated photonic RC chip is constructed. The PSO algorithm is used for training photonic RC weights to realize the IIR and FIR optical filters. The control of FSR is achieved by adjusting the length of the waveguide in the reservoir. Under the constant filter waveform, the filtering wavelength can be continuously tuned in the FSR by adjusting the phase of the WG in the reservoir (0-3π/2). The feasibility of this optical filter is verified by theory and simulation, and its tailorable performance can be used in multi-purpose adaptive signal processing application.
Sep. 25, 2023Vol. 52 Issue 9 20220915 (2023)
Ziqun Wang, Zhenhua Li, Xiaofei Hu, Liang Xu, Yaru Wang, Meng Wang, Yuanping Li, Haiyun Yao, Xin Yan, and Lanju Liang
ObjectiveThe pursuit of ultra-sensitive amino acid sensors is of great significance for biomedicine and chemical industry. Due to their low energy, high permeability, and fingerprint, terahertz (THz, 1 THz = 1012 Hz) waves are excellent candidates for the nondestructive detection of biochemical substances or molecules. For metamaterials, the strong local electric field generated by surface plasmon polariton is conducive to reflect the subtle changes of the surrounding environment into the THz signal spectrum, which provides an excellent platform for the development of ultra-sensitive, nondestructive, and unlabeled amino acid sensors. Up to now, however, few researches have been reported on amino acid sensors based on THz metamaterial. Therefore, the development of ultra-sensitive sensors that can detect amino acid solutions with low concentrations is an important subject in the realm of THz functional devices. MethodsTaking full advantage of the sensitive response of the Fermi level (EF) around the Dirac point in the graphene energy band to the sample in conjugation with the electric field strongly confined on the surface of the metamaterial, a terahertz sensor composed of graphene and metal metamaterial is proposed to realize the multi-dimensional ultra-sensitive sensing for glutamic acid. The designed sensor (denoted Dev.1) consists of a SiO2 substrate, polyimide (PI), metal arrays, and single-layer graphene. The detailed structure parameters of each metal pattern are as follows: L1=180 μm, L2=150 μm, a=20 μm, b=5 μm, c=14 μm, d=5 μm, e=18.5 μm, f=30 μm (Fig.1). The thickness of the unit cell, PI, and the substrate are 0.2 μm, 8 μm, and 300 μm, respectively. THz transmission spectra of the sensors are measured by THz-time domain spectrometer, and glutamic acid solutions with seven different concentrations are prepared: C0=0 fg/mL, C1=1.25 $ \times $10-1 fg/mL, C2=2.50 $ \times $10-1 fg/mL, C3=1.08 $ \times $101 fg/mL, C4=4.32 $ \times $102 fg/mL, C5=3.63 $ \times $105 fg/mL, C6=1.03 $ \times $1012 fg/mL. The simulation part is implemented by the time domain solver. Results and DiscussionsFor Dev.1, there is a significant resonant peak at f = 0.58 THz in the transmission spectra, which is attributed to the coupling between two groups of electrical dipole resonance modes (Fig.2(b)-(c), Fig.3). More importantly, the peak amplitude first increases and then decreases with the rising solution concentration. It means that taking $ {\Delta }{T} $ ( $ {\Delta }{T}{=}{{T}}~~{{{C}}~~{{i}}}{-}{{T}}~~{{{C}}~~{{0}}} $, where $ {{T}}~~{{{C}}~~{{i}}} $( $ {{T}}~~{{{C}}~~{{0}}} $) is transmittance for the sensor covered by Ci(C0) glutamic acid solution) as the sensing indicator, the proposed sensor can detect the minimum value in the order of 10-1 fg/mL. Such ultrasensitivity can be rationalized by the ultra-sensitive response of EF around Dirac point to the surrounding environment (Fig.4) in conjugation with the confined field induced by electrical dipole induced. In addition, one can find that the slope extracted from ΔP(f) ( $ {Δ}{P}{(}{f}{)=}{{P}}~~{{{C}}~~{{i}}}{(}{f}{)-}{{P}}~~{{{C}}~~{{0}}}{(}{f}{)} $, where $ {{P}}~~{{{C}}~~{{i}}}{(}{f}{)} $ ( $ {{P}}~~{{{C}}~~{{0}}}{(}{f}{)} $) is the phase of transmitted THz for the sensor covered by Ci(C0) glutamic acid solution vs frequency also exhibits quasi-linear dependence on Ci, and holds monotonically increasing within the range C0-C5(Fig.5). It demonstrates that the slope related to phase difference can be cross-verified with ∆T to realize multi-dimensional and ultra-sensitive detection of glutamic acid solution with the concentration of C0-C5. ConclusionsA multi-dimensional ultra-sensitive THz sensor composed of graphene and metal metamaterials is proposed for the detection of glutamic acid concentration. The experimental results show that there is a transmission peak at 0.58 THz in the THz transmission spectra, which originates from the coupling between two modes of electrical dipoles. With the increase of glutamic acid concentration, the transmission peak amplitude increases first and then decreases. Taking the peak amplitude as the sensing indicator, the limit of detection for the sensor can be as low as the order of 10-1 fg/mL. The strong confined electric field on the surface of the metamaterial together with the sensitive response of the EF in the graphene energy band to different solution concentrations causes significant changes in the electromagnetic properties of the device and the corresponding transmitted THz wave, which is the main reason for the ultra-sensitive sensing characteristics for the composite device. In addition, the effect of glutamic acid solution concentration on the phase of transmitted THz wave was also studied. The results show that the slope extracted from phase difference-frequency curves has a quasi-linear relationship with the concentration from C0 to C5. Therefore, it can also be utilized as an indicator to detect the concentration of the glutamic acid solution with 10-1 fg/mL. This work has contributed to the development of THz metamaterials in amino acid sensors.
Sep. 25, 2023Vol. 52 Issue 9 20230045 (2023)
Zhiyuan Li, Aiping Zhai, Yingze Ji, Guohui Li, Dong Wang, Wenyan Wang, Linlin Shi, Ting Ji, Fei Liu, and Yanxia Cui
SignificanceTraditionally, light intensity was utilized in optical imaging, resulting in multi-dimensional physical quantities such as spectrum, polarization and phase, and the light field information are lost, which lead to the poor performance or even failure of the traditional method in harsh conditions. However, polarization imaging technology utilizes the polarization property of light, which is insensitive to background illumination, ambient temperature and contrast. Meanwhile, polarization characteristic of light can be reserved more probably in low than that of the light intensity, and so it is more applicable to achieve effective detection of targets in special environments. Based on the unique advantages of polarization imaging, the technology is widely used in the fields of communication, imaging and detection.ProgressFirstly, four types of traditional polarization imaging systems of time-sharing (TS), division-of-amplitude (DOA), division-of-aperture (DoAp) and division-of-focal-plane (DoFP) are introduced. Except for the TS polarizaition imaging method, the other three methods all performed well in real-time imaging. The TS polarization imaging system is simple in structure and is commonly used in polarization differential imaging and 3D imaging. The DOA polarization imaging system is relatively complex and difficult to calibrate, resulting in its poor practicality. Structure of DoAp polarization imaging system is relatively compact, but the image alignment is relatively complicated. The DoFP polarization imaging system became a focus in recent researches, owing to its advantages of low energy loss, compact structure and fast imaging. For this technology, low extinction ratio of the micro-polarization array produced during the fabrication process was significantly improved with the enormous progress in processing technology and this approach is most likely to be predominant in future polarization imaging.Based on the traditional polarization imaging system, polarization 2D/3D imaging technology has been studied and made great progress. Based on polarization difference and image fusion, the polarization 2D imaging technique that has achieved good imaging results in underwater and haze environments is illustrated in detail. 2D imaging through strong scattering media and separation of high and low polarization targets are still challenging at present. For polarization 3D imaging technology, this paper provides a detailed description of the methods to solve the azimuth and zenith angle multivalence problems in the imaging process. Although high-precision 3D reconstruction of a single object in the natural environment is currently possible, the relative height of the target rather than the absolute height is recovered (Fig.5). In addition, with the existing polarization 3D imaging technology, it is unable to achieve 3D shape recovery for discontinuous and dynamic targets, and further research is still indispensable to solve these problems.With the development of micro-nano processing and integration technology, smaller and more integrated metasurface structures have been studied and applied to polarization detection. At present, full polarization detection, and polarization imaging has been realized by using polarization devices based metasurface (Fig.6).Conclusions and ProspectsPolarization imaging technology is elaborated in two aspects of polarization detection and imaging. For polarization detection, four traditional polarization imaging systems were introduced respectively. Therein, the DoFP polarization imaging system has drawn more attention due to its unique advantages of fast imaging speed and good integration. Depending on the spatial dimension, polarization 2D/3D imaging based on the traditional polarization imaging system have good prospects for detection and imaging in different fields. In order to achieve polarization detection and imaging more efficiently and conveniently, polarization devices based metasurface are fabricated and applied. Scientists at home and abroad are dedicated to continuously optimize the imaging process from five aspects of generation, transmission, modulation, acquisition and processing of polarized light, and various advanced processes and methods are effectively combined to achieve on-line polarization imaging with high stability.
Sep. 25, 2023Vol. 52 Issue 9 20220808 (2023)
Bing Chen, Shaojie Chen, Xiao Chen, Chonghui Li, and Yong Zheng
ObjectiveCelestial navigation is an important method of autonomous navigation. Astronomical observation of high-speed aircraft will be disturbed inevitably by the high-speed flow nearby the observation window, which causes the star maps degradation like displacement and blurring. And this will lead to a decrease in the accuracy of the stars center, which will have a direct effect on the accuracy of astronomical attitude determination. At present, most studies on the calculation and correction of star map degradation are based on computer simulation, whose results are greatly affected by the configuration of model parameters and may not be consistent with the real physical process. Therefore, it is necessary to construct the physical experimental observation conditions of the influence of high-speed flow on star-light deflection and to carry out experimental research.MethodsA small static wind tunnel is built, which can generate a Mach 2.5/3.5 mixing layer structure in the test section. The calibrated simulated star-points on the indoor dome with a diameter of 10 m are measured through the high-speed flow, and the star centroids are extracted to collect the data of imaging displacements by the real flow. The data of star image disturbed by the flow field are obtained and compared with the computer simulation results.Results and DiscussionsThe deflection by flow is greater than the estimated value of computer simulations. At the near end of the tunnel nozzle, the high-speed mixing layer makes a large star-light deflection. The mean deflection in the vertical direction of the flow field is less than 0.5″, and that in the direction of the flow field is 3.85″, and the maximum is close to 4.89″ (Fig.8). At the far end, the mean deflection in these two direction is -1.36″ and -0.49″ respectively (Fig.9). The variation of starlignt deflection at the near end is smaller and more stable than that at the far end, which is conducive for modeling correction (Fig.10).ConclusionsA star-points observation system under the high-speed flow was constructed based on the indoor dome, and a Mach 2.5/3.5 mixed high-speed flow field was generated in the experimental observation section. The target star-points were observed from different observation positions, and the quantitative conclusion of the high-speed flow on star-points imaging disturbance was obtained for the first time by physical observation experiment. The results show that: 1) Star-light deflection is mainly concentrated in streamwise. This result is consistent with the expectation of the theoretical analysis; 2) The star-light deflection caused by the flow field at the near end of the nozzle is larger than that at the far end, but the variation range is smaller and more stable than that at the far end, which is conducive for modeling correction; 3) The absolute value of target starlight deflection caused by high-speed mixed flow is greater than the simulation result at both near and far end of the tunnel nozzle. The current work has proved the stability and effectiveness of the experimental system, which can provide an experimental basis to form a systematic understanding of the influence of flow structure on navigation starlight acquisition by the subsequent systematic observation under different altitude angles and azimuth angles, and provide experimental data of physical observation for simulation modeling. Then, a modified model of the influence of high-speed flow fields with different structures on starlight could be established, which may provide theoretical support for the suppression of aerodynamic influence and the deflection correction of air-cooled film in the astronomical observation of hypersonic vehicles.
Sep. 25, 2023Vol. 52 Issue 9 20220802 (2023)
Zhihang Xiong, Haoji Mai, Zhuangfan Huang, Jingteng Li, Peitao Sun, Jialin Wang, Yongtao Xie, Zixi He, Yaguang Zeng, Hongjian Wang, Zhiming Guo, Ran Liao, and Hui Ma
ObjectiveSuspended particles in water include solid or liquid particles, such as sediment, microplastics, and microalgae. Accurate monitoring of their categories and concentration is of great scientific and practical significance for studying and protecting aquatic ecosystems. Various optical instruments have been developed to probe suspended particles in water, which can be divided into two categories based on the measurement methods. One category measures the overall characteristics of all particles in a body of water, while the other measures individual particles. Water Quality Analyzer (QWA) provide estimates of particle concentration and size distribution, chlorophyll-a concentration, and other water quality parameters. However, QWA are limited in their ability to accurately identify the categories of suspended particles in water. Underwater flow cytometry enables the characterization of various categories of particles by breaking up a water sample into individual particles that are then to be measured. However, this technique is expensive and requires complex sample pretreatment, which limits its application. Therefore, it is needed to develop a prototype for field detection of water samples collected in the wild, with the goal of quickly determining the categories, numbers, and proportions of suspended particles in water.MethodsSuspended Particle Classifier (SPC) has been developed in this paper and its diagram is depicted (Fig.1). The SPC employs a 445 nm laser as the excitation source to induce chlorophyll fluorescence, and the polarization state of the laser is modulated by a polarization state generator. The SPC obtains individual particle polarized light scattering and fluorescence signals, which are combined with a Support Vector Machine (SVM) to classify particles based on their optical properties. To ensure its suitability for field use, the SPC is equipped with a drainage tube for the transportation of water samples and an industrial computer for instrument control and data analysis. Standard samples of sediments, microplastics, and microalgae are collected. Then, datasets are created to train the SVM classifier. Subsequently, SPC was deployed alongside QWA in the Yamen Waterway for 25 hours to evaluate its performance (Fig.3). The accuracy of the SPC classification was verified using data obtained from the QWA.Results and DiscussionsThe SPC's classification accuracy for standard samples of sediment, microplastics, and microalgae was found to be 95.3%, 93.3%, and 97.9% (Fig.4), respectively, indicating that the classifier has good performance in classifying these particles. The average accuracy and recall rate were found to be 95.5% (Tab.1), indicating the SVM model has strong feature extraction ability. These results suggest that the SPC can accurately classify standard samples. When applied in the Yamen Waterway, the SPC was able to rapidly measure water samples collected in the field and track the changes in the number of sediments, microplastic, and microalgae in different water layers over time (Fig.5). Furthermore, the number of microalgae identified by the SPC was found to have a strong correlation with the concentration of chlorophyll-a and phycoerythrin measured by the QWA (Fig.6, Tab.2). Additionally, the so-called effective time cross-section of sediments identified by the SPC was found to have a strong correlation with the turbidity value measured by the QWA (Fig.6, Tab.2), further validating the reliability of the SPC's classification results.ConclusionsIn this study, a suspended particle classifier was developed with the aim of classifying and counting suspended particles in water samples collected in the field. The SPC probes polarized light scattering and fluorescence signals from individual suspended particles and uses SVM to classify them based on their optical properties. The classification accuracy for standard samples of sediment, microplastics, and microalgae was over 95%. To validate the SPC's classification ability for field water samples, the SPC and QWA were deployed in the Yamen Waterway for 25 hours of synchronous testing. The SPC was able to track changes in the number of sediment, microplastic, and microalgae in different water layers over time. There was a strong correlation between the SPC and QWA measurement data, indicating the high reliability of the SPC in classifying particles in field water samples. These results demonstrate that the SPC can rapidly detect and classify suspended particles in water and has the potential to be a valuable tool for exploring aquatic ecosystems.
Sep. 25, 2023Vol. 52 Issue 9 20230030 (2023)
© Copyright 2018-2021 | Chinese Laser Press.
All Rights Reserved 沪ICP备15018463号-20