


 View fulltext

2023
Volume: 52 Issue 7
32 Article(s)

Wei Zheng, Di Zhang, Hao Yuan, Nana Yu, Sixing Xi, Guilin Wang, Shuai Ma, Xiaolei Wang, and Liying Lang
ObjectiveIn order to improve the capacity and security of the optical encryption system, a new method based on OAM holography and frequency shift is proposed.MethodsSince the orbital angular momentum eigenstates mathematically constitute a complete set of orthogonal basis vectors, the orbital angular momentum can be used to realize the encoding of multiple image information. This approach achieves parallel encryption of multiple images information using Fourier transform frequency-shift and OAM holography techniques, which eliminates the crosstalk between multiple image information. Firstly, several original images information are sampled, and the sampling constants is determined by the spatial frequency of the helical phase with different helical mode indexes, which is defined as the pixel width corresponding to 30% of the maximum amplitude modulus (Fig.3). Through this process, we obtained multiple different sampled images. The orbital angular momentum-preserving holograms are then generated by the coherent superposition of multiple sampled image information modulated by random phase, Fourier transform and frequency shift phase (Fig.4). Finally, the helical phases of different helical mode indexes are encoded into two orbital angular momentum preserving holograms, and two OAM selective holograms are obtained, they are superposed coherently to form the final OAM composite selected hologram (Fig.5). In decrypted process, the orbital angular momentum compound choice hologram is loaded onto the spatial light modulator, which is illuminated by a vortex beam containing a specific helical mode index and passes through a Fourier lens, a receiving device on the rear focal plane of the lens can receive a plurality of decrypted images (Fig.6).Results and DiscussionsCompared with other multi-image encryption algorithms, the proposed method can encrypt multiple image information of different sizes and types into a single hologram through two encryption processes, and no original information is displayed in the ciphertext image. The correlation of ciphertext image information in all directions is very low, which effectively reduces the statistical characteristics of highly correlated original image information, and can effectively resist statistical attacks based on pixel correlation, with high security (Tab.1, Tab.2). This encryption system has high encryption flexibility and great capacity. It can not only design different frequency shift factors to encrypt a group of multiple images information in parallel under the same helical mode index, but also has the advantages of high encryption flexibility and high encryption capacity, several groups of image information can also be encrypted by using different helical mode index.ConclusionsIn this method, the infinite OAM mode of the vortex beam are set as a new optical key, which greatly improves the security of the encryption system. In addition, due to the frequency-shift phase modulation, the size of the image to be encrypted is not limited by the number of pixels in the Spatial light modulator, which greatly improves the feasibility and effectiveness of optical realization of information encryption. The simulation results show that the proposed method has high safety, anti-noise and anti-shear capability (Fig.11, Fig.12).
Jul. 25, 2023Vol. 52 Issue 7 20230313 (2023)
Chengming Ren, Qingyu Meng, and Zichang Qin
ObjectiveOff-axis three-mirror optical systems, based on the advantages of non-obscuration and capable of achieving a large field of view (FOV), can exhibit excellent optical performance, combined with the optical freeform surface with high degrees of freedom and strong aberration correction ability. The improvement of the imaging requirements has led to the continuous increase of the aperture and focal length of the reflective optical system, the error sensitivity of the optical system increases dramatically, resulting in higher processing difficulty and alignment sensitivity, as well as substantial time and economic costs. Error sensitivity represents the sensitivity of optical system after misalignment. The tolerance accuracy of optical system with low error sensitivity is loose. By controlling error sensitivity during the optimization process, an optimal balance can be achieved between image quality and cost. Therefore, desensitization optimization is an indispensable part of the large freeform off-axis three-mirror optical system design process.MethodsLow error sensitivity optical system design begins with the selection of image quality evaluation criteria that can characterize the error sensitivity. The optical path difference and wavefront error are selected as two image quality evaluation criteria, and the geometrical optics method is adopted to establish the mathematical model of ray tracing before and after misalignment (Fig.1, Fig.4). Then the mathematical relationship between the parameters of the optical system and the error sensitivity is obtained, two error sensitivity evaluation functions (S and LC) are constructed based on the mathematical relationship, and the angle optimization desensitization design method and the local curvature desensitization design method are proposed as two desensitization design methods applicable to freeform optical systems according to the evaluation functions. A desensitization design process for large freeform off-axis three-mirror optical systems is developed (Fig.5). Two proposed desensitization design methods are applied to desensitize a large freeform off-axis three-mirror optical system with a focal length of 30 000 mm, an F number of 15 and an FOV of 1°×1° (Tab.1), and the desensitization effect of the two methods is compared. Results and DiscussionsThe initial structure of the large freeform off-axis three-mirror optical system is System 1 (Fig.7), the angle optimization desensitization design method is used to obtain System 2, and the local curvature control desensitization design method is used to obtain System 3. The modulation transfer function (MTF) of all three systems is close to the diffraction limit, and the average RMS WFE of System 1, System 2, and System 3 is 0.038λ, 0.036λ and 0.039λ respectively (Fig.8), the image quality of all three systems is in the range of 0.038× (1±5%)λ and less than 1/15λ of each FOV (Fig.8).The total length of System 1, System 2, and System 3 is9 097.23 mm, 8 862.07 mm and 9 100.00 mm (Tab.2) respectively. The three systems are identical in configuration and differ slightly in total length. Under the tilt error perturbation (tangential: 0.001°, sagittal: 0.001°), the error sensitivity (ΔRMS WFE) of System 1, System 2, and System 3 is 0.089λ, 0.073λ and 0.062λ respectively (Fig.9). The error sensitivity is reduced by 17.98% using the angle optimization desensitization design method and by 30.34% using the local curvature control desensitization design method, obviously the latter method has better desensitization effect. ConclusionsIn this paper, the angle optimization desensitization design method and the local curvature control desensitization design method are introduced to desensitize the large freeform off-axis three-mirror optical system. Systems designed with different methods are compared, and the results demonstrate that, under the condition of no significant differences in optical system configuration, both desensitization design methods exhibit excellent theoretical aberration correction results for the optical system, and the MTF of the systems is close to the diffraction limit. The two desensitization design methods can effectively reduce the error sensitivity of the optical system, and it is found that the local curvature control desensitization design method can achieve better desensitization performance. Applying the desensitization design method in the large freeform off-axis three-mirror optical system design process correctly can significantly improve the system robustness, and effectively reduce the manufacturing cost, which is of great significance for the design and construction of large optical systems.
Jul. 25, 2023Vol. 52 Issue 7 20230287 (2023)
Jingfei Ye, Yu Zhu, Youyang Gu, Huanqiu Zhan, Shuqin Cao, Jianmin Wei, Zhenzhen Song, Zhaolou Cao, and Gaige Zheng
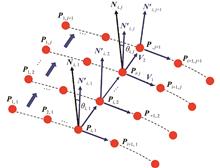
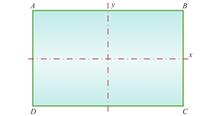
ObjectiveIn many laser industrial applications, laser beam shaping is an important process to redistribute the laser energy, which is highly essential to obtain uniform or prescribed spatial energy distribution with high efficiency. At present, there are different methods for laser beam shaping, including the grouped aspheric lenses, microlens arrays, diffractive optical elements, liquid crystal spatial light modulator and freeform optical technology. Compared with other laser beam shaping methods, the method using freeform surfaces is beneficial to make the shaping optical system more simplified and more compact. In the current freeform surface construction method for laser beam shaping, the seed curve extension algorithm in one direction has the non-negligible normal vector deviation during the generation of surface sampling points. Therefore, in this paper, a method is proposed to reduce the normal errors to improve the construction precision of freeform reflector for obtaining the highly uniform spatial energy distribution in the target plane.MethodsThere are mainly three steps for constructing the freeform surface (Fig.2-3). At first, the incident beam and the target plane are divided in grids according to equal energy and equal area. The main purpose of this step is to obtain the one-to-one energy mapping between the light source and the target plane, which is based on the conservation of energy and Snell's law. Then, the initial constraint conditions are set according to the requirements, which are used to calculate the sampling data points of horizontal and vertical curves on the freeform surface. Finally, according to the results of previous two steps, the sample data points on the unknown freeform surface can be calculated by iteration together with normal error correction. The averaging approach of coordinates of adjacent sampling points in the orthogonal direction is applied to relieve the normal deviations, which is very useful for reducing the normal errors to obtain smooth freeform surface relatively.Results and DiscussionsThe proposed freeform surface construction method can effectively regulate a collimated Gaussian laser beam into the square or rectangular intensity distribution with high uniformity. On the target plane for a square pattern (Fig.5), the normalized irradiance uniformity is about 88.70% in the global region. Along the lines x=0 mm and y=0 mm on the target plane, the irradiance uniformity is about Ux=88.18% and Uy=86.67% respectively. Besides, the irradiance uniformity of local region (70 mm×70 mm) is about 92%. In the similar way, for a rectangular pattern on the target plane (Fig.6), the corresponding normalized irradiance uniformity is as high as about 94.30% as well as Ux=92.96% and Uy=94.07% along the lines x=0 mm and y=0 mm, which realize the laser beam shaping with high performance. On the other hand, the irradiance uniformity can also reach about 90% when the target plane has different distances for the square pattern (Fig.7-8). This indicates that the proposed method keeps robust elegantly. Further, in the aspect of surface smoothness, fitting precision and irradiance uniformity stability over a certain manufacturing error range (Fig.10-12), the freeform surface constructed by the proposed method shows great performance compared with that constructed by the traditional design method. ConclusionsThe freeform surface design by iteration in two orthogonal directions with surface normal correction is proposed, which can effectively regulate a collimated Gaussian laser beam into the square or rectangular intensity distribution with high uniformity. The feature sampling points of the freeform reflector are calculated iteratively in two orthogonal directions based on energy conservation and Snell’s law. Meanwhile, the averaging approach of coordinates of adjacent sampling points in the orthogonal direction can relieve the normal deviations effectively. Therefore, it is very helpful for constructing the freeform surface more precisely. The capabilities of the presented method are demonstrated and verified by examples. Moreover, for the target plane with different distances within a certain range, the energy uniformity maintains 90% well. At the same time, the freeform surface designed by the proposed method not only has high fitting accuracy, but also has a more stable irradiance uniformity on target plane within the allowable machining error range. It means that the proposed freeform surface construction method keeps robust elegantly, which is very necessary and critical for laser beam shaping.
Jul. 25, 2023Vol. 52 Issue 7 20230299 (2023)
Lijun Zhou, Tong Yang, Dewen Cheng, and Yongtian Wang
ObjectiveCompared with traditional spherical and aspherical optical surfaces, freeform optical surface offers more degrees of design freedom, and it can be used in the design of imaging systems with more advanced system specifications, better imaging performance, more compact structure and novel functions. During freeform imaging system design and optimization, high imaging performance is an important design target. In addition, the freeform surfaces should be easier to be tested and fabricated. Interferometric surface testing is one of the most accurate methods for freeform surface and it is now increasingly used. To decrease the testing difficulty, the sag difference between the freeform surface and the base sphere or base conic should be as small as possible. For rotationally symmetric systems, the sag difference can be controlled easily and efficiently by using circular-domain orthogonal polynomial surfaces such as Zernike polynomials surface and Q2D polynomials surface. However, for nonrotationally symmetric freeform systems, as rectangular field-of-view is often used, the freeform surfaces often have rectangular aperture, the ability of circular-domain orthogonal polynomial surfaces is limited. Therefore, it is necessary to establish a design method to control the testing difficulty of freeform surface with rectangular aperture.MethodsA design method of imaging systems using square-domain orthogonal polynomials freeform surface is proposed. Two kinds of square-domain orthogonal polynomials of Chebyshev polynomials and Legendre polynomials are analyzed and used. The inner product of the surface sag difference using orthogonal surfaces is related to the weighted square sum of the polynomial coefficients. For Chebyshev polynomials, as its weight function is a complicated function of x and y, it is not straightforward to use this property to control the sag difference. However, the sag difference can be controlled by constraining the sum of sag difference around the margins of the rectangular aperture to be zero. In addition, piston and tilt terms in orthogonal surface description should be zero. This can be controlled by constraining linear combinations of surface coefficients to be zero during optimization. For Legendre polynomials surface type, the constraint on the aperture margin can still be used. In addition, as the weight function of Legendre polynomials is one, the square sum of the polynomial coefficients can be used directly, which can be integrated into the total merit function during optimization. Detailed mathematical equations for establishing the design constraints and merit functions can be found in Eqs. (8), (9), (15)-(18). Results and DiscussionsSeveral design examples are used to show the feasibility and effect of the proposed design method. For Chebyshev polynomials freeform surface, a freeform off-axis three-mirror system whose primary and tertiary mirrors are integrated into one surface is designed. Compared with the design using traditional XY polynomials surface without sag difference constraints, the sag difference of the freeform surfaces in the system using Chebyshev polynomials surface is effectively controlled (Fig.2-3, Tab.3). For Legendre polynomials freeform surface, three kinds of off-axis three-mirror systems are designed: a system whose primary and tertiary mirrors are integrated into one surface, a system with the traditional zig-zag structure, and a system with a cylindrical package and real exit pupil. The design constraints on the sag difference at aperture margins, and the constraints on square sum of surface coefficients are used. Compared with the design using traditional XY polynomials surface without sag difference constraints, the sag difference of the freeform surfaces in the system using Legendre polynomials surface is effectively controlled (Fig.4, Fig.6, Fig.8, Tab.4-6). ConclusionsFor the commonly used rectangular surface aperture in freeform imaging system, a design method of freeform imaging system using square-domain orthogonal polynomials freeform surface is proposed. Chebyshev polynomials freeform surface and Legendre polynomials freeform surfaces are used and discussed. Based on the mathematical properties of the two kinds of polynomials, the mathematical constraints on the sag difference at the margins of the rectangular aperture and the constraints on the square sum of the polynomial coefficients are derived. Several design examples are given to show the feasibility and effect of the proposed design method. The design results show that, using the proposed design method and square-domain orthogonal Chebyshev and Legendre polynomials, the surface sag difference between the freeform surface and the base surface can be reduced effectively, and the testing difficulty can be reduced. The proposed method can be used in the design and development of all kinds of freeform imaging systems, and can be easily implemented in optical design software and other computing platforms and environments.
Jul. 25, 2023Vol. 52 Issue 7 20230317 (2023)
Lusong Jiang, Yu Chen, Xiaohua Hai, and Liwei Peng
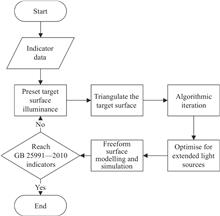
ObjectiveLaser light source is a new type of automotive headlight light source that is efficient, compact, and long-lasting. It has attracted wide attention and research in recent years. It can provide longer and brighter illumination distance and brightness, as well as higher design freedom for heat dissipation and styling. Currently, some universities and research institutions have designed and optimized the freeform optical structure of laser headlights. However, most of the existing methods adopt sub-surface stitching or surface array to achieve the target illuminance distribution, which leads to discontinuity of the freeform surface and increases the production processing difficulty. In addition, the reflectors designed by the existing methods have low energy utilization rate. Aiming at the problems of difficult optical structure design and low energy utilization rate of laser headlights, a new freeform reflector design method based on spherical optimal transport theory is proposed, and a freeform reflector suitable for laser headlights (including low beam and high beam) is designed using this method.MethodsThe algorithm flow chart of freeform reflector design is shown (Fig.1). First, according to the coordinates and illuminance of the test points and boundary vertices of the test area given by the regulation GB 25991—2010, the target illuminance on the target surface is obtained by using thin plate spline interpolation method. Then, different density Delaunay triangulation is performed on the target surface. A series of rotating ellipsoids are obtained with the origin and triangulation vertices as focal points (Fig.2), which are used to form the freeform surface. Then, the reflector design algorithm based on spherical optimal transport is used to iterate and obtain the eccentricity of these rotating ellipsoids. According to the size and luminous characteristics of the light source, the area of reflection light on the target surface is determined (Fig.5). If there is light irradiating to the dark area, the position of the sampling point is adjusted (Fig.7) until no reflected light can irradiate to the dark area. Finally, SolidWorks is used to model the reflection surface entity, fit it into a continuous freeform surface, and import it into Lighttools for optical simulation to verify the reliability of the algorithm.Results and DiscussionsSimulation is carried out for low beam and high beam respectively. The light source used in simulation is a Lambert light source with a diameter of 1.2 mm and a divergence angle of 60° full angle. The simulation results show that the illuminance distribution on the distribution screen meets the regulation requirements, and the reflection surfaces are smooth and continuous. The illuminance of test points on low beam target surface is listed (Tab.3). The energy utilization rate of low beam system is 96.96%, and a clear bright-dark cutoff line is realized (Fig.12). The illuminance of test points on high beam target surface is listed (Tab.4). The high beam reflector is an array of three identical reflection surfaces. The energy utilization rate of high beam system is 97.80%.ConclusionsThis paper proposes an improved reflector design method and designs a freeform reflector for laser headlights (including low beam and high beam). The reflector can not only form a distribution that meets the regulation GB25991—2010 requirements, but also has a smooth surface shape and high energy utilization rate. It can effectively reduce the power consumption of automotive headlights, improve the heat dissipation performance of automotive headlights, extend the service life of laser light sources, and facilitate equipment production and processing. It conforms to the new development trend of energy conservation, environmental protection and efficient use of energy in future automotive industry.
Jul. 25, 2023Vol. 52 Issue 7 20230321 (2023)
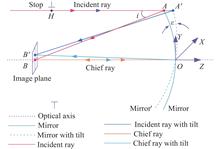
Ningyan Xu, Zhishan Gao, Lu Chen, Jing Huang, Yutong Zou, and Qun Yuan
ObjectiveTelephoto lens is widely used in astronomy, space optics, aerial reconnaissance, security monitoring and other fields due to its ability to image distant objects. For devices with high requirement of miniaturization and lightweight, such as telephoto lens mounted on mobile phone, the majority solution is to use one or more prisms to fold the optical path to form a periscopic-type lens. Although this approach allows the element to be placed in an ultra-thin mobile terminal, it does not solve the lengthy, voluminous and weighty problem caused by the characteristics of telephoto lens. Instead, multiple prisms are added to the system as reflective elements, making the structure even bulkier. For the purpose of designing a compact and lightweight telephoto lens, this paper explores the solution of compact system design based on the structure of off-axis three-mirror imager. The initial structure is designed by utilizing the optical properties of conical surface to achieve ideal imaging of the on-axis object. Freeform surface is applied to extend field of view (FOV) to complete the design of a compact telephoto optical system.MethodsOff-axis three-mirror imager has the advantages of lightness, compactness, non-chromatic, unobstructed aperture, high reflectiveness, and low optical energy loss for all wavelengths after being coated. A compact telephoto lens design method is proposed based on the off-axis three-mirror structure. Firstly, positive-negative-positive (PNP) power distribution was decided for the purpose of compactness. Unobscured PNP reflective imagers with different layouts of elements are listed (Fig.2). Then they are analysed and compared in terms of both compactness and imaging performance. After the structure type has been determined, parameters such as distance and angle can be calculated (Fig.3). Next, the optical properties of conical surfaces whose focal points conjugate between each other are used to calculate surface parameters such as conical coefficients and vertex radius of curvature to construct the initial structure (Fig.4), which can image on-axis object ideally. Taking telephoto lens applied to smartphone as an example, after calculating initial structural parameters with the above design method, the judgment condition that ray is obscured or not is established, and an optimized design strategy is developed to construct freeform surface, extend FOV (Fig.5) and optimize the system (Fig.6). The design of a compact telephoto lens is implemented and the feasibility of the design method is verified.Results and DiscussionsThe result (Fig.7) is a compact telephoto lens with an F-number of 5, equivalent focal length of 196 mm and FOV of ±3.8°, consisting of only three reflective mirror and volume of 26 mm × 24 mm × 10 mm. The design results show that modulation transfer function (MTF) is greater than 0.2 at 114 lp/mm for all FOV (Fig.8), relative distortion is less than 0.5% (Fig.9) and displays good performance of imaging quality (Fig.10), meeting the imaging requirements of mobile phone lens. Our design is comparable to the current market indicators of periscopic-type telephoto lens in terms of design parameters. Although the F-number is slightly larger, effective focal length is longer, and it has obvious advantages in miniaturization and light weight. ConclusionsIn order to achieve a compact and lightweight telephoto lens design, this paper proposes a design method for a compact telephoto system based on optical characteristics of conical surface, combined with the off-axis three-mirror structure type. With the initial structure of off-axis three-mirror with ideal imaging at on-axis object, freeform surface is used to achieve a compact, lightweight, and high image quality telephoto system based on the unobstructed judgment condition and FOV expansion optimization strategy. The solution contains only three mirrors to fold ray path and compress volume, resulting in a lighter system with fewer lenses and less optical energy loss than a refractive telephoto imager, and an unrestricted wavelength band which means non-chromatic. Additionally, conical surface is used to calculate off-axis initial structure directly without aberrations at on-axis object, and subsequently controlling optimization process in combination with unobstruction judgement, avoiding the problem of aperture obstructed in the reflective telephoto. The result is a compact telephoto lens with an F-number of 5, an equivalent focal length of 196 mm and a field of view of ±3.8°, which meets the imaging requirements and has obvious advantages in terms of miniaturization and lightness compared to periscopic-type telephoto lens, providing a new solution to the design of compact telephoto lenses.
Jul. 25, 2023Vol. 52 Issue 7 20230322 (2023)

Fanqi Shen, Yuqin Chen, Lin Yang, Jun She, Kai Chen, Jianming Huang, and Rengmao Wu
ObjectiveSimultaneous modulation of beam intensity and wavefront with freeform surfaces is widely used in illumination optics and imaging optics. The current method of simultaneous modulation of beam intensity and wavefront is generally aimed at vertical-axis optical systems. However, the optical system generally has an off-axis layout to achieve a compact optical structure. In this paper, we proposed a method to design freeform surfaces to realize simultaneous modulation of beam intensity and wavefront on the tilted target plane.MethodsFirstly, a virtual observation plane perpendicular to the optical axis is set up, and the mapping relationship between the specific irradiance distribution on the target off-axis observation plane and the corresponding irradiance distribution on the vertical axis virtual observation plane is established. Then the Monge–Ampère (MA) equation with nonlinear boundary conditions for the vertical virtual plane is established according to Snell's law, local energy conservation law, and optical path conservation constraints. Then the finite difference method is used to solve the beam control model of vertical axis layout, and the numerical solutions of beam intensity and wavefront modulation of freeform surface on the off-axis observation plane are obtained. Finally, the Monte Carlo ray tracing method is used to verify the effectiveness of the designed freeform surface.Results and DiscussionThe design example is to use two freeform surfaces to shape a Lambertian point source into a uniform square irradiance distribution on an off-axis target plane, the shaped beam is a divergent spherical wave, and the off-axis target surface has an inclination angle of 30 degrees. The obtained surfaces are intricate but smooth, continuous, and easy to fabricate. Researchers use 10 million rays for Monte Carlo tracing to verify the effectiveness of the designed lens. The irradiance distribution on the target plane demonstrates the effectiveness of the modulation of beam intensity, with the irradiance error RMS=0.0117. The analysis of the outgoing wavefront and the simulation results at different distances verify the effectiveness of the modulation of the beam wavefront. ConclusionSimultaneous modulation of beam intensity and wavefront is a challenging but worth exploring problem. In this paper, the efficient and accurate modulation of beam intensity and wavefront under an inclined optical path layout is realized by establishing the mapping transformation of off-axis irradiance distribution to vertical irradiance distribution. This method breaks the restriction of vertical optical path layout and obtains a flexible optical path layout, which plays an active role in promoting the wide application of freeform surface beam modulation. This method uses only two freeform surfaces to realize efficient and flexible modulation of beam intensity and wavefront, which will promote the beam control system towards the direction of comprehensive function and compact system.
Jul. 25, 2023Vol. 52 Issue 7 20230323 (2023)
Rong Gao, Xianglong Mao, Jinpeng Li, Zhichen Xu, and Yongjun Xie
ObjectiveInfrared detection technology has the advantage of passive thermal radiation detection and continuous work day and night. It can greatly reduce the restriction of environmental factors such as the light conditions. It is widely used in ecological environment monitoring, night vision detection, precision guidance and other fields. In recent years, with the development of infrared detection technology, especially in the field of aviation and aerospace remote sensing, in order to improve the timeliness of infrared remote sensing detection and realize the large-scale deployment of infrared detection system, the demand for large-field-of-view, high-compact, lightweight and low-cost infrared detection system is becoming more and more urgent. For this purpose, a freeform off-axis four-mirror all-aluminum infrared optical detection system with a large field of view and a compact package is designed in this paper.MethodsA freeform off-axis four-mirror all-aluminum infrared optical detection system is designed and built in this paper. The optical system has a real exit pupil to connect the cold aperture of a cooled infrared detector (Fig.2). The 7th order XY polynomials is used to represent the surface of the four freeform mirrors. The full-field geometric spot radius, wave aberration, modulation transfer function, and distortion grid are analyzed (Fig.5-9). The Monte Carlo algorithm is used for tolerance analysis to determine the influence of the alignment errors of the four mirrors (Tab.3). The optical system adopts an all-aluminum optomechanical design (Fig.12), in which the aluminum freeform mirror employs a three-ear flexible support mode to reduce the rigid connection stress (Fig.13). The optical, mechanical and thermal integration analysis is carried out, and the athermal effect of the optical system is verified (Fig.14-16). The optical system is assembled, and the full-field wave aberration is measured (Fig.17-18). Results and DiscussionsThe optimized freeform off-axis four-mirror optical system has a large field of view of 6.25°×5°. The maximal geometric spot radius over the whole field of view is 5.36 μm, which is far less than the radius of the airy spot (Fig.5-6). The full-field wavefront error is less than 0.037λ@8.85 μm, which approaches the diffraction limit (Fig.7). The minimal MTF at 20 lp/mm is 0.48 (Fig.8). Considering the conventional alignment errors of the four mirrors (Tab.3), the geometric spot radius of the optical system is expect to be less than 19.8 μm. According to the optical, mechanical and thermal integration analysis, the maximal full-field geometric spot radius is slightly changed from 5.36 μm to 5.49 μm when the working temperature is changed from 20 ℃ to 30 ℃ (Fig.16). The result proves that the all-aluminum optomechanical system potentially has the optically athermal characteristics. The prototype has a focal length of 146.2 mm and a NETD of 26.8 mK. The measured wavefront error of the prototype is less than RMS 0.7λ@632.8 nm, which meets the technical requirements (Fig.18). ConclusionsA freeform off-axis four-mirror all-aluminum infrared optical system with a real exit pupil, a large field of view and a compact package is built in this paper. The optical system has a field of view of 6.25°×5°. The designed full-field geometric spot radius, wavefront error and modulation transfer function all approach the diffraction limit. The tolerance analysis of the alignment errors of the four mirrors is carried out based on the Monte Carlo algorithm, which leads to a full-field geometric spot radius of less than 19.8 μm. The optical system adopts an all-aluminum optomechanical design, which naturally possesses an optically athermal potentiality. The optical, mechanical and thermal integration analysis for a temperature rise of 10 ℃ of the optical system verifies the optical athermality of the optical system. The measured full-field wavefront error of the prototype is less than RMS 0.7λ@632.8 nm. The captured far field infrared image shows the high performance of the prototype. Compared with the traditional off-axis reflective optical system, the demonstrated optical system adopts a new configuration of "all-freeform optical surfaces + all-aluminum optomechanics". It can achieve a larger field of view with a more compact envelope. And, the system has the characteristics of lightweight, low cost and optical athermality, which has important application prospects in the field of infrared detection.
Jul. 25, 2023Vol. 52 Issue 7 20230338 (2023)
Zhuang Qian, Yan Mo, Rundong Fan, Hao Tan, Huiru Ji, and Donglin Ma
ObjectiveA cooled off-axis three-mirror system with a large rectangular field of view based on freeform surface is designed to satisfy the requirement of infrared remote sensing using a large plane array detector. The off-axis three-mirror system is composed of one even aspherical surface and two freeform surfaces, achieving secondary imaging with a real exit pupil that matches the cold shield, resulting in 100% cold shield efficiency. The system has larger rectangular field and decent imaging quality compared to other off-axis three-mirror systems, which ensures the adaption to large-format infrared detectors with a 4 k resolution. The system has a focal length of 150 mm, working waveband of 1.5-5 μm, F-number of 5, and field of view of 30°×25°. The primary mirror is even-order aspherical surface, and the secondary and third mirror are XY polynomial surfaces. High-order aberrations are properly corrected with the adoption of freeform surfaces, so the modulation transfer function of the system at 25 lp/mm exceeds 0.4 across all fields of view, meeting the imaging quality requirements of large-format infrared detectors. MethodsAn off-axis three-mirror systems with large rectangular field of view is presented in this paper. The initial structure is a coaxial three-mirror system with its optical power distribution being convex-concave-concave (Fig.1). The curvatures of three mirrors are calculated by eliminating primary aberrations based on Seidel aberration theory. The off-axis three-mirror system is derived from the coaxial structure by shifting the field center. According to Nodal aberration theory, even aspherical surfaces are adopted to shift aberration contributions of surfaces to new field centers so they can compensate for each other (Fig.3). The off-axis three-mirror system with large field of view in tangential direction is further optimized with pupil shifting (Tab.1). The secondary and third mirror are then converted to XY polynomial surface to expand field of view in horizontal direction while the image quality is not degenerating. Results and DiscussionsThe optimized off-axis three-mirror system is presented (Fig.5) with primary mirror being even aspherical surface, the secondary and third mirror being XY polynomial free-form surfaces. The system meets the requirements of the detector and the design specifications (Tab.2) and the efficiency of cold diaphragm is 100%. The modulation transfer function of the system at 25 lp/mm exceeds 0.4 across all fields of view (Fig.6). RMS radius of spot diagram for all fields of view are less than Airy disk radius (Fig.7), indicating a good imaging quality. The maximum distortion of the system is -4.88%, which is acceptable and can be corrected by specific image processing algorithm. A tolerance analysis is conducted on the system, proving a good instrumentation feasibility (Fig.9). ConclusionsA cooled off-axis three-mirror system with a large rectangular field of view is presented in this paper. The field of view of the system is 30°×25°, and F-number is 5, ensuring the adaption to 4000×3400@20 μm infrared detector. Of three mirrors of the system, the primary mirror is even aspherical surface, and the secondary and third mirror are XY polynomial free-form surfaces. The system is a re-imaging structure with no obscuration and a real exit pupil matching cold shield of the detector, achieving 100% cold shield efficiency. The image quality is good when the system works in 1.5-5 μm waveband, thus the system has broad application in optical remote imaging and sensing field.
Jul. 25, 2023Vol. 52 Issue 7 20230339 (2023)
Enguo Chen, Kangkang Chen, Zhengui Fan, Zhilin Sun, Zijian Lin, Kaixin Zhang, Jie Sun, Qun Yan, and Tailiang Guo
ObjectThe optical engine design of augmented reality (AR) near-eye display is one of the research hotspots in the field of display technology. It projects virtual images to the real physical environment for display, and simultaneously enhances, merges, and complements the physical world in space. AR near-eye display optical engine has high requirements for the integration and miniaturization of optical system, and the glass-like AR near-eye display optical device is an inevitable development trend in the future. Optical metasurface is an artificial structure array composed of subwavelength unit structure periodically arranged on a two-dimensional plane. It realizes arbitrary regulation of the amplitude, phase, and polarization of the light field through the interaction of the unit structure and electromagnetic wave. At the same time, it has the characteristics of small size, high efficiency, and compact structure, and has great potential in near-eye display applications.MethodsIn this paper, a metasurface structure is designed as the decoupled structure of the AR near-eye display optical waveguide (Fig.1). The decoupled part adopts a waveguide with a cutting angle of 60°. By changing the angle of incident light, the incident light propagates inside the waveguide at 50°-75°. The coupled part of the metasurface has a height of 900 nm and a radius of 50-120 nm (Fig.6). The AR near-eye display optical waveguide is simplified and simulated in FDTD. The light source is placed inside the waveguide to simulate the total reflection of the incident light, and the decoupling angle is simulated by changing the incident angle.Results and DiscussionsWhen the collimated light is incident into the metasurface structure, the outgoing light deviates from the z-axis by -35° (Fig.7). The field intensity distribution is observed by placing a monitor or far-field calculation, and the deflection efficiency is calculated to reach 77%. In addition, the angle distribution of the outgoing light on the metasurface within the designed wavelength of ±30 nm is simulated, and it can be seen that the deflection angle of the device fluctuates within the designed angle of 5° (Fig.8). Since the same metasurface structure has a specific phase response to incident light at different angles, different wavefront adjustment of incident light at different angles can be realized. Waveguide with a cutting angle of 60° is adopted in the coupled part. By changing the incident light angle, the incident light can propagate in the waveguide at 50°-75°, and the variation range of the outgoing optical coupling angle is 0°-20°. There is a one-to-one correspondence between the angle change of the incident light and the angle change of the outgoing light (Fig.9). ConclusionsA metasurface coupling structure for AR near-eye display optical waveguide is designed. The metasurface structure can be deflected by changing the radius and height of the structure, and the wavefront of the incident light at different angles is controlled. The results show that the deflection efficiency of light at a small incident angle can be as high as 77%. By changing the total reflection angle of the incident light in the waveguide, the coupling angle changes with the change of the incident angle, and finally the field of view angle of 20° can be achieved. The introduction of metasurface provides an effective scheme for the design of AR near-eye display optical engine, which is of great significance for the realization of light-weight and compact eyeglass for a AR module, and is expected to become a potential development direction of AR near-eye display optical engine.
Jul. 25, 2023Vol. 52 Issue 7 20230342 (2023)
Bofu Xie, Shuai Zhang, Haoran Li, Hao Feng, Da Li, and Xing Zhao
ObjectiveWith the flourishing development of the applied optics, there are higher and higher requirements for the imaging quality of the optical system. With multiple design degrees of freedom, the freeform surface has excellent aberration compensation capability and is widely applied in the imaging system. Thus, it is very important to select a suitable design method and successfully design a freeform surface which can effectively compensate the aberrations. Considering the design requirement of compensating aberrations, it is very appropriate to choose the design methods guided by aberration theory. Nevertheless, the optimization and design method based on classical scalar aberration theory (SAT) may not give a good result because it is mainly applicable to rotational symmetric systems and there is aberration characterization error when the SAT method is used in a non-rotational symmetric system. What's different is that the nodal aberration theory (NAT) can accurately provide the relationship between wave aberration and various terms of Zernike type freeform surfaces. So, if adopting the optimization method guided by NAT, a freeform surface with better aberration compensation ability may be attained.MethodsFirstly, on the basis of the wavefront aberration distribution from Zernike type freeform given by NAT, combined with self-developed iterative solution algorithm, a freeform surface optimization and design method guided by NAT is introduced in this paper. Secondly, in order to investigate the NAT optimization method's effect, a decentered telescope system is built as an example and the proposed method is utilized to optimize the freeform surface to compensate the aberrations of the decentered telescope system. Moreover, the aberration compensation experiment for the decentered telescope system is conducted by SLM loading freeform surface phase maps. Finally, the simulation and experimental results demonstrate that the freeform surface optimized by NAT method has better aberration compensation ability compared with that optimized by SAT method.Results and DiscussionFirstly, after clarifying the aberration characteristics of the decentered telescope system (Fig.4), the aberration compensation freeform surfaces are optimized and designed by NAT method and SAT method respectively. The optimized result shows that the wavefront aberrations of this system reduce sharply (Fig.5). Compared to SAT optimization method's result, the residual aberration is significantly smaller by NAT optimization (Fig.5). Secondly, according to the simulation spot shape and RMS radius at the image surface, it is also found that the spot size of the system has smaller RMS radius optimized by NAT method (Fig.6). Then, the MTF curve indicates the optimized decentered telescope system by NAT method has better imaging quality after the aberration compensation freeform surface is introduced (Fig.7). Finally, by means of the SLM loading optimized freeform surfaces phase maps, the experiment on compensating the aberration of the decentered telescope system is carried out (Fig.8). The experimental results also demonstrate that the aberration of the system could be effectively compensated by freeform surface (Fig.10), and the surface optimized by NAT method has stronger aberration compensation ability. Thus, combined with simulation and experimental results, it is concluded that the NAT optimization method has better performance in optimizing freeform surfaces for aberration compensation and image quality improvement.ConclusionsAiming at the optimization and design of the aberration compensation freeform surface for the imaging system, a NAT optimization method is investigated in this paper. In order to explore this method's effect and compare with traditional SAT optimization method, these two methods are used to optimize the freeform surfaces for compensating the aberration of the decentered telescope system. More than that, an aberration compensation experiment for the decentered telescope is also carried out through SLM loading freeform surfaces phase maps, which could realize the same wavefront modulation effect as the freeform surfaces. Both simulation and experimental results show that better aberration compensation and imaging quality improvement effect can be achieved by using the NAT optimization method. Moreover, the proposed NAT optimization method also has great potentials in many applications, such as building individual optical model of human eye, evaluating visual quality of refractive surgery and optimizing the corneal removals for refractive surgeries, which are typical research issues in optometry.
Jul. 25, 2023Vol. 52 Issue 7 20230343 (2023)
Qingming Liao, and Zexin Feng
SignificanceBeam shaping plays an important role in many fields including laser material processing, medical treatment and laser fusion. The goal of beam shaping is to transform an incoming laser beam into a desired output irradiance (or intensity) distribution. Diffractive optical elements (DOEs) are one of the most promising ways for beam shaping. The design of DOEs plays a crucial role in high-quality beam shaping applications. To further promote the development of more advanced methods for designing DOEs which can better meet the requirements of different beam shaping applications, it is necessary to summarize the research progress of existing DOE design methods, discuss their advantages and disadvantages, and provide a necessary outlook.ProgressThis review summarizes the design methods of phase-only DOEs for beam shaping. Since the DOE microrelief height function is lineally proportional to the phase function of the optical field generated by the DOE, the DOE design problem can be directly transferred into the calculation of the DOE phase distribution. There are two design methods of geometrical optics methods and physical optics methods to realize this goal. Geometrical optics methods usually generate continuous freeform optical surfaces. However, in many cases, the beam shaping quality can be degraded due to the diffraction effects. Physical optics methods, which describe the light propagation in a more accurate way, are commonly used to design phase-only DOEs for beam shaping. However, the iterative Fourier transform algorithms (IFTAs), which are the most commonly-used approach for designing DOEs, often generate complex and irregular shapes in DOE profiles. Such DOE profiles are difficult to fabricate and could generate speckles, which significantly impair the quality of the generated irradiance distribution. In addition, traditional IFTAs often surfers from slow convergence and iteration stagnation. Composite methods that combine the geometrical and physical optics methods have been proposed to address these issues. The freeform surfaces generated from the geometrical optics methods could provide good initial values for the following IFTAs, significantly improving the convergence. The resulting optical surface profiles are more regular than those of the traditional IFTAs, which are easier to fabricate and could achieve high-quality beam shaping.Conclusions and ProspectsWe have summarized (some of) the design methods of DOEs for beam shaping. After a brief recall of the traditional physical optics methods and their limitations, we have paid more attention to the review of the composite methods which can generate freeform DOEs that are easier to fabricate and could achieve high-quality beam shaping. Future directions of the DOE design methods include developments of fast geometrical optics solvers and wide-angle light propagation algorithms, more considerations of different fabrication techniques, and other promising methods based on auto-differentiation.
Jul. 25, 2023Vol. 52 Issue 7 20230430 (2023)
Pu Zhou
SignificanceHigh power fiber laser is one of the hot topics in the laser field, and fast development and significant milestones have been achieved in China recently. Although there have been plenty of review papers of high power fiber laser published, most of them focus on the scientific achievements. It is to be noted that, the discipline construction, which includes (but not limits to) education and training, basic and applied research, academic communication, practical application and so on, lays the foundation for the field of high power fiber laser.ProgressThe development of discipline of high power fiber laser in China could be summarized into four stages. In the 1990s, the basic investigation on fiber laser was initiated. In the 2000s, high power fiber lasers based on double clad fiber dominates the field of high power fiber laser, and more than 1 kW output power was achieved by several independent groups. From 2010 to 2017, fast progress was made in the discipline of high power fiber laser, the layout of scientific research was optimized, and different research groups began to focus on key components, high performance fiber laser, fiber laser technology and system integration, respectively, and leading results in single frequency fiber laser, Raman fiber laser, fiber supercontinumm and coherent beam combining, were achieved. Since 2018, the discipline of high power fiber laser develops steadily, high power fiber laser with more than 20 kW output power and multimode fiber laser system with more than 100 kW were developed, which promotes the fast development of advanced manufacturing. However, there are still several challenges for the discipline of high power fiber laser in China. For example, as the most representative result of high power fiber laser, 10 kW single mode fiber laser was still under development, also, the performance lacks in the field of mid-infrared fiber laser and ultrafast fiber laser. In addition, it also lacks in original theoretical results such as transverse mode instability and multimode nonlinear fiber optics, the communication between the academic community and application community could be further enhanced.Conclusions and ProspectsDiscipline of high power fiber laser in China has been developed in a fast and stable way in the past few decades, from the current state that includes scientific research, education, academic communication and application. It is suggested that, cooperation in multidiscipline, education, training and course material, and high-quality communication could be enhanced to ensure further development.
Jul. 25, 2023Vol. 52 Issue 7 20230071 (2023)
Qingge Li, Xiaogang Yang, Ruitao Lu, Siyu Wang, Jiwei Fan, and Hai Xia
ObjectiveThe purpose of this research is to propose a cross-modal image geo-localization method based on GCI-CycleGAN style translation for vision-based autonomous visual geo-localization technology in aircraft. The technology is essential for navigation, guidance, situational awareness, and autonomous decision-making. However, existing cross-modal geo-localization tasks have issues such as significant modal differences, complex matching, and poor localization robustness. Therefore, real-time infrared images and visible images with known geo-location information are acquired with the proposed method, and a GCI-CycleGAN model is trained to convert visible images into infrared images using generative adversarial network image style translation. The generated infrared images are matched with real-time infrared images using various matching algorithms, and the position of the real-time infrared image center point in the generated image is obtained through perspective transformation. The positioning point is then mapped to the corresponding visible image to obtain the final geo-localization results. The research is crucial as it provides a solution to the challenges faced by existing cross-modal geo-localization tasks, improving the quality and robustness of geo-localization outcomes. A higher matching success rate and a more accurate average geo-localization error are achieved with the GCI-CycleGAN and DFM intelligent matching algorithms. The proposed method has significant practical implications for vision-based autonomous visual geo-localization technology in aircraft, which plays a crucial role in navigation and guidance, situational awareness, and autonomous decision-making.MethodsThe research describes a proposed method for cross-modal image geo-localization based on GCI-CycleGAN style translation (Fig.1). First, the real-time infrared and visible light images of the drone's direct down view aerial photography are obtained (Fig.10). The GCI-CycleGAN model structure (Fig.3) and the generated confrontation loss function were designed and trained on the RGB-NIR scene dataset (Fig.5). The trained GCI-CycleGAN model is utilized to perform style transfer on visible light images, resulting in more realistic pseudo infrared images (Fig.8). Using various matching algorithms, including SIFT, SURF, ORB, LoFTR (Fig.6), and DFM (Fig.7), the generated pseudo infrared image is matched with the real-time infrared image to obtain the feature point matching relationship (Fig.9). The homography transformation matrix is determined based on the matching relationship of feature points. Based on the homography transformation matrix, perspective transformation is performed on the center point of the real-time infrared image to determine the pixel points corresponding to the center point in the pseudo infrared image. Then the pixel points corresponding to the center point in the pseudo infrared image are mapped to the visible light image, and the mapping points in the visible light image are determined (Fig.11). Finally, based on the geographic location information corresponding to the mapping points in the visible light image, the geographic positioning results of the drone are obtained (Fig.12).Results and DiscussionsThe experiment results demonstrate that compared to CycleGAN, GCI-CycleGAN pays more attention to the expression of detailed texture features, generates infrared images without distortion, and is closer to the target infrared image in brightness and contrast, effectively improving the quality of image style translation (Tab.1). The combination of GCI-CycleGAN and DFM intelligent matching algorithm can achieve a matching success rate of up to 99.48%, 4.73% higher than the original cross-modal matching result, and the average geo-localization error is only 1.37 pixel, achieving more accurate and robust geo-localization outcome.ConclusionsThis article studies the geographic positioning problem of cross-modal image matching through style translation between infrared and visible light images captured by aircraft aerial photography. A cross-modal image intelligent matching method based on GCI-CycleGAN is proposed, which combines generative adversarial networks with matching algorithms to solve the geographic positioning problem based on visible light and infrared aerial image matching. First, a new loss function is designed to construct a GCI-CycleGAN model to transfer the style of visible images, and then LoFTR and DFM intelligent matching algorithms are used to achieve effective matching between the generated image and real-time infrared images. Finally, the matching relationship is mapped to the original cross-modal image pair to obtain the final geographical positioning result. The experimental results show that the proposed method effectively achieves cross-modal transformation of images and significantly improves the success rate of matching algorithms, demonstrating the value and significance of this geographic positioning method. In the future, how to deploy the proposed algorithm in embedded edge computing devices and balance cost, power consumption, and computing power to make the algorithm meet the effectiveness and real-time is a challenging problem in current practical engineering applications.
Jul. 25, 2023Vol. 52 Issue 7 20220875 (2023)
Minmin Song, Tao Lv, Xueyi Sang, Fenfen Xue, and Jianping Su
ObjectiveMost of the new generation of surface aircraft further use stealth, power control and other means to improve their penetration ability, and their infrared radiation energy has dropped significantly, bringing more and more challenges to shipborne air defense. The medium and long wave dual-band infrared detection method effectively utilizes the different characteristics of the target radiation in the two bands to enhance the detection ability of different radiation energy areas of the surface aircraft with low characteristics at the same time.MethodsThe infrared radiation model of an surface aircraft at different detection angles is established by using ray tracing and inverse Monte Carlo method, and the medium-long wave infrared radiation intensity of an surface aircraft at different detection angles is completed. Then, based on the calculation results of side-to-head radiation intensity, the differences of medium-long wave detection under special conditions such as rain and sea fog in the marine environment are compared and analyzed, and the medium-long wave detection data at different distances are obtained by means of the detection test of weak and small targets under the complex sea background in the actual outfield, and the equivalent temperature difference between the target and the sea background is statistically analyzed.Results and DiscussionsThe calculation results of medium and long wave infrared radiation intensity distribution of an surface aircraft at different detection angles are shown in Figure 5; The impact of sea haze, overcast rain and other weather on medium-long wave detection is shown in Figure 6 and Figure 7 respectively; The influence of sea clutter on medium and long wave detection is shown in Figure 8 and Table 2. Through the above work, the advantages and disadvantages of medium-wave and long-wave bands under different climate and sea background conditions are statistically analyzed, and the advantages of medium-wave and long-wave composite detection technology are fully verified.ConclusionsIn sunny weather and good visibility, long-wave detection has advantages in weak and small target recognition and anti-sea clutter interference. However, in case of sea fog, rainfall conditions and poor visibility, medium-wave detection is superior to long-wave detection. Therefore, it is necessary to use the medium-long wave composite detection method to learn from each other's strong points and compensate for the weak and small target recognition probability under various sea environment conditions.
Jul. 25, 2023Vol. 52 Issue 7 20220807 (2023)
Rong Lv, Qinglin Niu, and Shikui Dong
ObjectiveThe B-2-like aircraft is the only active strategic bomber with excellent stealth performance in the world, and its low detectability is attributed to its unique radar absorbing coating and small radar cross section. However, the high-temperature gas from the exhaust plume cannot be directly concealed and eliminated, becoming a potential main source of infrared radiation. For B-2-like aircraft, the infrared radiation may comes from the high-temperature components such as the engine's high-temperature plume, skin, and nozzle. The exhaust plume of an engine often contains components such as CO2, H2O, and CO, which can emit intense infrared radiation at specific wavelengths through vibrotational transitions at high temperatures. In addition, the skin subjected to aerodynamic heating will also emit a continuous spectrum that follows Planck's law. This paper numerically analyzes the infrared radiation characteristics of the B-2 like aircraft at different observation angles under a representative flight condition (12 km@0.8 Ma), including the spectrum, integrated radiances, and synthetic IR image. MethodsTaking the B-2-like aircraft as the research object (Fig.3), the flow and thermal characteristic parameters of the engine nozzle are calculated by using the segmental specific heat method in the ideal gas state. The Navier-Stokes equation is solved based on the FVM method to obtain the flow field. The skin temperature is calculated based on the radiation equilibrium wall condition. Based on the statistical narrow-band (SNB) model, the physical properties of radiating gases are calculated, and the radiation transport equation (RTE) is solved using the light-of-sight (LOS) method. The Cartesian coordinate system is used to describe the radiation distribution in observation angles in 2π space, and the observation angle is described by the zenith angle θ and the circumference φ (Fig.5). Results and DiscussionsThe high-temperature regions of the aircraft is mainly located near the handpiece, air intake, engine compartment lid, and nozzle, with the highest temperature approaching 250 K (Fig.7). A significant afterburning effect occurs within a certain range from the nozzle, resulting in an increase of the plume temperature to 540 K, and an increase of the mass fractions of H2O and CO2 to 0.045 and 0.025, respectively (Fig.8). The spectral intensity of the skin is the highest in the top view with a peak value of 596 W/(sr·μm). The peak spectral intensity in the bottom view is 78.2% of that in the top view. The peak spectral intensity in the side, front, and rear views is similar, which is 12.8% of that in the top view (Fig.9). In the top view, the total spectral radiation intensity of the target is nearly 3 orders of magnitude higher than that of the skin, and the spectral peak value is in bands of 2.7 μm, 4.3 μm and 5-8 μm (Fig.12). The integrated radiation intensities of skin in the MWIR and LWIR bands are 8.2 W/sr and 1.9×10³ W/sr, respectively (Fig.10-11), and the total radiation intensity of the target is 1×10³ W/sr and 2.01×10³ W/sr (Fig.13-14). The maximum radiation intensity of the plume of the B-2-like aircraft in the MWIR band is approximately 2 times that of the LWIR band and four times that of the 4.3 μm band. In particular, the radiation intensity in the MWIR band is nearly three orders of magnitude higher than that in the 2.7 μm band (Fig.16). ConclusionsThe radiation intensity of the B-2-like aircraft strongly depends on the wave band and observation angle, and the radiation intensity of the target is the strongest in the top view. The main sources of target radiation intensity in the MWIR band and the LWIR band are the exhaust plume and the aircraft body, respectively. This work can provide a theoretical reference for target characteristic identification of the B-2-like aircraft.
Jul. 25, 2023Vol. 52 Issue 7 20220810 (2023)
Haiyong Zhu, Junlin Chen, Zhijiang Zeng, Xiaokun Wang, Yaran Li, Xi Wang, and Xue Li
ObjectiveAs the main detection spectrum of infrared earth optical payload, infrared spectrum (8-12.5 μm) plays an important role in earth remote sensing. With the development of space imaging optical technology, the requirements for the detection performance of imaging satellites are constantly improving, and the imaging satellites are developing towards high resolution, high spatial resolution and wide radiation. For example, Venezuela’s Remote Sensing Satellite (VRSS) infrared camera, NASA's Advanced Spaceborne Thermal Emission and Reflection Radiometer (ASTER) infrared camera, etc. The infrared imager achieves a spatial resolution of 30 m and a width of 300 km by whiskbroom, which ensures high resolution and improves the imaging width. The influence of stray light on it is particularly prominent when the infrared remote sensing instrument with high resolution and large field of view extracts the remote sensing information of weak targets. If the suppression of stray light is insufficient, the energy distribution on the image plane is uneven, which leads to the decrease of signal-to-noise ratio and modulation transfer function (MTF), and the nonuniformity becomes worse. In severe cases, the detection signal of the detector is annihilated by stray light of background radiation, which results in the failure of the detector. Therefore, the design of stray light suppression for infrared imager is the premise to ensure its on-orbit imaging quality. The long-wave infrared Dewar module is an important part of the imager. Because the optical structure of the Dewar module is close to the detector, the detector is more sensitive to the optical structure, so the design of stray light suppression of the Dewar module is particularly important.MethodsIn view of the above requirements, this research analyzed four key surfaces of spurious radiation in opto-mechanical system, including lens, lens barrel, Dewar window and window cap, among which lens barrel was the main source of spurious radiation (Fig.2). Cryogenic optical design was adopted to reduce stray radiation, including 195 K lens, 180 K lens barrel, 200 K Dewar window cap and window design (Tab.2). In order to realize the low-temperature Dewar design, flexible bellows were introduced into the Dewar package structure to increase the thermal resistance between the refrigerator coupling surface and the window cap, and realize the thermal isolation between the 200 K low-temperature window cap and the 240 K expander (Fig.1). The effects of window, window shell, cold screen structure and surface treatment technology of Dewar module on stray light in Dewar were studied (Fig.6, Fig.8, Fig.9).Results and DiscussionsBased on the analysis above, the innovative results are as follows. (1) The flexible bellows were introduced into the Dewar package structure to increase the thermal resistance between the coupling surface of the refrigerator and the window cap, and the design of 200 K low temperature window and window cap was realized, and the radiation suppression in the optical machine was at a good level (Tab.2). After the measurement, the temperature gradient of cold end and hot end of bellows reached 37-48 K (Tab.1). (2) The cold screen adopted three-stage baffle design, and the filter was integrated in three bands. Considering the assembly and machining accuracy, the cold screen and the filter bracket were separated. The radiation suppression in the optical-mechanical system was at a good level (Fig.10-12, Tab.3).ConclusionsThe main objective is to reduce the radiation stray light of infrared remote sensing instrument with high resolution and large field of view. Reasonable low temperature design is beneficial to restrain the stray radiation of the module, and the flexible bellows shell insulation structure with 0.1 mm wall thickness is an effective means to realize the design of 200 K low temperature window and window cap. As the main source of optical-mechanical stray internal radiation, the influence of lens barrel on it should be considered when considering the processing and design of cold screen and window. This research provides theoretical and technical reference for the design and processing of low-temperature Dewar.
Jul. 25, 2023Vol. 52 Issue 7 20220823 (2023)
Yimei Tan, Shuo Zhang, Yuning Luo, Qun Hao, Menglu Chen, Yanfei Liu, and Xin Tang
ObjectiveMid-wave infrared imaging plays an important role in various fields including military reconnaissance, remote sensing, and aerospace. The existing mid-wave infrared focal planes mainly use bulk semiconductor materials such as mercury cadmium telluride, type-II superlattices, and indium antimonide, which have excellent performance and high stability. However, the complex material preparation and flip-chip bonding processes limit the production volume and their usage in cost-sensitive application. As an emerging infrared semiconductor material, colloidal quantum dots (CQDs) have the advantages of wide spectral tunability, large-scale synthesis, and low-cost preparation, providing a new route towards high-performance and low-cost infrared focal plane arrays. For this purpose, HgTe CQDs have been investigated and a mid-wave infrared focal plane array imager has been proposed in this paper.MethodsOleylamine was used as the reaction solvent for the synthesis of HgTe CQDs. Inorganic mercury salts and tellurium were dissolved in oleylamine and trioctylphosphine, respectively, at 100 ℃. After mixing them in an anhydrous and oxygen-free environment, the size of the HgTe CQDs can be precisely controlled by the reaction time, thus the response wavelength can be accurately adjusted. The transmission electron microscopy (TEM) image of the HgTe quantum dots used in this experiment is shown (Fig.1), with a diameter of about 8 nm. The response spectra of quantum dots at room temperature and 80 K are shown (Fig.2). The response cut-off wavelength of the quantum dot detector reaches 4.6 μm at 80 K. The HgTe CQDs mid-wave infrared detector uses a trapping-mode photodetector configuration. The device structure and energy band diagram are shown (Fig.3).Results and DiscussionsThe diagram of signal extraction and dewar test package is shown (Fig.4). The performance of the trapping-mode infrared focal plane detector is quantitatively analyzed by testing parameters including photoresponse non-uniformity, noise voltage, specific detectivity, and operable pixel rate. A calibrated blackbody is used as the excitation light source, and the temperature of the blackbody is stabilized with a feedback control circuit. The blackbody emitting cavity is about 4 cm in diameter and the distance between the imager and the emitting cavity is about 25 cm. The experimental results show that the non-uniformity of the photoresponse of the focal plane array device is as low as 3.42% (Fig.5(a)). The noise of the detector is an important indicator of performance, which is determined by the noise of the readout circuit itself and the uniformity of the film thickness of the detector pixel points. The overall noise of the detector is low, and the average noise voltage is as low as 0.66 mV at an integration time of 2 ms and a device bias of 2.3 V (Fig.5(b)). The distribution of the specific detectivity, and the average peak specific detectivity is about 2 × 10¹⁰ Jones (Fig.5(c)). The operable pixel rate can reach 99.99% (Fig.6). ConclusionsIn this paper, we report a CMOS-compatible trapping-mode HgTe CQDs mid-wave infrared focal plane and demonstrate the infrared thermal imaging capability. With a noise equivalent temperature difference of 51.26 mK (F#=2), a low photoresponse nonuniformity of 3.42%, an operable pixel rate of 99.99%, a response cutoff wavelength of 4.6 μm, and a peak specific detectivity of 2×10¹⁰ Jones at 80 K, the HgTe CQDs-based focal plane array is expected to potentially solve the bottlenecks faced by traditional bulk semiconductors. In the future, HgTe CQDs will be combined with 3D nanostructure embossing and other processing technologies to develop multi-functional and multi-mode infrared detectors.
Jul. 25, 2023Vol. 52 Issue 7 20230377 (2023)
Jin Peng, Hongqiao Xu, Yongbiao Wang, Xingxing Wang, Yongzhen Zhang, Weimin Long, and Dingyu Zhang
ObjectiveLaser beam has many advantages, such as good monochromaticity, high brightness, good directivity, etc. Laser technology in laser deep penetration welding process includes a series of complex physical processes, such as the absorption of laser energy by the base metal, the transmission of laser energy through the plasma in the keyhole wall, the change of thermophysical parameters of the base material, the flow behavior of liquid metal in the molten pool, the dynamic fluctuation of keyhole, and phase transformation (melting, solidification of molten pool). In the process of laser welding, when the temperature of the base material in the laser heat source area reaches the critical point of melting and vaporization, the vaporization of the metal produces very high steam pressure, which blows the liquid metal around, thus forming the keyhole. Under the action of recoil pressure, surface tension and other forces, the formed keyhole is always in the process of dynamic fluctuation, that is, the transient change of keyhole. During laser welding, keyhole fluctuates in real time. When the keyhole is closed, welding bubbles will be generated, and welding spatter will be generated on the surface of the molten pool during welding, which will have a great impact on the welding quality. In laser welding, the size of laser spot radius has a direct impact on laser power density, and different laser power density has an impact on the molten pool flow field and the three-dimensional shape of keyhole. However, there are few studies on the influence of laser spot size on the behavior of laser welding pool and keyhole.MethodsBased on the above analysis, the heat flow coupling model of laser welding was established based on Fluent software, the effects of laser spot size on the three-dimensional transient behavior of keyhole and the flow field of molten pool during laser welding were studied. The control equation adopted continuity control equation, momentum conservation equation and energy conservation equation. The source term was introduced into the momentum conservation equation and energy conservation equation. Material thermophysical parameters were introduced into the software, including solid density, liquid density, solidus temperature, liquidus line temperature, gas line temperature, latent heat of fusion, latent heat of vaporization, thermal expansion coefficient, heat transfer coefficient, surface tension gradient coefficient and other parameters.Results and DiscussionsWhen the light spot radius was 0.1 mm (Fig.2), welding spatter appeared in front of the keyhole wall, the bottom of the keyhole was closed, and the outer wall of the keyhole was convex at the middle of the keyhole rear wall and the middle and lower part of the keyhole front wall; When the light spot radius was 0.15 mm (Fig.3), the liquid metal behind the keyhole wall was separated from the liquid column to form welding spatter, and the liquid metal bulge appeared on the surface of the molten pool behind the keyhole wall, and the closure occured at the bottom of the keyhole. When the light spot radius was 0.2 mm (Fig.4), the keyhole was not closed, and the stability of the keyhole was improved.ConclusionsThe conclusion of the paper was as follows: (1) With the increase of the spot radius, the depth of the keyhole decreased significantly. When the light spot radius was 0.1 mm and 0.15 mm respectively, the bottom of the keyhole was closed during welding. When the light spot radius was 0.2 mm, the keyhole was closed, and the stability of the keyhole was improved. (2) With the increase of the spot radius, the fluctuation of the maximum flow velocity of the molten pool was relatively small. The average maximum flow velocity of molten pool with spot radius of 0.1 mm, 0.15 mm and 0.2 mm is 10.9 m/s, 10.3 m/s and 7.9 m/s respectively. (3) With the increase of the laser spot radius, the size of molten pool gradually increased, and the average length of molten pool with spot radius of 0.1 mm, 0.15 mm and 0.2 mm was 3.5 mm, 3.8 m and 4.1 mm, respectively.
Jul. 25, 2023Vol. 52 Issue 7 20220130 (2023)
Fahua Shen, Jingyuan Xu, Andong Fan, Chenbo Xie, Bangxin Wang, Liangliang Yang, Hui Zhou, and Hua Xu
ObjectiveDoppler lidar is one of the most powerful tools for the remote sensing of the three-dimensional wind field in the atmosphere at present. It is widely used in wind power generation, weather forecast, aviation safety, atmospheric science research and other fields. The traditional coherent detection or direct detection Doppler lidar requires a single-longitudinal-mode laser source with narrow linewidth, resulting in the shortcomings of the existing Doppler lidar system such as high cost, poor environmental adaptability, low laser energy utilization, which seriously restricts their industrialization and the airborne and spaceborne applications. Therefore, it is of great significance and scientific value to explore and study the technology of multi-longitudinal-mode (MLM) Doppler lidar using MLM laser as the emission source. For this purpose, the MLM Mie Doppler lidar technology based on dual Fabry-Perot interferometer (FPI) is proposed and studied.MethodsThe detection principle of MLM Mie Doppler lidar based on dual FPI is analyzed (Fig.1). The theoretical formulas of radial wind speed and backscatter ratio measurement errors are derived, and the matching relationship between the longitudinal mode interval of the MLM laser source and the free spectral spacing of the dual FPI is analyzed, as well as the wind speed measurement error caused by the mismatch between the two. The lidar system structure (Fig.7) and parameters (Tab.1) are designed, and the detection performance of the designed lidar system is simulated using the 1976 USA atmospheric model and simulated cumulus clouds.Results and DiscussionsThe frequency matching condition between the longitudinal mode interval of the MLM laser source and the free spectral spacing of the dual FPI is that the former is an integral multiple of the latter. When the frequency matching condition is satisfied, the MLM wind measurement is equivalent to the superposition of each single-longitudinal-mode (SLM) wind measurement. In the low wind speed region, the percentage of the wind speed measurement error EV caused by the frequency matching error increases rapidly with the increase of the matching error; When the frequency matching error remains unchanged, EV decreases slowly with the increase of wind speed; When the frequency matching error is less than 10 MHz, EV will be less than 5% (Fig.6). The simulation results of lidar detection performance show that, in the range of 0-10 km altitude and 0-50 m/s radial wind speed, when the range resolution is 30 m, the time resolution is 30 s and the zenith angle of laser emission is 30°, the radial wind speed measurement accuracy of the lidar system is better than 1.50 m/s and 1.02 m/s in daytime and nighttime respectively; Under cloudless conditions, the relative measurement accuracy of the backscatter ratio in daytime and nighttime is better than 6.57% and 4.53%, respectively (Fig.9). ConclusionsA Mie Doppler lidar technology based on multimode laser and dual FPI is proposed and studied. This technology requires that the longitudinal mode interval of the laser source should match the free spectral spacing of the dual FPI, and the center frequency of each longitudinal mode should be locked near the intersection of the dual FPI periodic spectrum curves. When the frequency matching condition is satisfied, the MLM wind measurement is equivalent to the superposition of each SLM wind measurement. The frequency matching error will increase the wind speed measurement error, but as long as the frequency matching error is controlled below 10 MHz, the impact of the matching error on the wind speed measurement accuracy is less than 5%, which can be easily achieved through system calibration. The simulation results show that the Doppler lidar system based on this technology has high detection accuracy of wind speed and backscatter ratio in all weather. These conclusions fully demonstrate the feasibility of this technology.
Jul. 25, 2023Vol. 52 Issue 7 20220762 (2023)
Xue Han, You Lv, Jianing Peng, Jiaxiang Guo, Yongling Hui, Zhanda Zhu, Hong Lei, and Qiang Li
ObjectiveThe 1.5 μm laser which has an excellent transparency in atmosphere and is in the eye safety wavelength region, has been widely used in range finders, LiDAR, optical communication, medicine and other fields. LD end-pumped Er3+/Yb3+ co-doped glass/crystal laser is an effective way to obtain 1.5 μm wavelength output micro laser because it meets the requirements of small volume, peak power, low cost and high efficiency. When using laser for ranging, the higher the laser repetition frequency is, the greater the single pulse energy is, the narrower the pulse width is, the faster the measurement speed is, the higher the accuracy is, and the farther the distance is. However, due to the low thermal conductivity of Er3+/Yb3+: glass and the increase of laser output energy and repetition frequency, the gain medium faces the prominent thermal effect problem, which makes it easier to reach the damage threshold of dielectric coating and glass, affecting the lifetime of the laser. For Lu2Si2O7 (LPS) crystal, its upper level fluorescence lifetime can be compared with that of glass, and its thermal conductivity is more than 10 times higher than that of the glass. It is an excellent gain medium for realizing 1.5 μm pulsed laser with large energy and high repetition frequency. At present, LPS crystal is mainly pumped continuously. Continuous pumping will cause heat accumulation inside the crystal and reduce the output energy and beam quality of laser output. In this paper, the pulse pumping mode and Er3+/Yb3+:LPS are used as the gain medium to achieve a 1.5 μm laser output with repetition frequency stabilized at 1 kHz and 10 kHz. MethodsIn this study, the factors that affect the output of LD end pumped passively Q-switched laser include crystal doping concentration and length, pump beam diameter, initial transmittance of saturable absorber and output coupling mirror (OC) transmittance. Under the theoretical simulation, the general optimization range of the above parameters was obtained, and the optimal parameters were obtained through the experiment. The optimal doping concentration of Yb3+ and length of Lu2Si2O7 crystal was obtained by comparing the free oscillating output power at different OC transmittance. In order to achieve the repetition frequency of 1 kHz and 10 kHz Q-switched pulse laser output, we used the control variable method to optimize the pump beam diameter, initial transmittance of saturable absorber and OC transmittance, and obtained the best experimental parameters by comparing the output frequency and single pulse energy. Results and DiscussionsThe results of free oscillating were shown (Fig.2(a)), the output power of 0.5at.%Er3+/4.0at.%Yb3+:LPS was always higher than 0.5at.%Er3+/5.0at.%Yb3+:LPS with the transmittance of the OCs changing from 4% to 30%. And when the length of medium increased, the output power of free oscillation also decreased. According to the experimental result, 2.85-mm-thick 0.5at.%Er3+/4.0at.%Yb3+:LPS was selected for passive Q-switched experiment. The slope efficiency of 2.85-mm-thick 0.5at.%Er3+/4.0at.%Yb3+:LPS was further studied. The optimal slope efficiency of 5.8% was obtained by optimizing the pump beam diameter and the transmittance of OCs (Fig.2(b)-(d)). In order to achieve the repetition frequency of 1 kHz and 10 kHz Q-switched pulse laser output, we compared the repetition frequency, energy, pulse width of three sets of control variable experiments, the results were shown (Tab.1-6). Finally, the laser output with repetition frequency of 1 kHz, single pulse energy of 35 μJ, pulse width of 7 ns, peak power of 5 kW and M2=1.33 was obtained when the pump beam diameter is 300 μm, the initial transmittance of Co2+:MgAl2O4 is 94.5% and transmittance of OC is 15%. And the laser output with repetition frequency of 10 kHz, single pulse energy of pulse energy of10 μJ, pulse width of 10 ns, peak power of 1 kW and M2=1.51 was obtained when the pump beam diameter is240 μm, initial transmittance of Co2+:MgAl2O4 is 98.6% and transmittance of OC is 10%. ConclusionsLD pulse end-pumped passively Q-switched 1537 nm laser with Er3+/Yb3+:Lu2Si2O7 crystal at 1 kHz and 10 kHz was reported. In this experiment, the doping concentration of LPS crystal was optimized by the free oscillation experiment and the 2.85-mm-thick 0.5at.%Er3+/4.0at.%Yb3+:LPS was selected for passive Q-switching experiment. Secondly, the Q-switching experiment was conducted to optimize the pump beam diameter, the initial transmittance of Co2+:MgAl2O4 and the transmittance of the output coupling mirror. Finally, the laser output with repetition frequency of 1 kHz, single pulse energy of 35 μJ, pulse width of 7 ns, peak power of 5 kW and M2=1.33 and repetition frequency of 10 kHz, single pulse energy of 10 μJ, pulse width of 10 ns, peak power of 1 kW and M2=1.51 were realized. The results show that Er3+/Yb3+:Lu2Si2O7 crystal is an excellent medium for 1.5 μm laser output with high repetition frequency.
Jul. 25, 2023Vol. 52 Issue 7 20220811 (2023)
Shuangchen Tian, Yujiao Li, Junyu Zhong, Luqie Li, and Shilin Wang
ObjectiveSpace triaxial laser gyro is a kind of space laser gyro which integrates three sensitive loops orthogonally on a glass-ceramic substrate. It has been widely used in aviation, aerospace, military and other fields. With the increasing requirement of military equipment for the long-term power-on stability of performance of high-precision laser gyro, improving the long-term power-on stability of performance of laser gyro and extending its working life have become an important topic for researchers in the field of laser gyro both at home and abroad. Foreign companies such as Litton, Honeywell, Thales, etc. had mentioned that Li+ on the glass-ceramic substrate migrated under the action of electric field, and in turn, it reduced the working life of laser gyro, but no specific research has been made. In order to improve the long-term power-on stability of performance of laser gyro and prolong its working life, Li+ migration on the surface of LAS (Li2O-Al2O3-SiO2) glass-ceramic in the discharge area was researched. MethodsThe accelerated power-on life test of space triaxial laser gyro was carried out, the intensity curves with the sputtering depth of Li+ in the glass-ceramic in the discharge and non-discharge area, mirrors, and the inner and outer surfaces of cathode of this laser gyro was tested with the time-of-flight secondary ion mass spectrometry (TOF-SIMS) analysis, the law of Li+ migration in the glass-ceramic and the resonator of space triaxial laser gyro was clarified. Meanwhile, the electric field of the laser gyro in the working state was modeled and simulated by COMSOL Multiphysics. Furthermore, the migration mechanism of Li+ in the glass-ceramic and the resonator was discussed. Results and DiscussionsThe color of the glass-ceramic surface in the discharge area of the test gyro was changed significantly (Fig.4). The intensity curves of major elements with the sputtering depth in the glass-ceramic in the discharge and non-discharge area, mirrors, and the inner and outer surfaces of the cathode was tested by means of TOF-SIMS. It was found that Li+ on the surface of the glass-ceramic in the discharge area had migrated into the resonator (Fig.6-7), and deposited on the inner surface of the cathode uniformly (Fig.8). Meanwhile, no significant Li+ deposition on the mirror which located in the discharge area, or even entered into the film (Fig.9). COMSOL Multiphysics was used to simulate the electric field distribution of the laser gyro under the working condition. The Li+ migration mechanism in the glass-ceramic was discussed combined with the simulation results. It showed that Li+ migrated to the surface of glass-ceramic and entered into the resonator under the action of electric field, which decreased the Li+ concentration and changed the refractive index of glass-ceramic. So it showed different light reflection characteristics from the surrounding area. Furthermore, since the electric field intensity in the mirror in the discharge area is relatively small, the flow path of the plasma in the resonator follows the principle of the shortest path, most of the plasma will not directly touch the mirror, Li+ mainly moves to the cathode with the plasma and deposits on the inner surface of the cathode, therefore no obvious Li+ was detected on the mirror. ConclusionsLi+ migrated into resonator under the action of the electric field and plasma of glass-ceramic in the discharge area of space triaxial laser gyroscope, and then flowed with the plasma, finally deposited on the inner surface of the cathode. This phenomenon may reduce the temperature-varying dimensional stability of glass-ceramic and the working life of cathode, and then decreased the long-term power-on performance stability of the laser gyro. Some measures and suggestions are proposed to suppress Li+ migration based on its migration law, the specific suppression methods of Li+ migration will be further studied.
Jul. 25, 2023Vol. 52 Issue 7 20220819 (2023)
Shizhen Wang, Jiayi Chen, Donghao Li, and Zhongxiao Xu
Jul. 25, 2023Vol. 52 Issue 7 20230128 (2023)
Wenbin Qi, Shuren Cong, Linwei Song, Pei Li, Xianyan Jiang, Jianyun Yu, Zhuo Ning, Wenbin Deng, and Jincheng Kong
SignificanceThe II-VI semiconductor material Hg1-xCdxTe (MCT) is widely used in the manufacture of infrared detectors due to its excellent infrared photoelectric properties at low temperatures. Liquid phase epitaxy (LPE) method is one of the most important techniques for the preparation of MCT materials because of its low cost and excellent process stability. However, due to the properties of MCT materials and the specific preparation technology, various defects will inevitably occur in the process of LPE growth, thus reducing the performance of infrared detectors. Therefore, it is necessary to study the types and causes of defects in detail and develop corresponding inhibition measures, so as to improve the growth technology of LPE and develop high-performance infrared detectors. ProgressAccording to the literature reports, the defects of MCT films grown by LPE method mainly include point defects, dislocation, surface defects, growth ripples and terracing. Point defects mainly include Hg vacancy and anti-site defect of Te (TeHg), and the defect concentration is closely related to mercury pressure and temperature (Fig.1), which can be effectively controlled by selecting appropriate annealing conditions. Dislocation defects mainly include mismatched dislocation and threading dislocation. Due to the lattice mismatch between substrate material and epitaxial material, i.e. lattice constants are not equal, the epitaxial layer will be grown under strain conditions, resulting in the generation of mismatches. Mismatch dislocations appear on the surface of the film in the form of Crosshatch and Mosaic (maximum mismatch) (Fig.4). At the same time, the surface roughness of the film will increase (Fig.6). By adjusting Zn components of substrate, a good lattice match between substrate and film can be achieved to improve the quality of film. The threading dislocations extend from the substrate and are formed during the substrate growth process, which is mainly related to the impurities in the melt, the properties of the crucible wall and the stoichiometric deviation of the melt components, and often occurs around the precipitations. This type of dislocation can be effectively controlled by optimizing substrate growth process and designing subsequent appropriate annealing process. Surface defects mainly include crater defects, hill-like defects and surface crystalline defects, etc. The crater defects are mainly related to the quality of the substrate, so it is necessary to reduce the size and density of the precipitations of the substrate and avoid the introduction of surface impurities (Fig.9). The hill-like defects are mainly related to substrate debris at the growth interface and the precipitation generated in the growth process (Fig.10), so it is necessary to optimize the quality of substrate, reduce edge breakage, and improve the uniformity of mother liquor. The surface crystalline defects are mainly related to the epitaxial growth process (Fig.11), so it is necessary to optimize the epitaxial growth process and improve the composition uniformity of mother liquor. The crystal direction deviation of substrate is the main cause of terracing defects, and the deviation angle should be controlled within 0.2° (Fig.12). However, the melt back process of substrate, epitaxial temperature field and other growth parameters may also affect the generation of terracing defects. The growth of surface ripple is mainly related to the convection of melt, so it is necessary to comprehensively optimize the epitaxial growth parameters including temperature field, undercooling degree during growth, growth rate and the melting process of substrate (Fig.13). Conclusions and ProspectsIn order to increase the understanding of defects in MCT films grown by LPE and provide guidance for mass production, the characteristics, formation mechanism and elimination methods of the defects were summarized based on the reported literatures. The formation mechanism and elimination methods of various defects were discussed and evaluated, which was expected to improve the quality of the MCT films grown by liquid-phase epitaxy, and provide technical support for manufacturing high-performance MCT detectors.
Jul. 25, 2023Vol. 52 Issue 7 20220804 (2023)
Shudi Liu, Haiying Tian, and Jianbing Shao
ObjectiveSpace-based target detection is the main way to observe space debris. In recent years, with the gradual increase of space debris, it is difficult for small field of view space cameras to meet the observation needs, and the use of large field of view space cameras is increasing. During the observation of space debris, due to the orbital motion of the satellite itself and the motion of the two-dimensional turntable, the image rotation will occur in the imaging of the large field of view space camera, especially when observing dim targets, the camera's exposure time will increase, and the generated image rotation will also increase. It seriously affects the accuracy of recognition and reduces the efficiency of large field of view space camera. Therefore, image rotation compensation must be carried out for large field of view space camera.MethodsIn order to determine the performance index of image rotation compensation, the imaging coordinate system of the system is established (Fig.1), and the image rotation of the system is calculated by the homogeneous coordinate change method. According to the performance index of image rotation compensation, a new type of image rotation compensation mechanism based on the inner and outer rings of symmetrical right straight circular flexure hinge is proposed (Fig.3). Then, the flexibility and accuracy formula of the flexible element of the image rotation compensation mechanism is deduced according to the second theorem of Cassegrain, and the relationship between the flexibility and the structure size is analyzed. Then, the image rotation compensation structure is optimized by genetic algorithm. Finally, the static and modal analysis of the image rotation compensation mechanism is carried out by simulation (Fig.11, 12, 14), and it is verified by experiments.Results and DiscussionsBy analyzing and calculating the ± 2′ image rotation of a large field of view space camera, an image rotation compensation mechanism composed of eight completely symmetrical flexible elements is designed for the image rotation change. By analyzing it, the relationship between the flexibility and accuracy of the flexible element and the size of the flexible element is obtained (Fig.7-8). Through genetic algorithm, the final design size of the flexible element is t=0.5 mm, r=5.5 mm, w=18 mm, l=9 mm. The simulation analysis results show that the maximum displacement component in the plane is 77.5 μm. The error with theoretical calculation model is 1.79%, far less than 5%, which meets the design requirements of the system; The maximum stress is 65 MPa, which is far less than the allowable stress of 330 MPa, which meets the design requirements of the system. The image rotation compensation mechanism has high stability and safety. Through experimental verification, the experimental value and theoretical error of the image rotation compensation mechanism are also less than 5%, and the image rotation compensation mechanism has good linearity in the working range (Fig.14). The results of modal analysis (Tab.3) show that all modes of the system meet the design requirements. ConclusionsFor the image rotation generated by the large field of view space camera during imaging, the image rotation angle generated by the camera is calculated by the homogeneous coordinate transformation method to be ± 2′, and then a set of image rotation compensation mechanism based on the flexible element is designed by this technical index, the mathematical model of the image rotation compensation mechanism is established, and the flexibility matrix and precision matrix of the flexible element of the image rotation compensation mechanism are derived; Then, according to the derived formula and the stress and fundamental frequency of the system, the image rotation compensation mechanism is optimized by genetic algorithm. Finally, the image rotation compensation mechanism is determined to be composed of the inner and outer rings connected by 8 straight beam fillet flexible elements. When the total force is 115 N, the camera is compensated with ± 2′ image rotation, and the maximum displacement of the inner ring is 77.5 μm. Then the first six natural frequencies of the system are verified by the finite element simulation, which meet the system design requirements, and the system is verified by experiments. According to the experimental results, the system has good linearity, and the error between the experimental results and the simulation results is less than 5%, which verifies the reliability of the system.
Jul. 25, 2023Vol. 52 Issue 7 20220878 (2023)
Simin Zhao, Naiting Gu, Linhai Huang, Yawei Xiao, Lanqiang Zhang, Yuntao Cheng, and Zongzheng Du
ObjectiveSolar telescopes are important equipment for conducting solar physics research and predicting space weather. During operation, large aperture solar telescope systems are affected by factors such as optical and mechanical structural deformation caused by solar radiation, gravitational deflection in different directions, wind-borne optical structural deformation, and environmental temperature changes, resulting in wavefront aberrations, leading to significant degradation in the imaging quality of the solar telescope system, and restricting the resolution of solar atmospheric imaging. Adaptive optical systems are the main means of correcting low spatio-temporal frequency aberrations during the operation of solar telescopes, but their correction of low-order aberrations wastes a large amount of travel and sacrifices their ability to correct high-order aberrations. Therefore, it is necessary to correct the low spatio-temporal frequency aberrations during the operation of the solar telescope without increasing the complexity of the solar telescope system.MethodsA simulation system and an experimental system have been established for the 60 cm POST solar telescope system. The sensitivity matrix of the displacement of the secondary mirror rigid body is calculated, and the low spatio-temporal frequency aberration is introduced using a deformable mirror to simulate low-order aberrations. The aberration of the optical system's field of view on the axis is observed using a Hartmann camera. The displacement of the secondary mirror rigid body required for correcting the aberration is calculated using the sensitivity matrix method. Finally, the introduced low spatio-temporal frequency aberration is corrected by adjusting the position of the secondary mirror rigid body. The results of the system fine assembly are shown (Fig.4).Results and DiscussionsThe low spatio-temporal frequency aberrations for simulated solar telescope systems are corrected, the ability of secondary mirror rigid body displacement is quantitatively analyzed to correct different types of low-order aberrations, and the principles for correcting low spatio-temporal frequency aberrations are provided. The simulation results are verified through experiments, where the RMS value of the aberration after correction for the position mismatch error of the secondary mirror pair is lower than 9% of the original value (Fig.9), the RMS value of the aberration after correction for the non-mismatch error is lower than 40% of the original value (Fig.10), and the RMS value of the aberration after correction for the multi-source mixing error is lower than 15% of the original value (Fig.11).ConclusionsA wavefront correction algorithm and implementation system for specific scenes have been constructed with adaptive optics. The real-time wavefront correction has been completed using a hexapod driven secondary mirror. The studies of correction for position mismatch error, non-mismatch error, and multi-source mixed error have been conducted, and multiple sets of experiments have been conducted. Without increasing the complexity of the optical system, the low spatio-temporal frequency aberration of the system has been reduced, and the imaging resolution of the solar telescope has been improved. The secondary mirror rigid body displacement correction method can reduce the low spatio-temporal frequency aberration during the operation of solar telescope systems without adding optical components, and has good development prospects and application value.
Jul. 25, 2023Vol. 52 Issue 7 20220887 (2023)
Peng Song, Yang Bai, Chao Yang, Chuang Li, Changxi Xue, Jiawen Ding, and Jie Guo
ObjectiveAs the core optical element of the off-axis optical system, the off-axis aspheric mirror has the function of reducing the volume of the optical system, increasing the field of view and improving the imaging quality. Aluminum alloy material is one of the commonly used materials for off-axis aspheric mirrors because of its high processing efficiency, low cost and the ability to realize the athermalized design of the optical systems. Due to the special application field of the off-axis optical system, the accuracy requirements of the off-axis aspheric surface are very strict. In the process of high-precision turning of large-diameter off-axis aspheric aluminum alloy mirrors, the micron-level surface shape error caused by centrifugal force becomes non-negligible. In order to reduce the surface shape error caused by centrifugal force deformation of off-axis aspheric aluminum alloy mirror during turning, it is necessary to study the single-point diamond turning process of off-axis aspheric aluminum alloy mirror.MethodsBased on the basic principle of centrifugal force generation, a machining method to suppress centrifugal force error is proposed (Fig.4). Through the finite element simulation method, the translation displacement and rotation angle of the centrifugal force coordinate transformation machining model are optimized. Taking an off-axis aspheric aluminum alloy mirror with an aperture of 320 mm as an example, the optimal coordinate transformation parameters are reflected in the optimization results (Fig.6), and the off-axis aspheric mirror is used for ultra-precision turning.Results and DiscussionsUsing the processing method of suppressing centrifugal force error, the off-axis aspheric surface of aluminum alloy with a diameter of 320 mm is processed by Nanoform 700 ultra diamond lathe, and the processing results are detected by Zygo interferometer. A high-precision off-axis aspheric aluminum alloy mirror with PV of 3.121λ and RMS of 0.198λ (Fig.8) is obtained. The machining method of surface suppression centrifugal force error can provide theoretical guidance for the ultra-precision machining of large-aperture off-axis aspheric aluminum alloy mirror, and provide theoretical support for the large-aperture turning of other materials. ConclusionsAiming at the problem that the surface shape accuracy of large-aperture off-axis aspheric mirror is deteriorated due to the centrifugal force error in single-point diamond turning process, a machining method to suppress centrifugal force deformation is proposed. According to the mechanism of centrifugal force generation, a machining model for suppressing centrifugal force coordinate transformation is established. The influence of different translation displacements and rotation angles on the surface shape accuracy in the process of coordinate transformation is analyzed and optimized by finite element simulation. Finally, the ultra-precision turning experiment of RSA6061 aluminum alloy off-axis aspheric mirror with an aperture of 320 mm is carried out by using the coordinate transformation parameters obtained by the simulation analysis, and a high-precision off-axis aspheric aluminum alloy mirror with RMS of 0.198λ is obtained. The proposed processing method of suppressing centrifugal force deformation realizes the ultra-precision machining of large-diameter off-axis aspheric aluminum alloy mirrors. While improving the surface shape accuracy of the off-axis aspheric aluminum alloy mirror, the limitation of the aperture, off-axis amount and vector height difference on the processing stroke in the manufacturing process of the off-axis aspheric aluminum alloy mirror is reduced, and the manufacturing accuracy of the aluminum alloy optical element is effectively improved.
Jul. 25, 2023Vol. 52 Issue 7 20220888 (2023)
Bo Yin, Changxi Xue, and Chuang Li
ObjectivePrecision glass molding technology is the primary technology for the mass production of high-precision glass-based optical components. The ultra-precision machining of mold plays an essential role in the performance and quality of glass molding products. Tungsten carbide alloy has become the first choice of precision glass molding materials because of its advantages of high hardness, high wear resistance, and high chemical stability. In order to improve the surface quality of tungsten carbide mold core during ultra-precision grinding, the influence of critical process parameters on surface roughness was studied.MethodsThe influence of process parameters on surface roughness was studied by combining simulation and experiment, and process optimization was carried out. First, based on the physical characteristics of WC-6%Co tungsten carbide alloy, a grinding process simulation model was established by using Abaqus to simulate the effects of grinding depth, feed speed, wheel speed, workpiece speed and other process parameters on the surface roughness of WC-6%Co tungsten carbide grinding. The reasonable process parameters of grinding tungsten carbide alloy were determined by simulation. Then, the Taguchi method was used to optimize the grinding process of tungsten carbide alloy. Finally, under the guidance of the optimal process, the experiment of tungsten carbide aspheric mold core ultra-precision grinding was completed.Results and DiscussionsThe simulation results show that the roughness increases relatively slowly when the grinding depth increases in the range of 1-1.8 μm; When the grinding depth increases in the range of 1.8-2.6 μm, the corresponding roughness growth rate is relatively large, and the reasonable grinding depth range is 1-1.8 μm (Fig.5); With the increase of the feed speed, the surface roughness decreases first and then increases. The reasonable selection range of the feed speed is 0.5 mm/min-1.5 mm/min (Fig.6); There is a nonlinear inverse relationship between surface roughness and grinding wheel speed, so a larger grinding wheel speed should be selected as far as possible (Fig.7); the surface roughness decreases first and then increases with the increase of workpiece rotation speed. The reasonable selection range of workpiece rotation speed is 100 rpm/min-300 rpm/min (Fig.8). The process optimization experiments were carried out according to the process parameter range selected by the simulation results. The experimental results show that the surface roughness increases with the grinding depth (Fig.10); The surface roughness decreases first and then increases with the increase of feed speed and workpiece speed. It is proved that the simulation results have the same variation trend as the experimental results.ConclusionsAiming at the ultra-precision grinding process of WC-6%Co tungsten carbide alloy, the finite element simulation analysis and process optimization experiment were carried out, in order to improve the surface quality of tungsten carbide mold core ultra-precision grinding. Abaqus was used to simulate the effects of grinding depth, feed speed, wheel speed, and workpiece speed on the surface roughness during grinding. The optimization experiments were carried out according to the process parameter range selected by the simulation results. The simulation results demonstrate that the surface roughness increases with the increase of grinding depth, decreases first and then increases with the increase of feed speed and workpiece speed, and decreases with the increase of grinding wheel speed. The analysis and comparison of simulation and experimental results show that reducing grinding depth, increasing grinding wheel speed, and selecting appropriate workpiece speed and feed speed are beneficial to control the surface roughness of tungsten carbide alloy after ultra-precision grinding. The optimum process parameters are as follows: grinding depth 1 μm, feed speed 1 mm/min, grinding wheel speed 40000 rpm/min, and workpiece speed 200 rpm/min. An aspheric core with an average surface roughness of 3.379 nm was obtained by ultra-precision grinding of an 11.8 mm diameter tungsten carbide alloy core with the optimum process parameters obtained by the optimization experiment.
Jul. 25, 2023Vol. 52 Issue 7 20220898 (2023)
Po Zhu, Zonghua Zhang, Nan Gao, Feng Gao, and Zhangying Wang
ObjectiveThe optical 3D (three-dimensional) topography measurement technology based on phase calculation mainly projects the coded fringe pattern to the surface of the object through the projector. The camera collects the deformed fringe of the object surface from another perspective, and then obtains the absolute phase information of the surface. The 3D topography of the object surface is obtained by calibrating system parameters. The technique requires uniform reflection on the object surface being measured. However, due to the different color and exposure degree on the surface of the highly reflective object, the reflection on the object surface is not uniform, Different modulation degree and different exposure degree appear on the stripes projected on the surface. The traditional fringe projection profilometry cannot carry out effective 3D measurement. In order to effectively use fringe projection technology to measure the 3D morphology of color highly reflective objects, a multi-channel preprocessing binary exposure time selection method has been proposed to measure the 3D morphology of color highly reflective objects.MethodsThis paper presents a new method to measure 3D morphology of color highly reflective objects. Firstly, histogram is used to quantify the light intensity information of pixel points, and the exposure time is preprocessed to determine a selection area of exposure time. In this exposure time domain, two dichotomies can be used to select the exposure time, and four groups of deformation fringe patterns with different exposure times are collected. The four groups of fringe images are collected for optimal pixel selection, and then the selected pixel points are integrated. The processing of overexposed pixel points can be realized through phase solution (Fig.2). Then the processed pixel information is selected in the three-color channel for optimal light intensity and color to generate the color fringe map. The optimal phase under each color channel is calculated, and the optimal phase within each color channel is fused, so as to obtain the absolute phase of the color highly reflective object surface. Finally, the calibration of the whole measuring system is completed, and the relationship between phase and depth can be determined by the calibration parameters to obtain 3D data of the object surface.Results and DiscussionsThe 3D morphologies of highly reflective color plate (Fig.5) and retro color ceramic cup (Fig.6) were measured by using the proposed measurement method. According to the 3D topography of the reconstructed object surface, it can be clearly seen that the proposed multi-channel preprocessing binary exposure time method can effectively measure the 3D topography of the color highly reflective object surface. Among them, the preprocessing method of binary selection of exposure time for image acquisition realizes that only four exposures can be used to solve the problem of high reflection on the surface of color highly reflective objects, and greatly reduces the number of groups of fringe images collected at different exposure times in the three-color channel. Then the fringe image is selected for the optimal light intensity and color in the three-color channel to solve the color problem of the highly reflective object surface. Finally, the dual problem that high reflection and color surface cannot be measured in 3D at the same time is solved. The experimental results show that the proposed method can solve the dual problems of different surface light absorption degree and local overexposure of high reflection color objects at the same time, which is a technical innovation in the field of fringe projection technology. The preprocessing method of binary exposure time selection reduces the number of fringe images, avoids the selection of exposure time for repeated effects, saves the measurement time, and effectively solves the problem of high reflection. The proposed method is applied to the three-color channel to solve the problem of 3D surface measurement of highly reflective objects.ConclusionsIn this paper, the problems related to the 3D topography measurement of color highly reflective objects are studied. By analyzing the problems of local overexposure and the different fringe-modulation of different color stripes in different color regions, a new method of multi-channel preprocessing and dichotomized exposure time has been proposed to measure the 3D morphology of color highly reflective objects. In addition, experiments on the 3D topography measurement of color highly reflective objects have been completed on a calibrated experimental system. The experimental results show that the proposed method can effectively measure the 3D topography of color highly reflective objects. This method fills the problem that the structured light fringe projection technique cannot measure color highly reflective objects effectively and expands the application range of structured light fringe projection technique.
Jul. 25, 2023Vol. 52 Issue 7 20220761 (2023)
Peng Qiu, Guocong Wang, Xiaoming Zhang, Mingxuan Zhang, Yong Zhao, Jianfeng Wang, and Xiaojun Jiang
ObjectiveIn addition to intensity and frequency characteristics, celestial radiation also possesses polarization characteristics. Photometry and spectrophotometry can provide information on the intensity and spectral characteristics, while photopolarimetry can provide information on the polarization characteristics. Polarimetric observations of astronomical objects are of great significance for studying gamma-ray bursts, quasars, and spatial targets. To carry out such research, it is necessary for the 2.16-m telescope (Fig.1) to have the capability of polarization photometry, which leads to the development of a polarimeter for the 2.16-m telescope.MethodsThe polarimeter adopts a dual-channel time-division linear polarization imaging detection method combining simultaneous and time-resolved imaging (Fig.4), which mainly consists of a polarization calibration unit, a polarization measurement unit, optical lenses, controllers, and cameras (Fig.5-6), enabling polarization calibration, polarization measurement, and multicolor photometry. The polarimeter uses a polarization beam splitter and two cameras for simultaneous imaging. The image acquisition process is completed by two steps. First, images are obtained simultaneously for the 0° and 90° polarization directions; Then, by adjusting the orientation of the half-wave plate, images are obtained simultaneously for the 45° and 135° transmission polarization directions. The working process of the polarimeter (Fig.8) includes the obtaining and processing of bias and flat images, initial angle calibration of the polarizer (Fig.9), polarization calibration (Fig.10), and polarization measurement (Fig.11).Results and DiscussionsFollowing the completion of instrument development, the polarimeter was installed on the 2.16-m telescope for on-sky testing. Following the working process of the polarimeter, a series of unpolarized standard stars were chosen for polarization calibration, and polarimetric measurement observations were conducted (Fig.15). Then, a series of polarization results for polarized standard stars were obtained (Tab.4, Fig.16). The results showed that the polarization measurement accuracy of the polarimeter was better than 0.01. By observing Landolt standard stars (Fig.17), the limiting magnitude result with a polarization measurement accuracy of 0.01 was obtained (Fig.18).ConclusionsThe polarimeter adopts a dual-channel time-division linear polarization imaging method and uses two cameras for simultaneous imaging, which allows for the acquisition of the linear polarization degree of an object for two times. The polarimeter has a polarization calibration unit, a polarization measurement unit, enabling polarization calibration, polarization measurement, and multi-color photometry. This paper provides the working process of the polarimeter, including initial angle calibration of the polarizer, polarization calibration, polarization measurement, and multi-color photometry. The paper also gives the processing method for calculating the polarization of targets. After the installation on the 2.16-m telescope, the polarimeter was tested with unpolarized standard stars for polarization calibration, followed by a series of polarized standard stars for testing. The data analysis showed that the polarimeter had a field of view of 4.63′× 4.63′ and a pixel scale of 0.54 (″)/pixel, and the polarization measurement accuracy was better than 0.01. A series of Landolt standard stars were also observed, and the data processing results showed that a 60 s exposure time is capable of capturing a 15.3 magnitude V-band target with a signal-to-noise ratio of 141. The polarimeter enables the 2.16-m telescope to perform V-band linear polarization photometry and multicolor photometry observations.
Jul. 25, 2023Vol. 52 Issue 7 20220830 (2023)
Huage Hei, Xiaoyan Li, Lufang Li, Ping Cai, and Fansheng Chen
ObjectiveAs space infrared technology advances towards high quantification, higher requirements are demanded for the precision of blackbody temperature control. Simultaneously, as spacecraft functionality becomes more complex, integrated design is necessary to reduce power consumption and weight. Traditional blackbody temperature control systems based on CPU or DSP are unable to meet the demands of high integration and high precision. To address this issue, this paper presents the design of a high-precision temperature control system for on-board blackbodies based on FPGA.MethodsTemperature acquisition and control are performed using an FPGA as the core control unit, enabling multifunctional high-speed parallel processing. The blackbody temperature measurement module adopts a three-wire Wheatstone bridge to minimize the influence of wire resistance. In the signal conditioning section, a three-stage active filtering and amplification, composed of integrated operational amplifiers, is employed to achieve low-noise amplification of the electrical output. Compared to traditional instrumentation amplifiers combined with passive filtering, this method exhibits stronger interference suppression capabilities. Additionally, to address the non-linear error between platinum resistor resistance and temperature, as well as circuit errors in the temperature measurement system, a hierarchical fitting correction method based on polynomial models and least squares theory is proposed to further improve temperature measurement accuracy. The temperature control module incorporates a novel fuzzy control and incremental PID (FIPID) combination to reduce overshoot, accelerate convergence speed, and achieve high-precision temperature control.Results and DiscussionsBased on the measurement results using precision standard resistors, the temperature measurement accuracy of the system within the range of 247-375 K is 0.035 K, which is a 90.9% improvement compared to the uncorrected accuracy of 0.383 K (Tab.4). Temperature control simulation experiments demonstrate that compared to PID control, the FIPID algorithm achieves zero overshoot, while the PID algorithm has a 12.4% overshoot. Furthermore, the FIPID algorithm exhibits a 64% improvement in convergence speed (Fig.6). Ground thermal vacuum and on-orbit temperature control experiments indicate that the measured temperature control accuracy within the range of 256-367 K is 0.039 K, with a steady-state deviation not exceeding 0.018 K, and a temperature rise stabilization time of less than 10 minutes for a 10 K increase (Tab.5-6).ConclusionsTraditional blackbody temperature control systems based on CPU or DSP cannot meet the requirements for high integration and high precision. To address this issue, this paper presents the design of a high-precision integrated temperature control system for on-board blackbodies based on FPGA. The approach uses a three-wire Wheatstone bridge to minimize the influence of wire resistance and introduces three-stage active filtering and amplification to improve the system's interference suppression capabilities. To mitigate temperature measurement errors, a hierarchical fitting correction method based on polynomial models and least squares theory is proposed. Additionally, a novel fuzzy control PID temperature control algorithm is introduced in the temperature control module to achieve high-precision temperature control. Experimental results demonstrate that the temperature measurement accuracy of the system is 0.035 K, which is a 90.9% improvement compared to the pre-optimized accuracy. Temperature control simulation experiments show that this method achieves a 64% improvement in convergence speed compared to traditional PID control, with zero overshoot, while the PID algorithm exhibits a 12.4% overshoot. Ground thermal vacuum and on-orbit temperature control experiments indicate that the measured temperature control accuracy within the range of 256-367 K is 0.039 K, meeting the requirements for on-orbit high-precision calibration and high integration. The system has been successfully applied to an on-orbit infrared camera of a specific model. The system possesses the advantages of high temperature measurement and control accuracy, wide dynamic range, and ease of integration, making it suitable for widespread application in other high-precision active temperature control systems in space.
Jul. 25, 2023Vol. 52 Issue 7 20220852 (2023)
Optical measurement method of shot noise limit micro-vibration based on optical polarization control
Kaikai Wu, Boya Xie, Lin Chen, Songqing You, Zhewen Xiong, and Peng Yang
ObjectiveThe measurement of micro-vibration signals of objects has important application value in magnetic field, construction, biological imaging and aerospace. However, the weak reflected light generated by the micro-vibration of the object is not only extremely weak, but also susceptible to interference from environmental factors such as detection distance and rain and fog. Moreover, the vibration form of low-frequency vibration is variable and susceptible to classical noise. It is difficult to achieve vibration signal measurement under extremely weak reflected light conditions. In view of the above problems, this paper realizes the measurement of micro-vibration signal in Hertz frequency band and weak reflected light based on polarization control.MethodsOptical polarization control method is used to control the polarization of signal light and local oscillator light to reduce the interference of optical noise. Balanced heterodyne detection is used to convert low-frequency DC signals into high-frequency AC signals to avoid signal annihilation by noise (Fig.1). The power spectral density (PSD) analysis of the photocurrent formula output by the balanced detector is carried out by MATLAB, and the relationship curve between the ratio of the noise power of the vibration signal to the power of the heterodyne signal and the vibration displacement is obtained (Fig.2). Then, the corresponding value is obtained according to the power spectrum of the vibration signal and the heterodyne signal in the Hertz frequency band measured by the experiment (Fig.9). Finally, the measured value of the micro-vibration displacement is obtained.Results and DiscussionsIn the Hertz frequency band, the noise level of the detector reaches the shot noise limit (Fig.7), and the micro-vibration signal measurement under the condition of Ava-level reflected light is realized. When the PZT load voltage is 1 Vpp, the optical power of the input signal light is 1.06 × 10¹⁸ W, the micro-vibration amplitude of the object is 11.44 nm, the class A standard uncertainty is 0.25 nm, the combined uncertainty is 0.34 nm, and the measurement accuracy is ± 0.75 nm (Tab.2). ConclusionsA balanced heterodyne detection method controlled by optical polarization is used to measure the shot noise limit of object micro-vibration signals in the frequency range of Hertz (~10 Hz). The minimum amplitude is 11.44 nm, the standard uncertainty of class A is 0.25 nm, the combined standard uncertainty is 0.34 nm, the measurement accuracy is ± 0.75 nm, and the noise level reaches the shot noise limit. This scheme not only provides experimental support for the research of weak Doppler frequency measurement, low frequency vibration signal detection and other measurement fields, but also has broad application prospects in complex measurement environments such as weak reflected light, long distance, rain and fog weather.
Jul. 25, 2023Vol. 52 Issue 7 20220872 (2023)
© Copyright 2018-2021 | Chinese Laser Press.
All Rights Reserved 沪ICP备15018463号-20