


 View fulltext
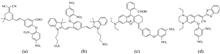
Jiang-tao SONG, Yue-hua YUAN, Yong-jun ZHU, Yu-zhen WANG, Mao-zhong TIAN, and Feng FENG
Hydrogen sulfide (H2S) is a colorless gas with the unpleasant smell of rotten eggs. It not only exists in the environment but was also considered the third important endogenous gaseous transmitter following nitric oxide (NO) and carbon monoxide (CO) in biological systems. H2S has recently attracted more attention for contributing to human health and disease. H2S has important biological functions and has been recognized as a cytoprotectant and gasotransmitter in many tissue types, including mediating vascular tone in blood vessels and neuromodulation in the brain. Hydrogen sulfide concentration has been demonstrated to be closely correlated with particular diseases in modern medical research, such as diabetes, Alzheimer's disease and Parkinson's disease. The molecular mechanisms by which H2S affects cell signaling and other physiological events remain unclear. Therefore, it is necessary to develop highly sensitive and selective methods for detecting the concentration of H2S in living cells and organisms. The near-infrared fluorescent probe for detecting H2S has been the research hotspot. Near-infrared (NIR) fluorescent probes have several significant advantages for imaging applications in vivo: negligible photodamage, deep tissue penetration, and low interference from background auto fluorescence. Many new methods for visualizing H2S in living systems have been reported. At the molecular level, H2S exhibits unique chemical characteristics, acting as a good reducing agent and a good nucleophile. Thus the main strategies used in NIR fluorescent probe development for H2S detection include azide and nitro group reduction, nucleophilic attack, addition reaction, etc. Herein, the design and synthesis, recognition mechanism, properties of NIR fluorescent probes for H2S and their fluorescence imaging in cells and organisms and the latest research progress reported in recent three years have been reviewed. Finally, in our opinion, the future research direction and development trend of this kind of probes are prospect.
Nov. 01, 2022Vol. 42 Issue 11 3321 (2022)
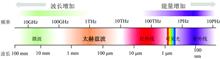
Xue-jing LU, Hong-yi GE, Yu-ying JIANG, and Yuan ZHANG
China is a big agricultural country, and ensuring food security is a strategic need for national development. The application and development of agricultural product detection are crucial for quality control and avoiding safety accidents caused by quality problems. Terahertz (THz) wave is located in the gap between the microwave and infrared regions of the electromagnetic spectrum, the frequency of which is higher than a microwave but lower than infrared and has low photon energy, good penetration, as well as can be used to characterize the molecular structure. The detection technology based on terahertz has been applied in bio-medicine, safety inspection and other fields and has been proved to be a reliable detection method. For agricultural products, the terahertz wave's unique untouched and label-free capability provides a method for composition analysis and quality control. Based on its penetration and non-destructive, the terahertz spectrum is also used to detect the internal ingredients without damaging agricultural products' surface and outer packaging. Compared with other spectral detection technologies(ultrasonic, X-ray, infrared, etc.), terahertz wave is in a wide frequency range with a good characteristic spectrum and can be used for rapid non-destructive detection. In recent years, with the development of THz sources, THz detectors, THz spectroscopy and imaging technology, the application of terahertz in agricultural products detection has further development. Through collecting and sorting out recent relevant information, this paper reviewed the new progress of terahertz technology in agricultural product detection, summarized the limitation of terahertz application, and discussed the future study direction of terahertz spectrum and imaging——improving sensitivity and accelerating detection speed are research focuses for industrialization application of terahertz detection technology. The metamaterial-based sensors are applied in the terahertz detection system to improve the detection sensitivity, which is of great significance to detecting pesticides, mycotoxins and other pollutants that harm the safety of agricultural products. The terahertz computational imaging technology based on single-pixel imaging and compressed sensing algorithm is a feasible solution to accelerate the detection speed in the rapid imaging detection of agricultural products. These researches provide direction for the subsequent development of terahertz technology and offer an important reference for the application promotion of agricultural products terahertz detection.
Nov. 01, 2022Vol. 42 Issue 11 3330 (2022)
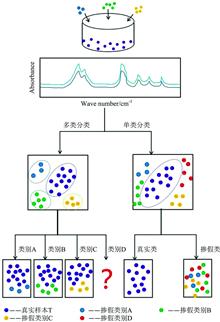
Yi-yun TANG, Rui LIU, Lu WANG, Hui-ying LÜ, Zhong-hai TANG, Hang XIAO, Shi-yin GUO, and Wei FAN
In recent years, counterfeit and substandard food products have become an increasing concern to consumers, and food authenticity assessment is a powerful tool to address this problem and protect public health. Under the high requirements of equipment and sample processing, modern detection technologies usually require a lot of time and money cost consumption. However, as food adulteration methods change and become more sophisticated, traditional modern food quality detection technologies have certain limitations. Therefore, it is necessary to seek new detection technology to effectively promote the efficiency and improvement of food safety quality control and provide strong scientific and technological support and protection for regulatory work-spectroscopic analysis technology, which has been used extensively in recent years for its simplicity and rapidity. As an indirect analysis technique, it needs to be combined with classification methods in data statistics to establish models and achieve rapid analysis requirements. Commonly used classification methods are ineffective in the face of the enormous variety of adulteration types in real life and the considerable variation in the number of true and false samples. One-class classification is a method that models and analyses only one class of instances, fixing the boundaries of the target sample class at a specific confidence level for classification and then using the edges of the target sample to predict the class of the new sample, distinguishing it from all other possible objects. Using this feature to effectively differentiate between samples that are different from the actual data, significantly reducing the detection effort, and has some potential for development in food adulteration detection applications. This paper reviewed the one-class classification method, which has been used in pattern recognition in recent years and described the need for spectral analysis combined with classification methods for food adulteration. The classification results of traditional -and one-class classification methods were compared in the same scenario, and the latter's characteristics were briefly introduced. Then, several common one-class classification methods were highlighted, such as data-driven class comparison soft independent modelling (DD-SIMCA), one-class partial least squares (OCPLS), and one-class support vector machines (OCSVM), and one-class random forests (OCRF). The applications of one-class classification methods in the food authenticity identification were also discussed, specifically in edible oils, dairy products, beverages, herbs, spices, and agricultural products. At last, the problems of the current one-class classification were analyzed, and the prospects for applying the technique were outlined. This paper is expected to provide some theoretical basis for food certification analysis.
Nov. 01, 2022Vol. 42 Issue 11 3336 (2022)
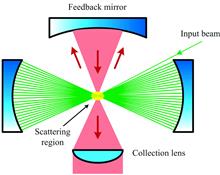
Fu WAN, Hu GE, Qiang LIU, Wei-ping KONG, Jian-xin WANG, and Wei-gen CHEN
Whether in scientific research, food safety, medical testing, or in the fields of safety accident prevention, fast, accurate, qualitative and quantitative analysis of multi-component mixed gases has become an urgent need. Raman spectroscopy is a powerful gas sensing method. It can overcome the shortcomings of traditional non-spectroscopic methods, such as long detection time and poor repeatability, and it can also make up for the shortcoming of absorption spectroscopy that cannot directly measure homonuclear diatomic molecules. A single-frequency laser can be used for qualitative and quantitative analysis of multi-component mixed gases. However, due to the inherently weak Raman effect of matter, and the Raman effect of the gas is generally much lower than that of solid and liquid, this greatly limits the wider application of Raman spectroscopy in gas sensing. Improving the scattering intensity of gas is key to making gas Raman sensing technology more widely used. Currently, the most important gas Raman sensing enhancement technology includes cavity enhancement technology and optical fiber enhancement technology. Cavity enhancement technology enhances the Raman scattering signal from the source by increasing the intensity and path of the excitation light that interacts with the gas to be measured, including multiple pass cavity enhancement, F-P cavity enhancement, and laser cavity enhancement. Fiber enhancement, including silver-plated capillary tube enhancement and hollow fiber enhancement, enhances the Raman scattering signal by improving the collection efficiency of spherical scattered light so that most of the Raman scattered light can enter the spectral detector. This paper briefly introduces the enhancement principles of the above two technologies, summarizes the research progress and application status, and discusses their advantages and limitations. Finally, focusing on detecting multi-component trace gases, it looks forward to the future development trend of gas Raman sensing technology. Although the current spectrum analysis method based on the absorption effect dominates the field of gas detection, especially photoacoustic spectroscopy, shortly, gas Raman sensing technology is expected to be more extensive and in-depth in the field of gas detection.
Nov. 01, 2022Vol. 42 Issue 11 3345 (2022)
Ming LI, Dong-hai HAN, Ding-qiang LU, Xiao-xiang LU, Chun-xiang CHAI, Wen LIU, and Ke-xuan SUN
China has a large population, and the demand for agricultural products and food is great and diverse. Moreover, the quality and safety of agricultural products and foods are closely related to people's daily life. Therefore, it is the development needs of contemporary society to use nondestructive, rapid, environmentally friendly and high-through put testing methods to detect the quality of agricultural products and foods. The traditional detection and analysis methods have some disadvantages, such as time and labor consumption, the tested samples cannot be sold again after testing and the defective products missing detection. As a rapid and nondestructive detection method, near-infrared spectroscopy (NIR) has been paid more and more attention by some scholars and related industry personnel. However, most NIR analysis methods only build mathematical models for single material. For a large number and variety of agricultural products and foods, such as different regions, different years, different temperatures, different processing methods, different components and even different varieties, this relatively traditional NIR analysis method will undoubtedly increase the workload of preliminary modeling. With the development of computer technology, spectrometer hardware, stoichiometry and internet technology, relevant scholars have begun researching and developing a universal NIR model to solve this problem. That is to establish a near-infrared universal model, which can detect the same index or multiple indexes of various materials. Compared with the traditional NIR model, the universal model has the advantages of low modeling cost and small workload, which makes the application and promotion of NIR spectroscopy technology in agricultural products and foods field of great significance. This paper reviews the research on the universal model of NIR in detecting agricultural products and foods. By comparing the traditional model modeling method with the universal model modeling method, the methods used in the three modeling steps of sample information acquisition, model establishment and sample information prediction in building the universal model are summarized. At the same time, the main points of modeling of NIR universal model in agricultural products and foods detection are summarized. Currently, the research of the NIR universal model in agricultural products and food quality detection is still in the development stage. In this paper, some suggestions on the development and research of the universal model are proposed, and the development trend of the NIR universal model in agricultural products and foods detection has further prospected.
Nov. 01, 2022Vol. 42 Issue 11 3355 (2022)

Cheng-wu CHEN, Tian-shu WANG, Kong-fa HU, Bei-hua BAO, Hui YAN, and Xi-chen YANG
Carbonized Typhae Pollen (CTP) is processed by Pollen Typhae. It has various effects such as hemostasis, removing blood stasis and treating stranguria. It has been widely used in clinical anti-thrombosis, wounds and bleeding. However, in the process of CTP, the carbonization is often too light or too heavy, resulting in different degrees of CTP, mainly for light carbonization, standard carbonization and heavy carbonization CTP. Due to the different degrees of carbonization, the coagulation effect of CTP is different. The standard CTP has the best effect. At present, the identification of CTP mainly relies on eyes and experience. The manual method is challenging to distinguish the standard CTP because it is inefficient, volitional, and unstable. Therefore, to effectively identify CTP with different degrees of carbonization, a near-infrared identification method based on Convolutional Neural Network (CNN) and the voting mechanism is proposed. This method innovatively combines deep learning and machine learning algorithms, effectively utilizes the powerful representation extraction ability of CNN, and applies voting decisions to improve the generalization ability and robustness of the prediction model. The near-infrared spectrum of CTP is firstly obtained. Then the high-order features of the spectrum processed by four different pre-processing methods are extracted by CNN. Next, the prediction results are calculated. The weights of four pre-processing methods are allocated according to the accuracy and loss to get the prediction model. Finally, the model combines the four prediction results with the weights to identify the CTP with different degrees of carbonization. The experimental results show that the proposed method can effectively distinguish the CTP with different degrees of carbonization. When the training set occupies 80%, the test accuracy is up to 95.4%. Compared with CNN, Linear Discriminant Analysis (LDA) and Standard Normal Variable (SNV)-LDA, the proposed method improves the prediction accuracy by 8.6%, 4.3% and 2.6%, respectively. At the same time, the proposed method is robust. When the proportion of the training set occupies more than 70%, the test accuracy is higher than 90%. When the proportion of the training set only occupies 10%, the prediction accuracy can still reach about 80%.
Nov. 01, 2022Vol. 42 Issue 11 3361 (2022)

Dong-sheng WANG, Hai-long WANG, Fang ZHANG, Lin-fang HAN, and Yun LI
The strength of sedimentary rocks is often affected by water, and the influence degree is different with different water content. Therefore, the measurement of the water content of the rock has important value for the subsequent evaluation of its physical and mechanical properties. In measuring rock water content, traditional methods are often time-consuming and laborious, destroying the integrity of the structure. At present, near-infrared spectroscopy is a very potential method, with real-time and nondestructive advantages. In this paper, sandstone's spectral characteristics and the water content prediction are studied based on near infrared spectroscopy. Firstly, near-infrared spectrum curves of sandstone samples with different saturations were obtained through laboratory tests. Secondly, the first derivative of the original spectral curve is preprocessed to eliminate the influence of noise, environment, and other factors. Thirdly, the spectral characteristic variables of R1 (1 400 nm) and R2 (1 900 nm) were extracted and normalized to eliminate the influence of dimension and domain value. Fourthly, the extracted spectral characteristic variables are analyzed and screened based on the maximum information coefficient; Finally, the self-built BP neural network classifier is used to predict the water content of sandstone. The conclusions are as follows: (1) The near-infrared absorption curve of water-bearing sandstone has obvious absorption peaks near 1 400 and 1 900 nm, the absorption peak is near 1400 nm, the band is relatively broad, the absorption peak is near 1 900 nm, and the band is relatively sharp. As the water content increases, the absorption intensity of each absorption peak is also increasing, which has an obvious correlation and can be used as the main spectrum band for sandstone water content analysis and prediction. (2) According to the calculated maximum information coefficient value, the peak height near 1 400 nm has the strongest correlation with water content, and the peak height near 1900 nm has the strongest correlation with water content. Peak area and peak height near 1 400 nm, peak area, peak height, half-height width, and right shoulder width near 1 900 nm are 6 characteristic variables. The maximal information coefficient value is greater than 0.9, which can be used as characteristic variable for BP neural network to predict sandstone water content. (3) Using the maximum information coefficient to screen out the characteristic variables of the two absorption peaks at 1 400 and 1 900 nm for BP neural network modeling, the accuracy of the training set of the sandstone water content prediction model established by it was 90.3%, and the accuracy of the test set was 83.9%. The method based on near-infrared spectroscopy analysis technology to predict the water content of sand and gravel is feasible.
Nov. 01, 2022Vol. 42 Issue 11 3368 (2022)
Yan-de LIU, Hui-zhen CUI, Bin LI, Guan-tian WANG, Zhen XU, and Mao-peng LI
When using near-infrared diffuse transmission technology to detect SSC of apple, the information of soluble solids in the collected apple spectrum is different due to the different positions of halogen lamp on apple, which will lead to the different performance of the model. Finding the best illumination position of apple is conducive to obtaining the best evaluation model of soluble solids. Using the multi-mode adjustable optical structure, the near-infrared diffuse transmission spectra of two batches of apples purchased from the same fruit wholesaler with similar size but different irradiation positions were collected under the same experimental environment and conditions. The best irradiation position in the process of establishing the apple soluble solid model was studied, and the evaluation model of the best position of soluble solid was obtained. The best modeling position is obtained by spectrum collection, true sugar degree value collection and chemometrics method. When the irradiation position is the upper part and the spectrum is not pretreated, the PLS(Partial Least Square) model performance is RMSEC 0.288 2, RMSEP 0.343 6, Rc 0.960 6 and Rp 0.934 9. The performance of the PLS model with oblique upper irradiation position and no spectral pretreatment is RMSEC 0.340 7, RMSEP 0.513 3, Rc 0.931 1 and Rp 0.863 6. The performance of the PCR (Principle Component Regression) model with upper irradiation position and no spectral pretreatment was RMSEC 0.573 6, RMSEP 0.601 4, Rc 0.842 4 and Rp 0.800 7. The performance of the PCR model with oblique upper irradiation position and no spectral pretreatment was RMSEC 0.709 2, RMSEP 0.797 4, Rc 0.701 4, Rp 0.670 7. The best irradiation position is the upper part of the apple; Further, a variety of pretreatment methods are used to compare the PLS model with the upper irradiation position. The optimal model is the MSC-PLS model. Its model performance is RMSEC 0.226 44, RMSEP 0.301 5, Rc 0.966 9 and Rp 0.949 9. Finally, after the same experimental operation is carried out on the same 46 apples, the spectra and true values are obtained and substituted into the established MSC-PLS (Multiplicative Scatter Correction-Partial Least Square) model for external verification. The results show that the correlation coefficient of external verification is 0.930 58, and the root mean square error of verification is 0.843 59, which verifies the stability and reliability of the established MSC-PLS model. It further shows that the near-infrared diffuse projection model has good prediction ability when the spectral acquisition position is the upper part of the apple. This paper provides technical support for predicting the detection of soluble solids in the apple.
Nov. 01, 2022Vol. 42 Issue 11 3373 (2022)
Chao-nan SHANG, Yan-li XIE, Xiao GAO, Xue-qing ZHOU, Zhen-dong ZHAO, Jia-xin MA, Peng CUI, Xiao-xiao WEI, Yu-hong FENG, and Ming-nan ZHANG
A law on the one-time use of plastics was carried out as one measure of protecting the ecological environment in Hainan Province of China. The Hainan Forbidden Plastic List (first batch) is regulated to prohibit six non-degradable plastic compositions. The polyethylene (PE) and ethylene-vinyl acetate copolymer (EVA) were selected as detection targets in this simulating illicit-adding system. Poly(butylene adipate-co-terephthalate (PBAT) and polylactic acid (PLA) were chosen as the blend portions of simulating composites for their extensive application in bio-degradable plastics products. Then PE was blended with PBAT and PLA, respectively, according to the different mass percentages. Moreover, EVA was also blended with PBAT and PLA with the same formula, respectively. These simulating samples were provided for qualitative and quantitative testing of PE and EVA by Fourier transform infrared spectroscopy (FTIR) and cluster analysis (CLA). Their spectra screened the qualitative characteristic peaks by peak shape and wavenumbers. Furthermore, the characteristic quantitative peaks were screened for the correlation of peak-high ratios and the content of the non-degradable plastic components. Their quantitative curves were obtained and used for blind verification. The results showed that the mixture can be divided into three categories by applying all original spectral data in a chemometric method within 4 000 to 400 cm-1 and the parameter of the classification model are A=14, R2X(cum)=0.997, Q2(cum)=0.992. The qualitative characteristic peaks of the PE-PBAT and EVA-PBAT systems were 2 918 and 2 850 cm-1, while the characteristic quantitative peaks were 2 918, 2 850, 1 714 and 727 cm-1. The characteristic qualitative peaks of the EVA-PLA system were 2 918, 2 850, 1 237 and 718 cm-1, and the characteristic quantitative peaks were 2 918, 2 850 and 1 740 cm-1. For the PE-PLA system, the characteristic qualitative peaks were 2 918, 2 850 and 718 cm-1, and the characteristic quantitative peaks were 2 918, 2 850 and 1 747 cm-1.Otherwise, the 1 460 cm-1 band intensity could be used to assist in quantification that was not related to component distribution. The qualitative classification results of ATR-FTIR were consistent with principal component analysis (PCA) classification. Furthermore, the quantitative models were established by the Spectrum Quant software. Peak-high ratios and non-degradable components had a great a high correlation. The peak-high ratio of 2 918/727 and PE or EVA content had high correlation in PBAT-base blend material. The peak-high ratio of 2 918/1 740 was determined as the dependence of the EVA content in the EVA-PBAT material. The peak-high ratio of 2 918/1 460 was defined as the dependence of the PE content in the PE-PLA material. The blind verification results indicated that the inaccuracy is within ±2.7%. Therefore, the FTIR technology showed good reliability in the qualitative and quantitative analysis of prohibited non-degradable plastic components, which could provide a scientific basis for identifying of non-biodegradable materials.
Nov. 01, 2022Vol. 42 Issue 11 3380 (2022)
Xiang-cheng KAN, Guang-qiang XIE, Yao-xiang LI, Li-hai WANG, Yi-na LI, Jun-ming XIE, and Xu TANG
To accomplish the near-infrared spectroscopy detection of wood moisture content under an unstable temperature environment, the change law of wood near-infrared spectroscopy under different temperatures and the influence of temperature changes on the near-infrared prediction of wood moisture content were explored. Using 75 pieces of log samples of Pinus sylvestris, Fraxinus mandshurica, Populus sylvestris, and Korean pine logs collected from the forest farm, a total of 300 pieces of samples were used to conduct near-infrared spectroscopy under different temperature and moisture content conditions. The correction set at a single temperature was used to establish a partial least squares moisture content prediction model with the verification set at each temperature. The influence of temperature changes on the prediction accuracy of the wood moisture content model was explored. The global models of wood moisture content prediction temperature based on different spectral pretreatments are compared. Collect infrared spectroscopy data at different temperatures under the same moisture content, and perform spectral averaging, differential observation, principal component analysis, and partial least square discriminant analysis on the spectra to explore the law of wood near-infrared spectroscopy changes with temperature. The results show: (1) Temperature significantly affects the spectrum of wood samples. Principal component analysis and discriminant analysis show that samples at different temperatures have a clear clustering trend, and the accuracy of temperature discrimination is 96.1%. The temperature will affect the position and absorbance of the absorption peak at a specific wavelength in the near-infrared spectrum of wood. With the same moisture content, as the temperature increases, the absorption peak at a specific location tends to-shift to the high-frequency band gradually and is at a sub-zero temperature when the peak movement changes more obviously. (2) The PLS moisture content prediction model at different temperatures has different adaptability to temperature changes. The wood moisture content prediction model is more suitable for detecting samples at the same temperature as the modeling sample. Compared with the single temperature model, the PLS temperature global model has good adaptability and application potential for temperature changes, and the RMSEP is best at 0.082. The PLS water content temperature global model based on SG smoothing + multivariate scattering correction + first-order derivative preprocessing has a better prediction effect and temperature adaptability, and the RMSEP is reduced to 0.088. It can be seen that temperature variation is a disturbance factor that cannot be ignored in detecting wood moisture content by the near-infrared method. The global temperature model based on spectral pretreatment can significantly improve the temperature applicability. This research can further promote the application of near-infrared spectroscopy technology in wood production and processing.
Nov. 01, 2022Vol. 42 Issue 11 3387 (2022)
Zhe-yu ZHANG, Yao-xiang LI, Zhi-yuan WANG, and Chun-xu LI
Wood density is an important physical property of wood which can reflect a variety of physical properties such as wood shrinkage, compressive and tensile strength. Using near-infrared spectroscopy technology can rapidly predict wood density, which can overcome the disadvantages of traditional detection methods that consume workforce, material resources and time. However, the modeling results are often affected by abnormal samples. In order to accurately identify and eliminate abnormal samples in the sample set, an isolation forest combined with the studentized residual method (IFSR) was proposed. Based on the advantages of integrated features of isolated forests, the influence of samples on the model is considered, and abnormal samples and strong influence samples can be detected simultaneously. This study measured the near-infrared spectra of 181 larch wood samples and their air-dry density at room temperature. By comparing a variety of preprocessing and feature selection methods, the preprocessing method was determined to adopt the standard normal variable change (SNV) + detrending processing (DT) + mean centralization (MC) + standardization (Auto) method and the feature wavelength selection was determined to adopt competitive adaptive reweighted sampling (CARS) method. Eliminated the influence of noise and irrelevant information on the algorithm, simplified the dataset, and improved the algorithm's accuracy in removing abnormal samples. In order to verify the ability of the IFSR method to eliminate abnormal samples, it was compared with the other six anomaly detection methods such as Monte Carlo Interactive Verification (MCCV), Mahalanobis Distance (MD), etc. The partial least squares (PLS) model was established to evaluate its anomaly detection performance. At the same time, the particle swarm optimization-support vector machine regression (PSO-SVR), BP neural network (BPNN) and PLS were used to establish the near-infrared prediction model of larch wood density. The results show that the optimized model obtained by IFSR combined with PSO-SVR has the strongest predictive ability, and IFSR can effectively eliminate singular samples and improve the model's accuracy.
Nov. 01, 2022Vol. 42 Issue 11 3395 (2022)
Jia-min CHEN, Bo-yan LI, Yun HU, Jin ZHANG, Rui-min WANG, and Xiao-hong SUN
Rosa roxburghii Tratt. (RRT) is a perennial deciduous shrub of Rosa genus in Rosaceae. Its fruit has specific nutritional and medicinal values due to a variety of bioactive ingredients present in a substantial amount. This study used NIR, UV-Vis and fluorescence spectroscopies to characterize the chemical composites of the RRT fruit extracts in 301 batches from different planting origins. Meanwhile, the distribution characteristics of the contents of total phenols (TPC), total flavonoids (TFC), and total triterpenoids (TTC) in the extracts were not only discussed, but also the antioxidant activities concerning free radical scavenging capacity and ferric reducing antioxidant power, concerning the DPPH, ABTS and FRAP assays. Results showed high TPC, TFC and TTC in RRT fruit, as were 9.23~37.45, 8.80~27.96 and 6.91~22.62 mg·g-1 FW, respectively, which possibly led to a pretty good free radical scavenging capacity and reducing power. The scavenging rate of DPPH ranged between 14.39%~83.19%, the scavenging rate of ABTS was 18.50%~68.45%, and FRAP varied in 0.08~0.44 mmol·L-1 TE·g-1 FW. The statistical analysis indicated that all the individual TPC, TFC, TTC, DPPH, ABTS, and FRAP values from 301 batches were normally distributed. The samples used in the study might be pooled from the population and thus diverse, representative, and random. There was no significant statistical difference in the contents of active composites and antioxidant activities of the extracts regardless of the planting origins. All the UV-Vis-NIR and fluorescence spectra had characteristic bands. The resultant principal discriminant variate (PDV) models were able to identify the samples from eight planting origins from each other. When combined with the PDV models the UV-Vis, NIR and fluorescence spectroscopies could be used for compositional characterization, rapid detection and discrimination of the extracts. This work provided a new idea for the quality evaluation, strain selection and resource development of RRT, among other medicinal-edible plants. However, it was neither reliable at all through testing the contents of active constituents and antioxidant activities of RRT samples to determine the compositional information of plant extracts, nor possible for the origin traceability purpose.
Nov. 01, 2022Vol. 42 Issue 11 3403 (2022)
Dan-yang FAN, Xue-cheng ZHANG, Jun GAO, Jia-bin WANG, and Hai-xia LÜ
Due to the strong biological penetration, large stoke shift, good photostability and biocompatibility, up-conversion nanoparticles (UCNPs) were widely used in biomedical analysis. In this study, OA-UCNPs, which are UCNPs with oleic acid (OA) as ligand, were modified by polyacrylic acid (PAA)in order to prepare hydrophilic nanoparticles PAA-UCNPs, and then aptamers (Apt) were covalently coupled to the surface of PAA-UCNPs by amidation reaction to obtain Apt-UCNPs. A method for specific detection of sulfadimethoxine (SDM)was constructed by using Apt-UCNPs as energy donors and black hole quencher (BHQ1) as an energy acceptor fluorescence resonance energy transfer. The structure and performance of UCNPs, PAA and PAA-UCNPs were characterized by infrared spectroscopy (FTIR) and scanning electron microscope (SEM). The results of FTIRshowed that compared with UCNPs, PAA-UCNPs appeared at a new peak at 1 722 cm-1 which was attributed to the -C=O stretching vibration peak of PAA, and the wide band around 3 400 cm-1 attributed to the O—H stretching vibration of PAA; the results of the SEM test indicated that the size of UCNPs and PAA-UCNPs was 31 and 49 nm, respectively. It may be because the molecular volume of long-chain PAA is larger than that of oleic acid, so coating on the surface of UCNPs will increase its size, and the above results indicated PAA may have had been modified to the surface of UCNPs. The structure and properties of Apt-UCNPs, Apt and PAA-UCNPs, were characterized by ultraviolet-visible spectroscopy. It was found that compared with PAA-UCNPs, Apt-UCNPs had a more obvious Apt characteristic absorption peak at 260 nm, which showed that the aptamer could have been modified to the surface of UCNPs. In addition, the mechanism of using Apt-UCNPs to detect SDM was also discussed. The results showed that the emission peak of Apt-UCNPs at 540 nm overlapped with the absorption peak of BHQ1, which indicated that the energy on Apt-UCNPs can be transferred to BHQ1 through the fluorescence resonance energy transfer effect so that the fluorescence of Apt-UCNPs could be quenched. The concentration of BHQ1 in the detection system was optimized and the results showed that when the concentration of BHQ1 was 15 μmol·L-1, the fluorescence quenching efficiency was as high as 55%. Under the best experimental conditions, there was a good linear relationship between the relative fluorescence intensity and the SDM concentration (150~1 000 ng·mL-1).The analogues of SDM (sulfapyridine and sulfacetamide)were selected as control experiments. It was found that although the concentration of sulfapyridine and sulfacetamide reached 500 ng·mL-1, the fluorescence intensity recovery in the system was less, which indicated that the detection method could specifically recognize SDM.
Nov. 01, 2022Vol. 42 Issue 11 3409 (2022)
Pan-pan ZHU, Xiao-tao NIU, Xue WANG, Xin SI, Qing-gang XIE, Bo CHEN, Shi-long JIANG, Ning JU, Shu-wen ZHANG, and Jia-ping LÜ
Liquid cheese stored at room temperature, which can remain stable at room temperature for 3~6 months, is a kind of processed cheese. After high-temperature treatment, the number of microorganisms in the liquid cheese system reaches the commercial aseptic level because the liquid cheese is an unstable emulsion system with oil in water. During the storage at room temperature, due to the migration of dispersed phase particles and the change of particle size, the emulsion system is prone to instability, such as aggregation, flocculation, oil slick and precipitation. It affects the product's quality and shortens the product's shelf life. Therefore, it is important to accurately judge the stability of liquid cheese to optimize its processing conditions. However, the stability evaluation of traditional liquid dairy products is mainly through accelerating the visual observation of stratification and precipitation, dynamic light scattering, and the lack of fast, reliable and quantitative evaluation standards. When testing fluid stability, Turbiscan multiple light technologies does not need to pretreatment the sample. It can detect the intensity of backscattered light and transmitted light in real-time, calculate the migration rate of particles inside the system, the thickness of the precipitation layer, and the instability index of the system, so it is an effective method to evaluate the stability of the fluid. The parameters such as the migration rate of particles in the system, the thickness of the precipitation layer and the instability index of the system are calculated, so it is an effective means to evaluate the stability of the fluid. Turbiscan multiple light scattering technique was used to evaluate the effect of emulsified salt, emulsifier, stabilizer and sweetener on the stability of room temperature liquid cheese. At the same time, according to the response value of TSI and sensory score, the optimum formulation conditions of room temperature liquid cheese were optimized by the Box-Behnken experimental design model of response surface method, and the main factors leading to the instability of room temperature liquid cheese were analyzed. It was found that when the amount of emulsified salt was 0.20%, 0.40%, 0.60%, 0.80%, the instability index increased from 0.4 to 12.6 after 24 hours; when the amount of emulsifier was 0.80%, 1.0%, the instability index increased from 0.95 to 3.9 after 24 hours. When the amount of stabilizer was 0.7% and 0.9%, the instability index increased from 0.9 to 1.3 after 24 hours, but the effect of sweetener on the overall stability of the system was insignificant. The influence order of various factors on the instability index and sensory score of room temperature liquid cheese is emulsified salt (A) > emulsifier (B) > stabilizer (C). When emulsified salt was added to 0.60%, emulsifier was 0.60%, stabilizer was 0.70%, and sweetener was 5.5%, the product quality was the best and the stability was the highest. Under the optimized conditions, the overall instability index of the sample at 37 ℃ for 24 hours was 0.80, the variation of backscattered light intensity at the top and bottom of the sample was 0.66 and 0.78 respectively, and the sensory score was 89.The results show that the problem of delamination of room temperature liquid cheese can be well solved, and the stability of room temperature liquid cheese can be improved by adjusting the emulsified salt, emulsifier and stabilizer.
Nov. 01, 2022Vol. 42 Issue 11 3415 (2022)
Qing-bo LI, Zhi-qi BI, Hou-xin CUI, Jia-ye LANG, and Zhong-kai SHEN
Total organic carbon is an index to evaluate the organic pollution of water quality based on carbon content, which can reflect the degree of water pollution. Currently, the detection of total organic carbon in surface water mostly adopts the laboratory analysis method after field sampling. This method has the disadvantages of being time-consuming and laborious, complex operation, secondary chemical pollution, etc. UV-Vis spectroscopy has the advantages of environmental protection, simple operation and real-time on-line in-situ detection. It has a good application prospect in detecting total organic carbon in surface water. The interval partial least squares regression method based on the adaboost algorithm (Ada-iPLSR) is adopted. In this method, the total organic carbon absorption spectrum band is divided into several sub-intervals. The training sample weight is initialized. The partial least squares regression model is established in each sub-interval in turn, the weight coefficient of the prediction result of the sub-interval is calculated according to the prediction error rate of the sub-interval model, and the training sample weight of the next sub-interval is updated. Finally, the prediction results of each sub-interval model are linearly weighted to obtain the detection results of total organic carbon.43 total organic carbon standard solution samples concentrations of 25~150 mg·L-1 were prepared in the experiment. 35 total organic carbon standard samples were collected in the first period, and the spectra were divided into training and test sets. The total organic carbon detection algorithm model was established and verified. In order to evaluate the robustness of the algorithm model, the spectra of the remaining 8 standard samples were collected in another period for test verification. The experimental results show that the total organic carbon quantitative model established by Ada-iPLSR has high accuracy and robustness. The root means square errors of group verification and test verification are 1.304 and 1.533 mg·L-1 respectively, which are better than partial least squares regression and Extreme Learning Machine methods. In order to further verify the effectiveness of this method, this modeling method is used to predict the total organic carbon content of domestic sewage. The actual surface water samples were taken from the sewage at the sewage outlet of Gaocheng sewage treatment plant in Shijiazhuang, Hebei and the domestic sewage in the park of Hebei Xianhe company. After dilution, 50 surface water samples were obtained. SPXY method was used to divide them into 33 water samples in the training set and 17 water samples in the test set. In the actual water sample detection, the net signal analysis method is used for spectral pretreatment to reduce the interference of other substances in surface water on the detection of total organic carbon. The root means square error of group verification prediction is 3.26 mg·L-1, and the average absolute value percentage error is 3.46%. To sum up, the Ada-iPLSR method can quickly and accurately detect the total organic carbon in surface water, providing a method support for the on-line detection of total organic carbon in water quality.
Nov. 01, 2022Vol. 42 Issue 11 3423 (2022)
Ai-guo OUYANG, Bin YU, Jun HU, Tong-zheng LIN, and Yan-de LIU
China's high-speed railroads run long distances and have variable service environments, requiring high wheels performance. The grain size of the wheel directly affects the mechanical properties of the wheel, and the characteristics and measurement of the grain have an important role in materials science, so in order to ensure the safe operation of high-speed trains, it is necessary to test the grain size level of high-speed railway wheels. The laser-induced breakdown spectroscopy (LIBS) experimental platform was used to obtain the spectral information of five ER8 high-speed train wheel samples with different grain size grades (different grain size grades obtained after different heat treatments) by breakdown and the correlation between the intensity of the base element Fe and alloying elements (Cr, Mo, Co) and the five samples with different grain size grades was compared. Partial least squares-discriminant analysis (PLS-DA) models with the spectral line intensity as the variable were developed using this relationship, and standard normal variate transformation (SNV), multiplicative scatter correction (MSC). Savitzky-Golay convolutional smoothing methods were used to pre-process the models, respectively. The models were preprocessed by Standard normal variate transformation (SNV), Multiplicative scatter correction (MSC), Savitzky-Golay convolutional smoothing methods. By comparing various preprocessing methods, it is concluded that the effect of the model established after SNV preprocessing is the best. The number of misjudgments in the modeling set is 4, and the accuracy rate is 95.7%. The number of misjudgments in the prediction set is 3, and the accuracy rate is 90%.Based on the SNV preprocessing method, three-wavelength screening methods, competitive adaptive reweighted sampling (CARS), continuous projections algorithm (SPA), and CARS-SPA are selected for wavelength screening, and the model effects based on different characteristic wavelengths are compared. The results show that the model established after band screening with CARS has the best effect. The number of misjudgments in the modeling set is 2, and the accuracy is 97.9%. The number of misjudgments in the prediction set is 1, and the accuracy is 96.7%. The accuracy of the model is higher than 90%. Samples with different grain size grades can be classified. By comprehensively analyzing the results of the above discriminant analysis models, it is found that the PLS-DA model combined with SNV pretreatment and CARS band screening has the highest accuracy. The study shows that it is feasible to use laser-induced breakdown spectroscopy combined with partial least squares discrimination to analyze the grain size class of high-speed railway wheels, which can be used to evaluate the surface grain size class of wheels. Moreover, it provides a certain basis for applying LIBS technology to studying high-speed railway wheels with different grain size classes.
Nov. 01, 2022Vol. 42 Issue 11 3428 (2022)
Hong-wei DUAN, Mei GUO, Rong-guang ZHU, and Qi-jian NIU
Agricultural biomass energy has gradually become one of the main clean energy sources in modern industry in China. Laser-induced breakdown spectroscopy (LIBS) was used to accurately evaluate the calorific value (CV) of straw charcoal in this paper. Due to the defects of the traditional X-independent variable feature extraction method in LIBS quantitative analysis of CV, an XY bivariate feature extraction method is proposed. Firstly, the correlation between CV and main elemental content was analyzed, and the Y-type sensitive variables with extremely significant correlation (pX-type sensitive variables related to CV were obtained by screening the regression coefficient threshold of the partial least squares regression (PLSR) model. When the threshold is 4×10⁻⁵, the cross-validation root means square error (RMSECV) decreases to the lowest value, and its corresponding variables are the analytical line spectra of Ca, Cr, Mg and K that can participate in crop growth. The GA-BP-Adaboost model was then developed based on the XY double characteristic variables extracted. When the mutation probability, crossover probability and relative error rate (RE) are set to 0.1, 0.95 and 0.01 respectively, the average relative error (AREP) and relative standard deviation (RSDP) of the optimal model are 2.39% and 2.97% respectively, which is 0.82% and 0.91% lower than that of XY-PLSR model. The results show that the XY bivariate feature extraction method combined with the GA-BP-Adaboost model can be used to accurately and quantitatively predict the CV of biomass carbon in the industrial process.
Nov. 01, 2022Vol. 42 Issue 11 3435 (2022)
Ping MA, Hsitien Shen Andy, Heng LUO, and Yuan ZHONG
Myanmar is the main commercial jadeite origin, Guatemala, Russia also have jadeite output. The value of jadeite from different origins varies greatly, and jadeite from other origins is impersonated as Burmese jadeite to get higher prices. Urgently need to be a reliable method to determine the geographic origin, the study of jadeite origin is of great significance in gemology. At present, jadeite from the different origins is mainly discussed in terms of jadeite generation age, mineral assemblage and jadeite component content, In this paper, jadeite from Myanmar, Russia and Guatemala is taken as the research object, lack of quick and effective ways to identify places of origins. The laser Raman spectroscopy of jadeite samples from different origins shows that the minerals of Jadeite from Myanmar are jadeite, chlorite and tremolite. The minerals of Guatemalan jadeite are relatively complex, including jadeite, omphacite, chlorite, titanite, uranite. The minerals of Russian jadeite are jadeite, albite and omphacite. By comparing the Raman characteristics of jadeite minerals from different origins, it is found that typical jadeite spectral characteristics show at 1 037, 988, 697, 372 and 201 cm-1. At 1 020, 679, 369 and 216 cm-1, it shows the characteristic Raman displacement peaks of chlorite, and there are obvious tremolite absorption peaks at 215, 332, 394, 680 and 1 073 cm-1. tremolite is a secondary mineral in jadeite. Jadeite minerals from Guatemala are superimposed with Raman peaks of 680 and 218 cm-1, which is the peak value of the omphacite feature, and also contain the Raman peaks of chlorite feature near 603, 537 and 306 cm-1. The results indicate that jadeite minerals from Guatemala are mostly replaced by Fe, Mg and Ca elements, forming jadeite-chlorite solid solution minerals. Raman spectral peaks of chlorite are detected on the surface of jadeite minerals, at 603, 537 and 306, and chlorite alteration occurs on the surface of jadeite minerals. Russian Raman peaks of jadeite are superimposed with albitite Raman peak, at 1 100, 507, 473 and 164 cm-1 . Jadeite minerals in Russia are commonly metasomatized by albite Gray-green reticulated veins are distributed on the surface, and Raman peaks of 1 025, 669, 366 and 219 cm-1 are shown.
Nov. 01, 2022Vol. 42 Issue 11 3441 (2022)
Wang-jun JIN, Yan LI, Yue ZHAO, and Sheng-hua MEI
With the rapid development of social economy, the problem of energy shortage is becoming more and more prominent in the world. At present, the development and utilization of renewable energy has been listed as the priority area of energy development in China. Algae plants contain abundant biomass energy, and have advantages such as high photosynthetic efficiency, strong carbon fixation capacity, fast growth rate, and wide distribution of sources, which is recognized as the development direction of sustainable green and clean energy. Glycine is an important derivative product in the process of algal hydrothermal liquefaction. The thermomechanical properties of glycine during liquefaction are the basic elements to understand and optimize the technology of algal hydrothermal liquefaction. The study of glycine hydrothermal liquefaction process can lay a foundation for the analysis of complex biomass hydrothermal liquefaction reaction. In this study, based on the high temperature and high pressure visible reactor of fused silicon capillary reactor (FSCR), combined with Linkam FTIR600 temperature control platform and Andor laser Raman spectrometer, the liquefaction process of glycine aqueous solution at 270~290 ℃ (pressures approximate to the saturated vapor pressure of water at ambient temperatures) was studied in situ by Raman spectroscopy. The effects of temperature and reaction time on the thermal decomposition of functional groups of glycine solution were analyzed by observing the relative Raman intensity changes of C—C stretching vibration peak (897 cm-1), C—N stretching vibration peak (1 031 cm-1) and C—O—O antisymmetric peak (1 413 cm-1) during liquefaction. The activation energy, 357 kJ·mol-1, and reaction rate constant k at different temperatures were obtained by using Avrami kinetic model. The thermodynamic properties of glycine liquefaction process were quantitatively determined. It is found that within the same liquefaction reaction time (10 min), when the temperature is lower than 290 ℃, the ν(C—C), ν(C—N), νas(COO-) characteristic peak of glycine aqueous solution can be observed in the reaction chamber after cooling, but not when the temperature is higher than 290 ℃, indicating that the complete liquefaction temperature of glycine is about 290 ℃. The present study, based on the high-temperature and high-pressure visualization technology combined with in-situ Raman spectroscopy analyses, reveals the variation of the Raman peak intensities of characteristic functional groups of glycine at different temperatures during the hydrothermal liquefaction and provides deep insights into the pathway of hydrothermal liquefaction of algae. It is of great scientific and practical significance to understand the mechanism of algal hydrothermal liquefaction and promote the development and utilization of biomass energy.
Nov. 01, 2022Vol. 42 Issue 11 3448 (2022)
Li WANG, Shi-fang GAO, Lu-ping MENG, Liang SHANG, Meng SHI, and Guang-qiang LIU
In this paper, the preparation of an optical fiber surface-enhanced Raman scattering (SERS) probe by laser-induced deposition was studied, and the SERS performance of the probe was tested. The effect of the concentration of gold nanorod solution on the sensitivity of the optical fiber probe was discussed. The results show that two kinds of nanostructures——gold nanorod clusters and gold nanorod dispersion can be formed on the optical fiber facet by laser induction of gold nanorods with different concentrations. The induced deposition pattern is affected by the factors such as the concentration of gold nanorod solution, laser power and induction time. Induced by a laser with a power of 5 mw, SERS probes with different patterns were prepared in 1.5×10⁻⁹, 1.0×10⁻⁹ and 7.5×10⁻¹⁰ mol·L-1 gold nanorods solution after 5 min deposition. Synthesized by the crystal seed method, the morphology of gold nanorods was observed by transmission electron microscope (TEM). Moreover, the length-to-diameter ratio of the synthesized gold nanorods was about 3.8 according to TEM image analysis. The morphology of gold nanorods and fiber-modified ends after laser-induced deposition was observed with a scanning electron microscope (SEM). The distribution of gold nanorods on the fiber end surface was relatively dispersed in 7.5×10⁻¹⁰ mol·L-1 gold nanorod solution by laser induction, while induced by laser in 1.5×10⁻⁹ and 1.0×10⁻⁹ mol·L-1 gold nanorods solution, a large number of gold nanorods clustered at the end of the optical fiber. It is taking 4-Aminothiophenol (4-ATP) as the sample molecule, and the SERS performance of the optical fiber probe was detected by Raman spectrometer. In order to facilitate comparison, the Raman intensity at the Raman shift of 1 079.972 cm-1 was selected for mapping. The results showed that the laser-induced fiber probe performs better at a gold nanorod concentration of 7.5×10⁻¹⁰ mol·L-1. The pattern's hot spot distribution was simulated by the FDTD (finite-difference time-domain) method, which further explained the better performance of the laser induced fiber probe prepared at the concentration of 7.5×10⁻¹⁰ mol·L-1 gold nanorods. To test the repeatability of the fiber probe, after the SERS spectrum was tested, the fiber was immersed in anhydrous ethanol for 24 hours to make 4-ATP fully dissolved in alcohol. 15 days later, the SERS detection performance of optical fiber probes was detected again, and the same spectrogram was obtained as that detected before, which proved that the obtained optical fiber SERS probes had strong reusability. The laser-induced preparation of fiber probes can realize the repeated and batch preparation of SERS probes with high sensitivity with simple operation, low cost, short preparation time and so on.
Nov. 01, 2022Vol. 42 Issue 11 3454 (2022)
Jiang-xiong LONG, Yu-jun ZHANG, Li SHAO, Qing YE, Ying HE, Kun YOU, and Xiao-quan SUN
In the context of carbon neutrality, reliable and accurate quantification of atmospheric greenhouse gas is of great importance. Thus, it is necessary to develop gas analyzers which can provide analytes amount-of-substance fraction results traceable to the international system of units (SI). Tunable diode laser absorption spectroscopy (TDLAS) is a common way to measure gas concentration. According to Beer-Lambert Law, one of the necessary conditions to realize the direct traceability of the measured concentration of the instrument to the SI is the directly traceable gas cell optical path length (OPL). The gas cell OPL directly affects the measurement uncertainty of the gas concentration. Accurate measurement is conducive to developing gas analyzers whose measurement results can be directly traced.In this paper, the directly traceable measurement of a gas cell OPL with three reflection points is carried out. The direct measurement result obtained by measuring three parts of the optical path of the gas cell using a calibrated meter is 81.21±0.80 cm. The large measurement uncertainty (0.80 cm) is a careful consideration, estimated considering positioning error and the measurement error caused by the possible misalignment of the three optical paths and the measurement path. In order to reduce the OPL measurement uncertainty, a TDLAS gas cell OPL measurement system is built in this paper. A 1 576 nm distributed feedback laser with a ramp sweep voltage loading on the laser controller is used to measure the absorption spectrum of standard high-purity carbon dioxide (CO2, 99.999%) in the gas cell to be measured near 6 344.68 cm-1. A traceable pressure and temperature sensors are used to measure the pressure and gas temperature in the gas cell. The key parameter of line strength of the P 4e branch of CO2 at 30012-00001 transition band, which has relative uncertainty of 0.15%, is from theNational Institute of Standards and Technology. A quadratic speed-dependent Voigt line profile is used to fitting the acquired absorbance at various pressure from 36 to 75 Torr. The uncertainty and the transfer process of various input parameters are comprehensively analyzed. A generalized linear regression (GLR) is applied to absorbance data with uncertainty at various pressure. The slope from the GLR yield the optical path length of the gas cell L= 81.61±0.42 cm with a standard uncertainty of 0.51%.This uncertainty range falls within one of the direct measurement results. The optical path structure of the gas cell used in this paper is a simplified multi-reflection gas cell with long OPL. The system can be equally applied to the traceable measurement for OPL of the multi-reflection gas cell.
Nov. 01, 2022Vol. 42 Issue 11 3461 (2022)
Feng LI, Jing-jing LIN, Jie YUN, Shuai ZHANG, He WANG, Hai ZHANG, and Zong-ming TAO
Atmospheric aerosols can affect the earth's clouds and water cycle through sunlight scattering and absorption effects and can also reduce the visibility of cities, leading to frequent haze processes. They are also rich in various chemical substances and can enter the human body and cause harm to human health. This paper analyzes the spatiotemporal variation characteristics of particulate matter in different air pollution processes using the vertical profile data of multiple aerosol lidars and regional air quality monitoring data from 2018 to 2019 in Jining City. The results show that there are certain regional differences in fine particle pollution in Jining City during the summer, and there are mainly two diurnal characteristics. One is that some areas have strong extinction at night and weak extinction in the daytime, mainly because they are affected by the superposition of high humidity and pollution source emissions at night. On the other hand, some areas have relatively strong daytime extinction and no obvious diurnal variation, which is due to less pollution sources and artificial lakes. Moreover, the near-surface aerosol extinction coefficient variation showed that the concentration of particulate matter near Chenxin Pharmaceutical Station and Jinma Hotel Station was relatively higher. Dust observation results show that the dust weather in Jining city mainly occurs in April and May, and the concentration of particulate matter in the sedimentation process can be as high as 5 times the normal concentration. Additionally, the contrast scanning observation shows that the profile of local pollution is irregular, small in scope, burst and strong in extinction, while the profile of large-scale pollution process is extensive in area, and its extinction gradually increases.
Nov. 01, 2022Vol. 42 Issue 11 3467 (2022)
Research on the Fluorescence Spectra Characteristics of Abamectin Technical and Preparation Solution
Kang-ting YAN, Yi-fang HAN, Lin-lin WANG, Fan DING, Yu-bin LAN, and Ya-li ZHANG
Excessive use of abamectin in agricultural production causes excessive crop pesticide residues. This study used a JASCO FP8300 fluorescence spectrophotometer to detect abamectin pesticide solution.The fluorescence spectrum characteristics of the abamectin technical solution and preparation solution were analyzed to provide a data reference basis for the rapid detection of abamectin. The experiment first analyzed the three-dimensional fluorescence spectra of the technical solution and two preparation solutions from different manufacturers. It is determined that the fluorescence characteristic peak area belonging to the abamectin is Ex=250~ 290 nm, Em=280~320 nm, and the best excitation wavelength is 270 nm. Therefore, 270 nm was selected as the best excitation band for two-dimensional fluorescence spectrum detection. According to the two-dimensional spectral data, the fluorescence intensity of abamectin fluorescence characteristic peak was analyzed with the change of solution concentration, and the prediction model of them was obtained by fitting relevant data. According to the results of data analysis, theR2 of the prediction model of abamectin technical solution was 0.999, and the root means square error (RMSE) of the prediction results was 0.359 mg·L-1 in the concentration range of 10~35 mg·L-1. Besides, theR2 of the abamectin preparation solution prediction model produced by two different manufacturers within the concentration range of 10~35 mg·L-1 were 0.935 and 0.985. Moreover, the root means square error (RMSE) of the predicted results were 1.945 and 0.858 mg·L-1. The results showed that the fluorescence effect of abamectin in the preparation could not be lost due to other fillers and additives. In addition, the concentration of abamectin could be reflected by the fluorescence intensity value, which further verified the feasibility of using the fluorescence spectrum to detect the content of abamectin.
Nov. 01, 2022Vol. 42 Issue 11 3476 (2022)
Jia-qing HAN, Gui-xia ZHOU, Jun HU, Jie-hong CHENG, Zheng-guang CHEN, Sheng-xue ZHAO, and Yi-ling LIU
The use of lubricating oil is necessary for the normal operation of agricultural machinery. The power performance, safety, economy and life of agricultural machinery engines are closely related to the condition of lubricating oil. The pollution concentration is the comprehensive evaluation index of oil, routine laboratory testing takes a long time and costs a lot, so it is of great significance to develop efficient detection technology for lubricating oil pollution concentration. This paper takes agricultural machinery lubricating oil as the research object. A method for detecting pollution concentration of agricultural machinery lubricating oil based on near-infrared spectroscopy is proposed. At the same time, aiming at the shortcomings of the Random Frog (RF) feature wavelength selection algorithm, such as a large number of iterations and low reproducibility, and iteratively retains informative variables-Random Frog (IRIV-RF) feature wavelength selection algorithm is proposed. On the one hand, IRIV-RF uses the iteratively retains informative variables (IRIV) algorithm to filter the strong and weak information variables. It is used as the initial variable subset of RF to eliminate the effect of the randomness of the initial variable set on the reproducibility of the results. On the other hand, IRIV-RF builds a Partial least squares regression (PLSR) model by arranging the variables in descending order of the selected probability values and then adding one wavelength at a time, starting with the first. The variable subset with the minimum Root Mean Square Error of Cross Validation (RMSECV) value is selected as the characteristic wavelength to eliminate the uncertainty of the number of characteristic wavelengths extracted by the RF algorithm. The original spectrum data of 101 samples of agricultural machinery lubricating oil with different pollution concentrations are collected by near-infrared spectrometer. Three different pretreatment methods are used to process the original spectrum, and the optimal pretreatment method is Standard Normal Variate (SNV). On this basis, the characteristic wavelength of the whole spectrum is selected by RF, IRIV and IRIV-RF algorithms, and the PLSR model is established. By comparing the prediction accuracy of full-spectrum PLSR, RF-PLSR, IRIV-PLSR and IRIV-RF-PLSR models, the results show that the prediction accuracy of the PLSR model based on the IRIV-RF algorithm is the highest, the Correlation Coefficient of Prediction (Rp) is 0.965 7 and the Root Mean Square Error of Prediction (RMSEP) is 9.058 4. It significantly improves the prediction accuracy and operation efficiency, reducing the model's complexity. It is proved that the proposed IRIV-RF algorithm is an effective characteristic wavelength selection algorithm, and the feasibility of near-infrared spectroscopy combined with the improved IRIV-RF algorithm to detect the pollution concentration of agricultural machinery lubricating oil is proved, which provides a new idea for identifying the quality of lubricating oil.
Nov. 01, 2022Vol. 42 Issue 11 3482 (2022)
Hong-bo FU, Bian WU, Hua-dong WANG, Meng-yang ZHANG, and Zhi-rong ZHANG
Lithium has excellent physical and chemical properties, so it plays an important role in military, battery, special alloy, controlled thermonuclear reactions and other fields. The existing lithium ore analysis methods are mainly off-line methods such as atomic absorption spectrophotometry, inductively coupled plasma mass spectrometry or atomic emission spectrometry based on acid decomposition. Laser-induced breakdown spectroscopy (LIBS) is an atomic emission spectroscopy method without sample preparation and is suitable for low atomic number elements (including lithium). The plasma emission spectra of 11 lithium ore composition analysis reference materials were collected experimentally using LIBS technology. The characteristic peaks of Li were observed near 610.35 and 670.78nm respectively. However, due to the overlap of spectral lines, univariate linear regression cannot be used for modeling. Based on the standardization of full-spectrum integral intensity, partial least squares regression (PLSR) and support vector regression based on principal component analysis (PCA + SVR) are used to model the lithium content in lithium ore reference materials. The relevant parameters of the calibration model are determined by the root to mean square error of the cross-validator (RMSECV). The results show that compared with PCA + SVR calibration model, the determination coefficient (R2) of PLSR is larger, and the calibration root mean square error (RMSEC) is small, but the prediction root mean square error (RMSEP) is much larger than RMSEC, and there is an overfitting phenomenon. On the other hand, the RMSEP and mean relative error (MRE) calculated by PCA + SVR are smaller than PLSR, so we think that PCA + SVR model has good adaptability. This work proves that LIBS technology can analyse Li content in lithium ore and is expected to be applied to the in-situ online quantitative analysis of lithium ore on a conveyor belt.
Nov. 01, 2022Vol. 42 Issue 11 3489 (2022)
Wei ZHU, Rui-fang YANG, Nan-jing ZHAO, Gao-fang YIN, Xue XIAO, Jian-guo LIU, and Wen-qing LIU
Polycyclic aromatic hydrocarbons (PAHs) are a toxic and harmful organic compound that widely exists in the natural environment. Its main sources are various microorganisms in nature and plant biosynthesis, natural fires in vegetation-rich areas, volcanic eruptions, fossil fuels, incomplete combustion of artificial industrial hydrocarbons and oil leakage during transportation. Polycyclic aromatic hydrocarbons are toxic, with biological carcinogenicity, heritage toxicity and mutagenicity. It harms human respiratory, circulatory and nervous systems in many aspects. Therefore, it is necessary to study the on-site monitoring and analysis methods of polycyclic aromatic hydrocarbons. Chemical analysis methods include chemical titration with pretreatment, liquid chromatography (LC), high-performance liquid chromatography (HPLC), and gas chromatography-mass spectrometry (GC-MS);Spectroscopic analysis studies UV absorption spectra, fluorescence spectra and three-dimensional fluorescence spectra. The three-dimensional fluorescence spectrum obtains the information of excitation and emission wavelength simultaneously, so it contains more optical information, high sensitivity and remarkable spectral characteristics. Therefore, it gains obvious advantages in the field detection of actual water bodies and the rapid study of mixed components of water samples. Common three-dimensional fluorescence spectrum analysis methods include parallel factor analysis (PARAFAC), multidimensional partial least squares (N-PLS), etc. Parallel factor analysis is an effective method to analyze polycyclic aromatic hydrocarbons' overlapping three-dimensional fluorescence spectra. However, sometimes, due to the weak fluorescence signal, the underdetermined three-dimensional fluorescence spectrum analysis cannot get satisfactory results. In order to extract more components from two sample sets, a method based on singular value decomposition(SVD)and PARAFAC is proposed. First, singular value decomposition is used on each observed sample, the appropriate singular value is selected according to the cumulative contribution rate, and a new pseudo sample is constructed to highlight the weak fluorescence signal. They were then inputting two observed samples and their corresponding pseudo samples into PARAFAC to recover the component spectrum. Three groups' three-dimensional fluorescence spectra of polycyclic aromatic hydrocarbons with different fluorescence intensities are analyzed. The pure component spectra of six polycyclic aromatic hydrocarbons were extracted and identified from two mixed samples and the result shows that the similarity between the emission/excitation spectra, and the standard spectra is more than 0.80.
Nov. 01, 2022Vol. 42 Issue 11 3494 (2022)
The combination of spectroscopic technology and machine learning algorithm for rapid identification of microplastics provides great technical support for microplastics' field detection, a new field that has attracted great attention. Nirs detection technology has the characteristics of fast detection speediness, highly sensitization, damage less, and can be directly detected without sample pretreatment, widely used in chemical analysis quality detection and other fields.This paper compares support vector machine (SVM) and Extreme Gradient Boosting (XGBoost), two machine learning classification algorithms based on the infrared spectrum, to build a classification model for high-speed and effective recognition of microplastics. Acrylonitrile butadiene styrene(ABS), Polyacrylonitrile (PAN), Polycarbonate (PC), Polyethylene glycol terephthalate(PET), Polymethyl methacrylate (PMMA), Polypropylene (PP), Polystyrene(PS), Polyvinyl chloride (PVC), Thermoplastic polyurethane (TPU), Ethylene-vinyl acetate copolymer (EVA), Polybutylene terephthalate (PBT), Polycaprolactone (PCL), Polyethersulfone (PES), Polylactic acid (PLA), Polyoxymethylene (POM), Polyphenylene Oxide (PPO), Polyphenylene sulfide (PPS), Poly tetra fluoroethylene (PTFE), polyvinyl alcohol (PVA), Styrenic Block Copolymers(SBS)20 standard samples of microplastics were collected by using A miniature near-infrared spectrum. In order to prevent overfitting, 1 260 microplastic samples were collected, each sample containing 512 data points. The XGBoost algorithm was used to rank the importance of the logarithmic data points, and a total of 65 data points which greatly influenced the recognition accuracy were extracted. SVM algorithm and XGBoost algorithm are respectively used to establish a microplastic fast recognition model for 65 data points extracted after dimensionality reduction, and GridSearchCV is used to select the hyperparameters that have a great influence on XGBoost algorithm to determine n_estimators, learning_rate, The optimal hyperparameters for min_child_weigh, max_depth, and gamma are 700, 0.07, 1,1, 0.0, respectively. In order to improve the model's stability, recognition rate and generalization ability, a 10-fold cross-validation and confusion matrix were used to evaluate the model. The results show that the recognition accuracy of the XGBoost model is 97%, while that of the SVM model is 95%. The accuracy of the XGBoost model is better than the SVM model. In conclusion, the overall performance of the XGBoost model was better than that of the SVM model, which provides technical support for rapid identification of actual microplastics.
Nov. 01, 2022Vol. 42 Issue 11 3501 (2022)
Da-wei YE, Fang DING, Ke-dong LI, Xia-hua CHEN, Yu LUO, Qing ZHANG, Ling-yi MENG, and Guang-nan LUO
Impurity seeding is considered a promising method to enhance edge plasma radiation and mitigate the head load on the vessel surface in the future tokamak devices like ITER. However, part of the injected impurities would inevitably be transported to the plasma core, causing strong core radiation loss and degrading plasma confinement. Spectral observation is an important means to obtain the information on impurity species, concentration and distribution in tokamak which plays an important role in understanding the impurity transport in plasma. During the EAST (experimental advanced superconducting tokamak) diverter Ar seeding experiments, the diverter visible spectroscopy (Div-W) system and the fast-response extreme-ultraviolet (EUV) spectroscopy system is used to detect the line emission of Ar1+ (Ar Ⅱ at 401.36 nm) in the edge and monitor the line emission of Ar15+ (Ar ⅩⅥ at 35.39 nm)from plasma core, separately. Meanwhile, Ar Ⅱ and Ar ⅩⅥ intensities' time evolution is obtained. The different ionization energies for Ar Ⅱ (27 eV) and Ar ⅩⅥ (918 eV) indicate that Ar Ⅱ and ArⅩⅥ are mainly distributed at the plasma boundary and the core plasma respectively. A correlation analysis method based on regular Pearson product moment has been developed to derive the time delay between the two line emissions from the edge and the core plasma. The relative delay time of Ar Ⅱ and Ar ⅩⅥ is calculated to characterize the transport time of Ar impurities from the boundary to the core. The results show that the rise of Ar ⅩⅥ line emission lags behind Ar Ⅱ line emission after Ar injection in the diverter. Moreover, the delay time is longer in the discharges with higher lower hybrid wave (LHW) heating power, indicating that higher LHW power can prolong the transport time of impurities from the boundary to the core.
Nov. 01, 2022Vol. 42 Issue 11 3507 (2022)
Guo-qiang ZHAO, Meng-lin QIU, Jin-fu ZHANG, Ting-shun WANG, and Guang-fu WANG
Ions beam-induced luminescence(IBIL) analysis is a real-time in-situ spectroscopy technique. Due to its sensitivity to the internal structure of the sample, it brings us certain difficulties in analyzing the spectral peaks information of the sample. In order to more accurately split the peaks of the IBIL energy spectra to more clearly determine the luminescence centers of different defects of the material, this paper proposes a Voigt function based on the LM (Levenberg-Marquardt ) of non-linear least squares algorithm to split the deep band emission peaks in the IBIL energy spectra of ZnO at 100 and 200 K. By comparing the fluctuation of the position of the peak with fluence after the Gauss function and the Voigt function are fitted to the energy spectrum, it is found that the position of the peak obtained by the Voigt function fitting is stable and the convergence speed is fast. At the same time, by comparing the full width at half maximum (FWHM) of the Gaussian function with the FWHM of the Lorentz function of the three sub-peaks of 1.75 , 1.95 and 2.10 eV after fitting using the Voigt function, it is found that the FWHM of the Lorentz function is about 1/10 of FWHM of the Gaussian function. Moreover, the 1.95 eV peak at 100 K, 1.75 and 1.95 eV peak at 200 K, the FWHM of the Lorentz peak is below the order of magnitude, indicating that the non-uniform broadening ( Gaussian broadening) is still the main mechanism of spectral peak broadening; while the scattering of electrons and phonons is the main mechanism of Lorentz broadening. For the 2.10 eV sub-peak involving a large number of electrons in the conduction band, the FWHM of the Lorentz function at 200 K is significantly greater than 100 K, and the thermal vibration of the crystal lattice is intensified at a higher temperature, and the thermal movement of electrons is strengthened. It increases the probability of scattering, strengthening the scattering effect of electrons and phonons, further broadening the Lorentz spectrum. The red light with the peak center at 1.75 eV is mainly related to VZn. At 100 K, the FWHM of this is 0.02 eV, but it becomes extremely small at 200 K. This is because bound electrons or excitons get enough thermal kinetic energy at 200 K to get rid of the VZn bond, weaken the scattering effect with the surrounding lattice, so that the Lorentz broadening becomes extremely weak. The experimental results show that the Voigt function is more suitable for IBIL energy spectrum fitting to split peaks, which also provides an example for the future application of IBIL to the energy spectrum analysis of the internal structure of other materials.
Nov. 01, 2022Vol. 42 Issue 11 3512 (2022)
Yue-hao HUANG, and Yong-ze JIN
Regong area of Qinghai Province, an important origin of Tibetan architectural painting art in the Amdo Tibetan Area and a crucial part of Regong Art, has a wide influence. In addition to being the artistic treasure attached to architecture, Regong local architectural color painting is also a traditional skill in the current era. At present, there are a large number of traditional craftsmen engaged in related industries. Considering that the local architectural painting in Regong has developed its own independent methods of color usage and pigment-making technology, the scientific detection of traditional pigments is the basic work of the systematic study of architectural color paintings in this area. It is of great significance for many aspects, such as the study of the craft and artistic characteristics of architectural color painting in Regong area, inheritance of local architectural color painting craft and the perfection of the protection policy, etc. This work sampled the local traditional architectural color painting pigments of the Fire Temple of Xiaricang Palace, the Longwu Temple in Tongren city. Different experimental analysis methods such as XRF, XRD, RS and others were applied to analyze the pigment samples. Major chromogenic substances and components were successfully determined. The results show that inorganic pigments are mostly used in the local architectural painting in Regong. Blue pigments are mainly artificial ultramarine, while the green pigment is green clay. The chromogenic substance is montmorillonite. It has the possibility of mixing locally produced magnesium-rich montmorillonite with plant-coloured dyes. The main red pigment is iron red (red ochre red earth). It is artificially synthesized by roasting rich iron ore soil. The material comes from red ochre clay produced in the local village of Wutun. The yellow pigment is made from PbO, sulfur and other vegetable dyes. The black pigment is carbon black, which accords with the characters and characteristics of wood carbon black. White pigment is quicklime and magnesium oxide powder. Lime and magnesia powder are widely used in other pigments. It is speculated that some samples contain gold-coated clay, plant pigment dyes and other synthetic pigments. On the whole, the pigment used in the architectural color painting in the Regong area is cheap and not difficult to make. Most sources are local common mineral soil and animal and plant pigments. The traditional material-making technology is rough and simple. Most pigments such as PbO, gold-coated clay and artificial ultramarine come from the mainland and abroad. These artificial pigments have a long history, reflecting the historical tradition that architectural color paintings in the Regong area not only use local materials but also widely use foreign pigments, which provides good evidence for further study of the history of ethnic cultural exchange in the field of architectural color paintings in the Regong area.
Nov. 01, 2022Vol. 42 Issue 11 3519 (2022)
Yao ZHANG, Hong GUO, Jian-du YANG, Bo LI, Jin-feng TIAN, and Rong-bo YE
The mural is an extremely important type of cultural heritage in China, with historical, artistic, scientific, cultural,and social value. The paint layer is the core value of the mural cultural relic, which contains important information and connotation of the ancient history and culture, religious belief, political economy, science and technology. The conventional and research methods are divided into nondestructive in-situ analysis and micro damage sampling. Although the sampling analysis method can satisfy the research of this precious and fragile cultural relics, the number of samples obtained is limited, and it causes irreversible damage to the noumenon. This paper uses digital imaging and spectral analysis to analyze the material and technology of the paint layers of Xianrenya grottoes in Tianshui. The results show that orthographic image can record the texture morphology information of the murals. Colorimeter can quantify the color of the pigments. Infrared-ultraviolet photography can extract hidden information such as drawing lines and repairing traces of murals wich are not easy to detect under visible light.High-power digital microscope can observe the micro morphology of the mural surface and the hierarchical information of damaged parts. Portable X-ray fluorescence spectrum can detect the color elements in the murals. After comparing the data collected by Hyperspectral with the standard spectrum, the mineral types of the pigment can be accurately determined. Therefore, using various kinds of nondestructive in-situ analysis can reduce the direct intervention on cultural relics and achieve the purpose of understanding the material and technology of the paint layers of murals. These non-contact and non-destructive testing methods can study the color, physical and chemical properties of the paint layer of murals systematically. They are all important and rapid means of nondestructive and in-situ analysis murals. They can be widely used in the study of grottoes, temples and tombs.
Nov. 01, 2022Vol. 42 Issue 11 3526 (2022)
Su-qiao CAO, Hui DAI, Chao-wen WANG, Lu YU, Rui ZUO, Feng WANG, and Lian-qiao GUO
Emeralds from Swatin Pakistan are well known for their vivid greenish color and high clarity. How identify the characteristics of emeralds from Swat valley has becomes a hot topicsince their prices have increased every year. Therefore, in this paper, we investigated the gemological andspectral characteristics of emeralds by using conventional gemological tests, LA-ICP-MS, infrared spectroscopy, Raman spectrometer and UV-Vis spectroscopy. Meantime, wealso discussed the color origin of emeralds from Swat. The results show: (1) Most of the rough emeralds from Swat valley are hexagonal-prismsforms. These crystals normally show brightly green and high transpar- ency. There is also a moderate to strong (yellow-green/blue-green) dichroism effect. Most emeralds have a higher refractive index of 1.588~1.599. (2) In the crystals, a part of Al hasbeenreplaced by Mg, Fe or Cr. The most substituted element is Mg, with a content of 11 402~12 979 ppma (avg. 12 446 ppma). The second most substitute- ed elementsare Fe and Cr (their average contents are 2 390 and 2 199 ppma respectively). Concentrations of alkaline cations (Na, K, Rb, Cs) are very high, ranging from 14 201 to 16 136 ppma (avg. 15 183 ppma). (3) FTIR spectra show the fingerprint's absorption peaks at 1 312, 1 152, 983, 838, 701, 616 and 559 cm-1, caused by the vibration of [Si6O18] groups. The peak at 7 074 cm-1 is significantly strong, indicating a significantly high quantity of type Ⅱ H2O in the crystals. It is related to the higher content of alkaline cations (Na, K, Rb, Cs). Raman shifts at 324, 399, 516, 685 and 1 067 cm-1 are all related to the vibration of emerald. Raman shifts related to H2O (3 595 cm-1), CO2 (1 284 and 1 388 cm-1) and N2 (2 327 cm-1) are also detected in the gas-liquid inclusions. The associated minerals on crystalsare talc and magnetite. (4) UV-Vis spectra show absorption peaks corresponding to Cr3+(688~641 nm), V3+(610 nm), Fe2+(860 nm) and Fe3+ (375 nm). In the samples, the content of Fe is 1 124~3 561 ppma, the content of Cr is 730~3 077 ppma, while the content of V is less, which is 28.01~263.9 ppma. In addition, the content of Cr in different samples changes greatly, the content of V changes little, and the ratio of Cr and V ions is about 3.43~60.05. With the increase of color saturation, the content of Cr increases sharply, the content of V changes very little, and the content of Fe decreases. We can infer that the main chromogenic element of emeralds from Swat valley is Cr, followed by V, while the hue and fluorescence may be affected by Fe.
Nov. 01, 2022Vol. 42 Issue 11 3533 (2022)
Zi-min WANG, Xiao-tian MAO, Zuo-wei YIN, Chang CHEN, and Tian-jia CHENG
Spinel is a precious gem known for its vivid color and fame in historical record. Colour changing is a common optic phenomenon in gemology normally seen in alexandrite, sapphire, spinel, garnet, etc. The colour changing in gemstones could mostly be attributed to chromium ions and vanadium ions, but there are few reports on color-change spinel, and there is a lack of research on color-causing elements and discoloration mechanism. The subjects of this study include an color-change spinel (blue under D65 illumination, violet-blue under A illumination) and two blue spinels without discoloration effect (there is no significant change in tone under the two light sources). The spectral details and chemical composition of spinel samples could be obtained via laser-ablation ion-coupled-plasma mass spectrometer (LA-ICP-MS), ultraviolet-visible-light spectrometer, Raman spectrometer and photoluminescence spectrometer. Compositional analyses of LA-ICP-MS show that all three samples are magnesia-alumina spinel, the main chemical components are MgO and Al2O3 and contain trace elements such as Fe, V, Cr, and Zn etc. The concentration of Fe ion in the color-change spinel is relatively higher, while there is an only minute amount of concentration of Co ion, and the content of V ions in the color-change spinel is similar to that in the blue spinel. UV-Vis spectrum of the color-change sample reveal several absorption peaks: 387, 461, 478, 527, 559, 590, 627, 668 nm.The spin causes the absorption peaks at 559, 590 and 627 nm allowed transition 4A2→4T1(4P) of the d electron spin of Co ion and split by spin-orbit coupling. In addition, the Fe2+d-d spin forbidden transition5E(D)→3T1(H) in tetrahedral coordination also produces an absorption peak at 559 nm. Specifically, the absorption band around 559 nm, which resulted mutually from Fe ion and Co ion, is the principal reason of color-change effect in spinel. A comparison of Raman spectra shows no difference between the color-change spinel and the other two blue spinels, where the Raman displacement of 311, 405, 663 and 765 cm-1 correspond to F2g(1), Eg, F2g(3) and A1g vibration, respectively. Photoluminescence analysis of the color-change sample shows that the energy level 4T1(P) of Co2+ ion in Td symmetric position subdivides into three secondary levels. 686, 650 and 645 nm luminescence peaks are generated as electrons drop from excited states of these three 4T1(P) sub-levels to ground state of 4A2(F).The content of Co ion in color-change spinel is very low, and the content of Fe ion is high. Due to the fluorescence quenching of the Fe ion, the sample has no red luminescence.
Nov. 01, 2022Vol. 42 Issue 11 3541 (2022)
Yang LÜ, Jing-cheng PEI, and Yu-yang ZHANG
Sapphires has high economic value as one of the five precious stones. Among them, “royal blue” and “bonnet blue” are the most expensive. Using the hydrothermal method can synthesize “royal blue” sapphires, and the synthesized crystal is large and can have a pure interior by cutting and grinding, so it is difficult to identify it only by appearance and conventional methods. The researchers select seven blue hydrothermal synthetic sapphires to analyze their chemical composition and spectra features by LA-ICP-MS, Raman spectrometer, Infrared spectrometer, UV-Vis absorption spectrometer and Three-dimensional Fluorescence spectrometers. These samples are compared to natural and flame-fusion synthetic sapphires with a similar appearance. The analysis shows that the chemical compositions of hydrothermal synthetic sapphires are simple, but natural sapphire usually contains rich trace elements. In Raman spectra, three kinds of sapphires samples all show typical corundum vibration modes with A1g and Eg. In the lattice vibration region of Infrared spectra, there is no obvious difference, which fits the result of Raman spectra. However, in the 3 000~4 000 cm-1 region of Infrared spectra, hydrothermal synthetic sapphires show the hydroxide radical vibrations generated by hydrated mineral inclusion, but it isn't displayed in natural and flame-fusion synthetic sapphires. UV-Vis spectra show that Fe2+-Ti4+ ion pairs produce colors in these three kinds of samples, but hydrothermal and flame-fusion synthetic sapphires lack the 450nm absorption peak of the natural sapphire. 3D fluorescence spectra show that both hydrothermal and flame-fusion synthetic sapphires have blue fluorescence induced by Ti4+ ion-related charge transfer under the excitation of a 240nm light source, which is lacking in natural sapphire. Nevertheless, there is no such fluorescence in the natural sapphire. To conclude, chemical composition, Infrared spectra, UV-Vis absorption spectra, and 3D Fluorescence spectra can provide important evidence for identifying hydrothermal synthetic sapphires.
Nov. 01, 2022Vol. 42 Issue 11 3546 (2022)
Hong-jun LIU, Teng NIU, Qiang YU, Kai SU, Lin-zhe YANG, Wei LIU, and Hui-yuan WANG
The leachate generated from the long-term storage of waste residue and waste liquid produced in mining mineral resources diffuses into the soil, which is easy to cause the surrounding soil to be polluted by heavy metals and affects its crop growth. After human beings eat fruits containing heavy metals through the food chain, they will cause neurasthenia of the nervous system, numbness of hands and feet, indigestion of the digestive system, blood poisoning, kidney injury and other symptoms. Then it will pollute and damage the ecological environment and personal safety. therefore, how to quickly find out the situation of soil pollution is particularly critical. With the development of remote sensing technology, multispectral remote sensing has great potential in breaking through the vegetation barrier to monitor heavy soil metals because of its high spectral resolution and real-time non-destructive and large-area monitoring advantages. This study takes peach trees, the main crop in Pinggu District, as the research object. Using hyperspectral data of peach leaves and field soil sampling data, the response characteristics of peach leaf spectral curves were analyzed. The reflectance spectra of peach leaves were transformed by first-order/second-order differentiation, standard normal transformation and continuous de unification. The characteristic variables are determined by correlation analysis and multiple linear regression model, construction of vegetation index HMSVI, the correlation between HMSVI and Cd, As and Pb content is higher than that of common vegetation index. After modeling element content and vegetation index HMSVI by linear regression method, selecting the model with good fitting, the statistical modeling of leaf hyperspectral reflectance spectrum and soil heavy metal content was realized, and the spatial distribution of heavy metal content was retrieved from sentinel-2 remote sensing image, and the results were verified. The results show that: the average spectral reflectance of leaves under heavy metal stress was higher than that of normal leaves, and the phenomenon of “blue shift” occurred. 780, 945 and 1 375 are the most sensitive to heavy metal pollution. The inversion model established by using the vegetation index constructed in three bands can be better used to predict the content of heavy metal elements in peach forest soil. The prediction models are y=0.44x+0.193, y=7.436lnx+13.161, y=-15.359x+13.583x2+23.541 respectively. The spatial inversion results show that the high-value areas of the three heavy metals are widely distributed near the liujiadian tailings pond, Wanzhuang tailings pond and Jinhai Lake tailings pond in Pinggu District. Heavy metal pollution is more serious in the West than in the East. The mapping results can provide basic data support for preventing and treating heavy metal pollution in Taolin, Pinggu District, Beijing.
Nov. 01, 2022Vol. 42 Issue 11 3552 (2022)
UAV-based remote sensing technique provides a new perspective and platform for precision agriculture and agricultural information monitoring. The hyperspectral sensor has centimeter-level spatial and fine spectral resolution, allowing for the acquisition of high-quality hyperspectral data. However, hyperspectral data often bring question on noise, data redundancy and inefficient use of hyperspectral information, whereas conventional preprocessing is difficult to estimate withhigh-precision. Therefore, data mining for UAV-based hyperspectral images is essential to solve the above problems. Here we used fractional order differential (FOD) to process UAV-based hyperspectral data (with a step length of 0.1). The optimal FOD order is explored at the spectral level by comparing the ability of the FOD technique with the integer order technique to improve the hyperspectral data. Soil moisture content (SMC) estimation models were constructed under the Gradient-Boosted Regression Tree (GBRT) algorithm, and the spatial distribution of SMC was finally evaluated under the best model. The results found that the correlation between the spectrum and SMC alsowas increased (absolute maximum correlation coefficient, rmax=0.768). Compared with the original image and processed images via first and second order derivatives, rmax increased by 0.168, 0.157 and 0.158, respectively. The main reason for the FOD technique to enhance the accuracy of model estimation is to highlight the role of effective spectral information, especially chlorophyll, plant structure and water response bands closely sensitive to drought stress. (430, 460, 640, 660 and 970 nm). By comparison, the low-order FOD (order1). The higher order FOD adds a certain amount of noise to the image, though the FOD technology achieves the desired result. Estimated model achieved the best results in the 0.4-order model (Rp2=0.874, RMSEP=1.458, RPIQ=3.029). In addition, the SMC estimation models of 0.1—0.9 order and 1.6—1.9 order outperformed the integer-order models (Rp2 improvement of 0.8%~13.8%), but the lower-order FOD models were found to be stronger in terms of model predictive power based on the RPIQ of the models. The spatial distribution of inverse farmland soil moisture under the 0.4 order model indicated significant spatial heterogeneity of farmland SMC in the arid regions. In conclusion, the low-order FOD technique effectively enables the mining of hyperspectral data to accurately estimate agricultural SMC. This study proposes a new approach to airborne hyperspectral image processing that provides a new strategy for precision agriculture implementation and management in arid regions.
Nov. 01, 2022Vol. 42 Issue 11 3559 (2022)
Shi-jiao GAO, Hai-ou GUAN, Xiao-dan MA, and Yan-hong WANG
To solve the problem that the edge gray level of the soybean canopy near the ground is uneven, the gray level difference between the target and the background is small, and it is difficult to accurately and efficiently obtain the soybean canopy target area. This paper combined the multispectral imaging processing technology with the classical image segmentation method and proposed a soybean canopy extraction method based on the multispectral image processing technology. Five kinds of soybean multispectral images, including green light, near-infrared, red light, red edge, and visible light, were collected by Sequoia multispectral camera. A Gaussian smoothing filter preprocessed the original soybean multispectral images. The distribution characteristics of the gray histogram of the soybean canopy and background were analyzed. On this basis, the iterative method, Otsu method, and local threshold method were used to extract the canopy region in the original soybean multispectral image, and the image morphological open operation was used to refine and expand the background to avoid the influence of the interference noise in the image region on the recognition effect of soybean canopy. At the same time, the effective segmentation rate, over-segmentation rate, under-segmentation rate, information entropy, and running time were taken as the monitoring indexes, and the effect of the soybean canopy multispectral image recognition model was evaluated. The results showed that the iterative method could effectively segment the near-infrared and visible soybean canopy images, and the effective segmentation rate was 97.81% and 87.99% respectively. The segmentation effect of green, red and red edge soybean canopy images was poor, and the effective segmentation rate was less than 70%. Otsu and local threshold methods could effectively segment the other four kinds of multispectral soybean canopy images except for red light, and the effective segmentation rate was more than 82%. The effective segmentation rate of the three algorithms for red soybean canopy images was less than 20%, which did not achieve good results. In the original multispectral image, iterative method, Otsu method, and local threshold method were used to extract the mean value of information entropy of soybean canopy image and standard image, and the fluctuation amplitude was 0.120 1, 0.054 7, and 0.059 8, respectively. Otsu and local threshold methods were smaller, showing the effectiveness of the two algorithms in soybean canopy multispectral image recognition. The Otsu and local thresholding methods could effectively extract the soybean canopy images of green light, near-infrared, red edge, and visible light. Both of them retained the soybean canopy information completely. Otsu method had better real-time performance than the local thresholding method. The results provided a theoretical basis and technical reference for extracting crop canopy multispectral images.
Nov. 01, 2022Vol. 42 Issue 11 3568 (2022)
Hai-kuan FENG, Hui-lin TAO, Yu ZHAO, Fu-qin YANG, Yi-guang FAN, and Gui-jun YANG
Chlorophyll content (SPAD) is a vital index for crop growth evaluation, which can monitor the growth of crops and is crucial for agricultural management, so it is important to estimate SPAD quickly and accurately. In this study, the remote sensing images of the jointing, flagging, and flowering stages were acquired using UAV hyperspectral for winter wheat. The vegetation indices and red edge parameters were extracted to explore the ability of vegetation indices and red edge parameters to estimate SPAD. Firstly, the vegetation indices and red edge parameters were correlated with the SPAD of different fertility stages. Then, the SPAD was estimated based on the vegetation indices, vegetation indices combined with red edge parameters , and using partial least square regression (PLSR) method. Finally, the SPAD distribution map was produced to verify the validity of the model. The results showed that (1) most of the vegetation indices and red edge parameters were correlated with SPAD at highly significant levels (0.01 significant) in all three major reproductive stages; (2) the SPAD estimation model constructed from individual vegetation index had the best performance for LCI among vegetation indexes (best R2=0.56, RMSE=2.96, NRMSE=8.14%) and Dr/Drmin performed best (best R2=0.49, RMSE=3.18, NRMSE=8.76%); (3) SPAD estimation model based on vegetation indices combined with red edge parameters was the best and better than SPAD estimation model based on vegetation indices only. Meanwhile, both models reached the highest accuracy at the flowering stage as the fertility stage progressed, with R2 of 0.73 and 0.78, RMSE of 2.49 and 2.22, and NRMSE of 5.57% and 4.95%, respectively. Therefore, based on the vegetation indices combined with the red edge parameters, using the PLSR method can improve the estimation effect of SPAD, which can provide a new method for SPAD monitoring based on UAV remote sensing, and also provide a reference for agricultural management.
Nov. 01, 2022Vol. 42 Issue 11 3575 (2022)
Chong WANG, Jing-hua WANG, Dong-dong LI, and Jiang-bo SHE
The purpose of this paper is to study a rare earth doped luminescent material with good up-conversion luminescence performance, which is of great significance in anti-counterfeiting technology. In order to improve the up-conversion luminescence performance of LiYF4∶Yb3+/Ho3+ micron crystals, a series of Gd3+-doped LiYF4∶Yb3+/Ho3+ micron crystals were successfully prepared by hydrothermal synthesis method. XRD and Scanning electron microscope (SEM) were used to characterize the samples' phase purity and crystal morphology. Fluorescence spectra analyzed the upconversion luminescence properties of LiGdxY1-xF4∶Yb3+/Ho3+ micron crystals under 980nm laser excitation. Firstly, the crystal structure, size, morphology and upconversion luminescence properties of LiGdxY1-xF4∶Yb3+/Ho3+ micron crystals were investigated. The results show that the XRD diffraction peaks of LiGdxY1-xF4∶Yb3+/Ho3+ micron crystal samples are exactly corresponding to the characteristic peaks of the tetragonal LiYF4 standard card (PDF#17-0874) without other peaks. The SEM characterization results show that the crystal morphology is octahedral. It shows that LiGdxY1-xF4∶Yb3+/Ho3+ micron crystal with pure tetragonal phase was successfully synthesized. Fluorescence spectrum test results showed that the up-conversion luminescence intensity of the samples increased first and then decreased with the increase of Gd3+ ion doping concentration and reached the maximum when Gd3+ ion doping concentration was 30 mol%. Secondly, the relationship between the up-conversion luminescence performance and the excitation power of Gd3+ doping concentration of 30 mol% was further studied, and the excitation power was 0.5~1.5 W. The red and green upconversion luminescence intensity (R/G) ratio of LiGd0.3Y0.49F4∶Yb3+/Ho3+ micron crystal only changes about 12% with the increase of excitation power. The upconversion luminescence of LiGd0.3Y0.49F4∶Yb3+/Ho3+ micron crystal does not change obviously with the increase of excitation power, but still emits stable and bright green light. This phenomenon shows that incorporating Gd3+ ions greatly improves the up-conversion luminescence performance of the samples, and this stable and efficient luminescence performance guarantees its good anti-counterfeiting performance. Finally, LiYF4∶Yb3+/Ho3+ micron crystal powder with Gd3+ ion doping concentration of 30 mol% was mixed with screen metal ink in a certain proportion to produce screen anti-counterfeiting ink, and then the anti-counterfeiting logo pattern of “Xi'an” was printed on the glass base by screen printing technology. After drying treatment, under the excitation of 980 nm laser, it emits bright and stable green visible light, and the anti-counterfeiting logo made has the characteristics of high luminous intensity, easy to identify and not easy to fall off, which can be widely used in the field of anti-counterfeiting.
Nov. 01, 2022Vol. 42 Issue 11 3581 (2022)
Xing-zhong HUANG, Wen-fen WU, Zhan-bing LI, Hui-quan LI, Qing-qing LIU, and Shao-peng LI
Secondary aluminum dross (SAD) is a hazardous waste produced in the electrolytic aluminum, aluminum processing, and aluminum recycling industries. The SAD produced from different processes has the characteristics of complex mineral phases and large discrepancy in chemical composition, which leads to a large difference in the effect of treatment technology for various SAD and a low resource utilization rate. Clarifying the morphology, distribution and formation of the nitride and fluoride in the SAD from the typical aluminum alloy production process is conducive to the development of a highly adaptable SAD treatment technology to realize the efficient separation of the toxic and valuable components of the SAD and solve the problem of resource utilization effectively. In this paper, Chemical and instrumental analysis are combined by using X-ray diffraction and X-ray fluorescence spectroscopy to quantitatively study the content of fluoride, nitride, and other phases in the samples of SAD from different processes. X-ray photoelectron spectroscopy and scanning electron microscope are used to analyze fluoride and nitride's combined form and distribution characteristics. The results show that the quantitative results of nitrides and fluorides in SAD using spectral and chemical analysis methods are consistent. The content of nitrides in different samples of SAD from the aluminum alloys production of Al—Si, Al—Mg, and Al—Mg—Si is 4.30%~5.48%. The nitride phases are mainly in the form of AlN, which is generated by the reaction of aluminum melt and nitrogen. The particles of AlN are spherical-end strip and prismatic, which are separate particles connected with aluminum-containing particles. The content of fluorides in different samples of SAD is 1.04%~2.29%, and the SAD generated in the Al—Si alloy production are mainly NaF, CaF2, MgF2, Na3AlF6, while those from the Al—Mg and Al—Mg—Si alloy production are CaF2, MgF2, and KF. The fluorides are used as additives to enter the SAD during the production process of aluminum products, and no other phase formation occurs during the SAD generation process. In the samples of these three series, the fluorides are concentrated on the surface, in the forms of flocculent or irregular lumps, attaching to or covering the large particles, existing in joint with other components, or as separated free particles. This study would provide a fundamental basis for removing fluorides and nitrides from SAD.
Nov. 01, 2022Vol. 42 Issue 11 3588 (2022)
Cheng CHEN, Xiao-ling LI, Jin-jie WU, Xiang-lei CHEN, Rong-jun WU, Xiao-hui XU, and Guo-hua ZHU
K fluorescence radiation device can fill the metrological verification needs of super large measuring area nuclear radiation detector in China. The device has the advantages of high flux, many energy points, good monochromaticity, low cost and is ready to use. The principle is that the X-ray emitted by the X-ray machine bombards the radiator material to produce a variety of characteristic X-rays, namely fluorescent rays. A secondary filter is added to the fluorescent ray emission path to absorb the excess rays and improve fluorescent purity. The material thickness of the radiator and the secondary filter is directly related to the fluorescent yield and purity. The results of various index parameters of the fluorescent device are calculated by the Monte Carlo program to guide the establishment and research of the later test device. The data of Cs2SO4 radiator simulated by MCNP5 software show that the fluorescent device has good shielding and collimation effect, and the fluorescence is symmetrical and gradually decreases in the vertical plane of the radiator Center; The fluorescence yield increases with the increase of radiator thickness, but there is a relative saturation thickness; In order to obtain a single energy fluorescence radiation field, a secondary filter TeO2 material is added in the direction of the fluorescence beam, which absorbs L and Kβ The ray will be much greater than Kα Radiation; When the thickness of the secondary filter is 0.035 cm, the fluorescence purity of 94.521% is the maximum and the fluorescence yield is the highest; The fluorescence purity first increases and then decreases with the increase of the thickness of the secondary filter material; The energy spectrum data of K fluorescence radiation device is obtained through the actual measurement of the detector, and the energy spectrum data is processed and analyzed by root program to fit Kα1, Kα2. The peak location error of the energy point is less than 0.005%. The deviation between energy value and the theoretical value is 0.19% and 0.23% respectively, and the results are consistent. The measurement results can verify that the secondary filter material calculated by the MCNP5 program has a good absorption effect and realizes the single energy Fluorescence reference radiation field.
Nov. 01, 2022Vol. 42 Issue 11 3595 (2022)
Gang LI, Yi-chao CHEN, Jian-jun ZHANG, Fu-yu HUANG, and Shuai ZHANG
In the existing vehicle assisted driving systems, a visible imaging system is difficult to be effectively applied to night, rain, fog, haze and other bad weather conditions with low illumination. An infrared imaging system can effectively overcome the above shortcomings, but the traditional vehicle infrared system has the shortcomings of a small field of view and large blind area. The vehicle application of the ultra-field infrared system is studied in this paper, and a demonstration method of key parameters is proposed for ultra-field infrared system application by utilizing the joint constraints based on safe distance and imaging size. Specifically, the isometric projection imaging law is firstly analyzed; then, the constraint models of safety distance and imaging size are established. Finally, its feasibility is verified by the nearest detection distance corresponding to the limit speed and the longest discovery distance under the constraint of the two-dimensional Johnson criterion, and its key parameters are calculated. The ratio of the lens focal length to pixel size range of the ultra-field infrared vehicle mounted system shall be within the range of[276.1 521.3] through theoretical demonstration and analysis. The system experiments designed the ultra-field infrared imaging system with a horizontal field angle of 140° is designed in the system experiments. The detection distance of the infrared imaging system is more than 130 m, which can meet the requirement of discovery distance for auxiliary driving.
Nov. 01, 2022Vol. 42 Issue 11 3601 (2022)
Yun-fei WU, Xiao-li LUAN, and Fei LIU
The highly accurate on-line detection of solute concentration by using near-infrared spectroscopy analysis technology is of great significance for production optimization. Establishing a detection model needs to extract relevant information from the near-infrared spectrum, more representative samples will extract more effective information, and the model will also be more accurate. However, the purity of products has been continuously improved, and sample discrimination is reduced. The coefficient of variation of the sample is small, which leads to the diversity of samples being insufficient. Moreover,there are measurement errors when measuring the sample concentration in the laboratory, which will lead to the lack of correlation between the solute concentration and the spectrum. It is hard to establish a reliable and highly accurate near-infrared detection model. A new transfer learning modeling method based on PLS subspace alignment is proposed and applied in the near-infrared on-line detection of 2,6-dimethylphenol high purity in the product tower of the distillation purification process. In preparing the chemical monomer 2,6-dimethylphenol, there are side reactions and unreacted impurities, the materials after reaction must flow through different rectifying towers in sequence, and finally, the product with purity higher than 99% is obtained in the product tower. The product quality inspection of the product tower is particularly important. Due to the lack of diversity of the detection data of product tower detection point, the generalization ability of the detection model is weak. We create subspaces for the data sets of different detection points in the separation and purification of 2,6-dimethylphenol using the partial least squares method. Then, a mapping that aligns the other tower subspace into the product tower is learned by minimizing a Bregman matrix divergence function, reducing the feature distribution discrepancy between other towers and product towers. It avoids information loss in product tower data when projecting to a common subspace and makes full use of the feature information in other towers. The partial least squares regression modeling is completed on the transferred subspace and the final model coefficients are determined by the winner-takes-all-based weighting method. After the above method, the product tower detection model's performance has improved. Finally, the effectiveness of this method is verified with the near-infrared detection data set of 2,6-dimethylphenol. We discuss the influence of transferring different amounts of data from other detection points on the performance of the product tower detection model. The performance improvement of the product tower detection model is improved by 52.19% in the best case, and the root means square error of prediction (RMSEP) dipped from 0.059 4 to 0.028 4. Compared with the traditional modeling methods such as support vector machine regression (SVR) and Back-Propagation (BP) neural network, it has better performance.
Nov. 01, 2022Vol. 42 Issue 11 3608 (2022)
Xue-bin XU, Xiao-min XING, Mei-juan AN, Shu-xin CAO, Kan MENG, and Long-bin LU
Biometric identification plays an important role in the field of information security. As a new biometric identification method, Palmprint identification has the advantages of low distortion, non-invasiveness and high uniqueness. Traditional palmprint research mostly uses natural light imaging systems to acquire in grayscale format, and it is not easy to improve the recognition accuracy further. In order to obtain more identification information, a multispectral palmprint image is proposed to replace the natural light palmprint image. Aiming at the problem that the existing palmprint recognition algorithms do not consider the characteristics of different spectra, resulting in loss of texture details and low recognition accuracy, a palmprint recognition algorithm based on multi-spectral image fusion is proposed. This method decomposes the multispectral palmprint image into a series of two-dimensional intrinsic mode functions (BIMF) with frequencies from high to low and a Residual component, which can be regarded as a preliminary estimate of the low-frequency information of the spectral image. Since the illumination conditions are unstable during the image acquisition process, and the near-infrared spectral image is sensitive to illumination transformation during FABEMD decomposition, it is easy to cause the decomposed BIMF background information to be too redundant. Therefore, the background reconstruction of the decomposed near-infrared palmprint image is performed. And feature refinement, which effectively enhances the feature expression of high-frequency information while smoothing the background redundant information. In order to avoid the problem of image overexposure caused by the spectral information after direct fusion processing, it is proposed to compress the near-infrared features before fusion. In addition, an improved residual network (IRCANet) combined with an attention mechanism is proposed for palmprint image classification after fusion, and a staged residual structure is introduced into the network to alleviate the degradation problem of the network. For the fused multispectral palmprint image, the staged residual structure can stably transmit image information between networks, but the effect of distinguishing high and low-frequency information in the image is not significant enough. In order to make the network pay attention to More discriminative features, use the interdependence between feature channels and incorporate a channel attention mechanism in the staged residual structure. Finally, comprehensive experiments on the multispectral palmprint dataset of the Hong Kong Polytechnic University (PolyU) show that the method can achieve good results, and the algorithm recognition accuracy can reach 99.67% and has good real-time performance.
Nov. 01, 2022Vol. 42 Issue 11 3615 (2022)
Guang-lai WANG, En-feng WANG, Cong-cong WANG, and Da-yang LIU
Pear in storage, packaging and transportation processes may occur in different degrees of mechanical damage. If not removed in time, the damage may gradually become serious and rot, resulting in serious economic losses. In order to establish a rapid and non-destructive detection method for early bruise detection and bruise time assessment of pears, hyperspectral imaging technology combined with a transfer learning model was used to identify crystal pears with an early bruise. The hyperspectral images of crystal pears with no bruise, crush bruise at 24 h and crush bruise at 48 h were acquired by the hyperspectral imaging system, and 80 hyperspectral images of crystal pears with no bruise, crush bruise at 24 h and crush bruise at 48 h were obtained. Principal component analysis was performed on the hyperspectral images, and principal component images 4, 5 and 6 (PC4, PC5 and PC6) were selected as the feature images for detecting crystal pear bruises. After the data expansion of the stitched images with three principal components, 160 images of crystal pears with no bruise, crush bruise at 24 h and crush bruise at 48 h were obtained. The training sample set and test sample set were divided according to the ratio of 9∶1, Support Vector Machine (SVM), k-Nearest Neighbor (k-NN), and transfer learning bruise recognition models based on the ResNet50 network were established, respectively. The results showed that the overall recognition accuracy of SVM, k-NN and ResNet50 network-based transfer learning models for the test set was 83.33%, 85.42% and 93.75%, respectively. The transfer learning model based on the ResNet50 network had the best recognition results, and its correct recognition rates for the test set of crystal pears with no bruise, crush bruise at 24 h and crush bruise at 48 h reached 100%, 83% and 95%, respectively. The results of this study indicate that hyperspectral imaging technology combined with the transfer learning method based on the ResNet50 network can achieve early bruise detection of crystal pears and have a great prediction performance for bruise time, and the longer the bruise time, the higher the recognition accuracy.
Nov. 01, 2022Vol. 42 Issue 11 3626 (2022)
You-rui SUN, Mei GUO, Gui-shan LIU, Nai-yun FAN, Hao-nan ZHANG, Yue LI, Fang-ning PU, Shi-hu YANG, and Hao WANG
The visible near-infrared (Vis-NIR) hyperspectral imaging technology was used to rapidly detect Tan mutton's total phenol concentration (TPC) content. The prediction mode and visualization of TPC content in Tan mutton were built and realized based on spectral information in combination with texture features. Firstly, the calibration set and prediction set were divided by 3∶1, and then multiplicative scatter correction (MSC), Baseline, De-trending, savitzky-golay (S-G), and Standard normal variate transformation (SNV), and Normalize were used for model optimization. Secondly, feature bands were obtained by competitive adaptive reweighted sampling (CARS), bootstrapping soft shrinkage (BOSS), interval variable iterative space shrinkage approach (iVISSA) and variable combination population analysis coupled with iteratively retained informative variables (VCPA-IRIV), respectively. Then textural feature variables for the first principal component image were extracted by gray-level co-occurrence matrix (GLCM), respectively. Finally, partial least squares regression (PLSR) and least-squares support vector machines (LSSVM) models were built and optimized to predict TPC content. The results showed that: (1) The PLSR model yielded promising results after De-trending-SNV preprocessing, and RC2 and RP2 were 0.793 2 and 0.874 9; (2) The 23, 35, 57 and 43 characteristic bands based on the original spectral were extracted by CARS, BOSS, iVISSA and VCPA-IRIV methods, respectively, accounting for 18.4%, 28%, 45.6% and 16.8% of the total bands; (3) The simplified BOSS-LSSVM model yielded good results in assessing TPC content (RC2vs. RP2=0.851 3 vs. 0.745 9, RMSEC vs. RMSEP=0.116 8 vs. 0.155 0); (4) Compared with predictive models based on characteristic wavelengths, the simply model BOSS-ASM-ENT-CON-LSSVM despited good results (RC2=0.850 0, RP2=0.770 9, RMSEC=0.116 0, RMSEP=0.144 7); (5) The simplified BOSS-PLSR model was displayed on the sample image in the form of pseudo-color to realize the visualization expression of TPC content.
Nov. 01, 2022Vol. 42 Issue 11 3631 (2022)
Hai-lan LIN, Zhong-ting HUANG, Yang CHEN, Tao YU, Yun-bo YANG, Jun-ping BI, and Pei LIU
Thallium, as a highly toxic heavy metal element, has strong accumulation, latency and mobility. The mining of thallium-containing deposits and the massive discharge of industrial three wastes can lead thallium to enter the surface environment, participate in the material cycle of the soil sphere, hydrosphere, atmosphere and biosphere, gradually enrich soil and water, and destroy the ecological environment. It will eventually endanger human health through the food chain. In recent years, thallium pollution emergencies in water quality have occurred from time to time. The analysis technology of thallium in the water environment has also become the research hotspot of thallium analysis technology. However, most of them focus on improving laboratory analysis methods, and there is little research on on-site monitoring of thallium in water quality. However, the laboratory analysis methods inevitably have pollution and loss in the process of transportation and preservation; It also leads to a certain lag in data timeliness, which is difficult to be applied to the emergency monitoring of thallium in water, which affects the analysis and disposal of pollution accidents and becomes the biggest bottleneck in the disposal of pollution accidents. In order to quickly and accurately respond to the on-site monitoring of thallium in water quality, the research on on-line monitoring technology in water quality has important application significance for thallium monitoring, which can realize the monitoring and early warning of thallium pollution in water and effectively reduce the risk of thallium poisoning caused by thallium pollution. A new monitoring technique of thallium in water quality based on the principle of the three electrode method is established in this paper. The instrument used in this method is small, portable and low-cost. It can be used not only for on-site monitoring of thallium pollution accidents but also for monitoring pollution sources and surface water risk. In this paper, the detection limit, accuracy, precision, method comparison and field application of the instrument are verified. The experimental results show that the detection limit of the method for the determination of thallium in water is 0.02 μg·L-1, which is consistent with the detection limit of the ICP-MS instrument; The relative error range of thallium standard solution is -5.5%~2.9%, and the range of relative standard deviation is 0.60%~6.2%, and the recovery of standard addition is 101%~127%. When the water sample content is above 0.08 μg·L-1, the method is comparable with laboratory ICP-MS in the field emergency monitoring and comparison, which shows that the technique is very applicable.
Nov. 01, 2022Vol. 42 Issue 11 3642 (2022)
Near-infrared spectroscopy (NIRS) technology integrated with Genetic Algorithm-Back Propagation (GA-BP) neural network was used to spectral sucrose-doped content in 162 tea samples in the NIR wavelength range of 1~2.5 μm. The parameters of the GA and BP neural network were optimized by the sample set to analyze the validity and redundancy of spectral bands. The raw data in the range of 1~2.5 μm was divided into 1~1.7, 1~1.3, 1.3~1.7, 1.7~2.5 and 2~2.2 μm sets. The established quantitative detection model was used to conduct model training on different wavelength bands at the same resolution. The prediction results show that, for the target content, data redundancy appears in both 1~1.7 and 1~2.5 μm bands. The model could be effectively extracted using only 1.3~1.7 or 1.7~2.5 μm band. The prediction model was also conducted using different spectral resolutions from 2 to 20 nm in the same band. In the wavelength range of 1~2.5 μm, the R was between 0.9 and 0.95 when the RMSEP ranged from 1.7 to 2.1. While in the wavelength range of 1~1.7 μm, the R was in the range of 0.9 to 0.93 when the RMSEP was between 1.95 and 2.25. The results indicate that, for the target content, redundancy exists in the 1~2.5 and 1~1.7 μm bands on both wavelength range and spectral resolution. Through the analysis of spectral features and modeling of the algorithm, the effectiveness of spectral data acquirement could be improved dramatically; for the detection of sucrose-doped content in tea, a much narrower wavelength range and lower spectral resolution could be adopted.
Nov. 01, 2022Vol. 42 Issue 11 3647 (2022)
© Copyright 2018-2021 | Chinese Laser Press.
All Rights Reserved 沪ICP备15018463号-20