


 View fulltext
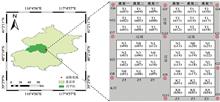
Accurate monitoring of above-ground biomass (AGB) is an important part of farm production management, so rapid and accurate estimation of AGB is important for the development of precision agriculture. Traditionally, AGB has been obtained using destructive sampling methods, which makes large-area, long-term measurements difficult. However, with the advancement of science and technology, UAV hyperspectral remote sensing has become the most effective technical means to estimate AGB of large crops because of its advantages of high mobility, high spectral resolution and map integration. In this study, the canopy hyperspectral images and actual AGB data of potato tuber formation, tuber growth and starch accumulation stages were obtained by carrying imaging spectrometer sensors on the UAV platform and drying and weighing method, respectively. Correlation analysis method (CAM), random frog method (RFM) and Gaussian process regression bands analysis tool (GPR-BAT) were used to screen canopy original spectra (COS) and first-order derivative spectra (FDS) for sensitive wavelengths, respectively, combined with partial least squares regression (PLSR) and Gaussian process regression (GPR) techniques to establish AGB estimation models for each fertility period and the estimation effects of different models were compared. The results showed that (1) the effect of combining the two regression techniques based on the characteristic wavelengths screened by the same method for COS and FDS to estimate AGB all changed from good to bad from the tuber formation stage to the starch accumulation stage. (2) Based on the characteristic wavelengths screened by the three methods of FDS respectively, the models constructed by homogeneous regression techniques are more effective than those based on COS accordingly. (3) The number of characteristic wavelengths screened based on COS and FDS using CAM, RFM and GPR-BAT methods were 28, 12, 6 and 12, 23, 10 at the tuber formation stage, 32, 8, 2 and 18, 28, 4 at the tuber growth stage, and 30, 15, 3 and 21, 33, 5 at the starch accumulation stage, respectively. (4) The effect of sensitive wavelengths for AGB estimation based on COS and FDS screened by three methods at each reproductive stage were GPR-BAT, RFM and CAM in descending order. (5) The models based on sensitive wavelengths screened by FDS through the GPR-BAT method at each fertility stage combined with PLSR were more accurate and stable with R2 of 0. 67, 0. 73 and 0. 65, NRMSE of 16.63%, 15.84% and 20.81%, respectively. This study shows that AGB can be accurately estimated using UAV hyperspectral imaging technology, which provides scientific guidance and reference for achieving dynamic monitoring of potato crop growth.
Sep. 01, 2021Vol. 41 Issue 9 2657 (2021)
Yi-jun SHEN, Zi-chen YANG, Ting-yu WANG, Cheng-wei WANG, Lei LI, and Guo-qing CHEN
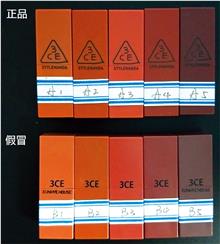
With the rise of e-commerce and the explosive growth of the beauty makeup market, lipstick products' safety become the focus of attention. In the face of the authenticity of brand lipsticks, the market detection method of cosmetics is single, and the characteristics of brand lipsticks are not targeted. In this paper, the spectral properties of a brand of true and false lipstick were studied using three-dimensional fluorescence technique and confocal Raman technique. According to the 3d fluorescence spectrum, the optimal excitation wavelength of all the five groups of lipsticks is about 320 nm, and the emission peak wavelength is about 372 nm (region Ⅰ). Among the six samples, A1, A2, A3, B1, B2 and B3, fluorescence with a central wavelength of about 400 nm will be emitted when the optimal excitation light wavelength is 230 nm. In A4, A5, B4 and B5 samples, the optimal excitation wavelength was redshifted to about 250 nm, and the fluorescence emission peak was redshifted to 450~470 nm (region Ⅱ). In addition, the optimal excitation wavelength of A5 is 550 nm, and the emission peak is near 590 nm. B1 also has a fluorescence peak excited at 270 nm and emitted around 292 nm (region Ⅲ). The relative fluorescence intensity method was used for quantitative analysis. If the fluorescence intensity of zone I was 1, the relative fluorescence intensity of zone Ⅱ and zone Ⅲ in different colors and between true and false lipsticks with the same color number were significantly different. Raman spectrum shows that there are vibration peaks of TiO2 in authentic lipstick and a large number of vibration characteristic peaks of organic functional groups such as C—C, C—N, —CH2 and —NH2. Compared with the real lipsticks, there are four specific vibration peaks in some fake lipsticks, namely 228, 447, 609 and 1 090 cm-1, which is consistent with the Raman peak of Fe2O3. The experimental results show obvious spectral differences between different lipstick colors and between true and false lipsticks of the same color.
Sep. 01, 2021Vol. 41 Issue 9 2665 (2021)
Research Progress on Evaluating the Effects of Nanomaterial-Based Development of Latent Fingerprints
Ming LI, Long NI, Meng WANG, Zhong-xu ZHU, Chuan-jun YUAN, and Jian WU
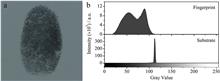
Researches on latent fingerprint development using novel nanomaterials including quantum dots, metal and metal oxide nanomaterials, rare-earth doped up- and down-conversion luminescent nanomaterials, carbon dots, metal-organic frameworks, and aggregation-induced emission materials have mushroomed in recent years, resulting in the emergence of nanomaterial-based development of latent fingerprints. Fingerprint development employing nanomaterials has some outstanding advantages such as simple operation, flexible approach, remarkable effect, and wide applicability, which can be served as an important supplement to the traditional techniques. So far, most studies have focused on discovering new nanomaterials and the advancement of new methods for latent fingerprint development. However, research on the influence factors and the comprehensive evaluations for the effects of fingerprint development still remains scattered and unsystematic. The accurate evaluation of fingerprint development effects is of great significance to the reasonable selection of developing methods and the objective assessment of physical evidence. In this review, we systematically summarized the evaluation methodologies on the effects of nanomaterial-based development of latent fingerprints from four aspects, namely, contrast, sensitivity, selectivity, and toxicity. In addition, the influence factors on the effects of latent fingerprint development were discussed in detail. It was summarized that the optical property of the nanomaterials had great effects on the developing contrast, the morphology and size of the nanomaterials had great effects on the developing sensitivity, and the adsorption performance and surface characteristic of the nanomaterials had great effects on the developing selectivity. At the end of this review, we also put forward some prospects for the nanomaterial-based development of latent fingerprints. From the perspective of developing materials, the nanomaterials should be involved in the transition from single luminescent property to multiple luminescent properties, from direct use of available nanomaterials to elaborate control of particle morphology and size, from simple surface treatment to targeted molecule modification, from toxic materials to non-toxic materials. From the perspective of developing strategies, the methods should be involved in the transition from strong background noise to weak fluorescent interference, from clear visualization of minutiae to distinct development of sweat pores, from physical adsorption mechanism to targeted molecule recognition, from effective development of trace evidence to nondestructive detection of biological evidence. While only focusing on improving the effects of fingerprint development, we also suggest researchers pay more attention to the evaluation of development effects, which will greatly promote fingerprint development techniques to play an important role in forensic sciences.
Sep. 01, 2021Vol. 41 Issue 9 2670 (2021)
Ya-xiong HE, Wen-qi ZHOU, Chuan KE, Tao XU, and Yong ZHAO
With the development of industrial technology, the requirements of online detection instruments and detection technology in gas detection are becoming higher and higher. Due to the complex changes in gas composition during gas flow, common detection methods such as Fourier Transform Infrared Spectroscopy (FTIR), Cavity ring-down spectroscopy (CRDS), and Electrochemical sensors often cannot meet the detection requirements or only Local area detection. Laser-induced breakdown spectroscopy (LIBS), as an emerging atomic emission spectroscopy analysis technology, has received extensive attention and research from researchers in the field of spectral analysis. LIBS has been applied to detect solids, liquids and gases because of its advantages of simultaneous detection of multi-elements, non-invasive, real-time on-line and no special preparation of samples. LIBS technology can accurately detect in the fields of harsh environments and high interference gas manufacturing and detection. The present paper introduces the basic principle of LIBS technology and two parameters describing the physical properties of plasma. For the application of LIBS technology in the field of gas detection, This paper introduces the recent development of LIBS technology in the field of gas detection at home and abroad from the following six aspects: Fuel equivalent ratio, the gas composition of fuel mixture combustion products, nitrogen and a rare gas, greenhouse gas and new energy gas detection, as well as related LIBS experimental equipment and experimental methods improvement and optimization. Finally, the prospect of laser-induced breakdown spectroscopy in the field of gas detection has prospected.
Sep. 01, 2021Vol. 41 Issue 9 2681 (2021)
Dong WANG, Ping HAN, Jing-zhu WU, Li-li ZHAO, and Heng XU
In this research, took the waxy corn seed “Jingkenuo 2000” as an example to research the identification of the the heat-damaged kernels of waxy corn seeds quickly and non-destructively and explore the effect of heat damage on waxy corn seeds. The multi-spectral imaging data of the control group and heat-damaged group were collected by Videometer near-ultraviolet-visible-short-wave near-infrared multi-spectral imager with embryo facing up and embryo facing down respectively. The single-point multi-spectral data from the embryo with embryo facing up, endosperm with embryo facing up and down were extracted respectively, while the multi-spectral data from the embryo and endosperm with embryo facing up were fused primarily. The standard deviations of all spectral variables were calculated after the baseline preprocessing to the multi-spectral data to analyse the effect of heat damage on waxy corm seeds according to the change of standard deviation of the data. Based on the multi-spectral data, the non-destructive identification models of the heat-damaged waxy corn seeds were developed by partial least square - discriminant analysis (PLS-DA) algorithm, which was compared with the models developed based on near-infrared spectra data. The result indicated that heat damage results in different effects on embryo and endosperm, however, the multi-spectral data and near-infrared data show the same trend of change. Based on the multi-spectral data, the identification models of the heat-damaged kernels of waxy corn seeds are developed. In the 3D scatter score plots of each model's first three principal components, the samples of the control group and the heat-damaged group show a certain separation trend. The accuracy of calibration data is between 96% and 100%, while the accuracy of cross-validation data is between 92% and 100%. The model developed by the fusion data of embryo and endosperm spectra with embryo facing up is of a higher accuracy, of which, the accuracy of calibration data is 100 %, and that of cross-validation data are between 98% and 100%. In contrast, the PLS-DA models of the heat-damaged waxy corn seeds are developed by near-infrared spectra data. In the 3D scatter score plots of the first three principal components of the models developed by the data of embryo facing up, embryo facing down, and the fusion of the two, the samples of the control group and the heat-damaged group show a good separation trend of which, the accuracy of the calibration and cross-validation are all 100 %. This research demonstrated that it is of good feasibility to identify the heat-damaged kernels of waxy corn seeds by near-ultraviolet-visible-short-wave near-infrared multi-spectral imaging technology rapidly and non-destructively. The standard deviation data of the multi-spectral variables are consistent with those of near-infrared spectral data. The calibration model by the fusion data of embryo and endosperm is of a higher accuracy for the multi-spectral data.
Sep. 01, 2021Vol. 41 Issue 9 2696 (2021)
Bin-bin ZHANG, Jing-bin LI, Shi-ning WANG, Peng-fei HE, and Xiao-qin ZHA
Lithium iron phosphate is one of the main industrial raw materials for the lithium-ion polymer battery industry. Compared with traditional raw material lithium cobalt oxides, lithium iron phosphate has significant advantages in specific energy, battery life, cost and environmental compatibility. Lithium iron phosphate, which is carbon composite cathode material for lithium-ion batteries, is selected as the research object. The content of lithium, iron and phosphorus was determined simultaneously by inductively coupled plasma optical emission spectrometry (ICP-OES). Sample digestion, analytical wavelength, parameters of instrument, solvent effect, background interference for analytical wavelength, accuracy and precision of the method had been discussed. Carbon composite lithium iron phosphate contains about 5% carbon. 0.100 g Sample was digested with 5 mL perchloric acid, heated the digestion solution to clarify visual, and continued heated the solution to smoke and repeated the operation twice as the sample could be digested completely. The sample digestion was checked by the three-dimensional (3D) video microscope. The visual clarify solution was checked by 30 magnification times. It showed that there still had an insoluble matter in the solution. After repeated the operation of added water and continue heated to smoke twice, checked digestion solution by 30 magnification times again; it showed that the sample had been digested completely. The digestion solution was transferred to a 100 mL volumetric flask, diluted to volume and mixed. The analytical solution was prepared as followed: diluted the constant volume digestion solution with the rate of 10:100 to a 100 mL volumetric flask. The best parameters of ICP-OES for this method were: High-frequency power, 1.1 kW. Atomizer flow: 0.8 L·min-1. Analytical wavelength, observe direction & observe height: Li610.365 nm-axial,Fe259.940 nm-radial/12 mm,P178.222 nm-axial,P213.618 nm-radial/12mm. Calibration solutions were prepared according to matrix matching with regent blank prepared with sample simultaneously, the preparation of calibration solution can minimize the solvent effect. For Li 610.365 nm, fast, automated curve-fitting (FACT) was used to eliminate background interference of Ar 610.564 nm. Under the optimal conditions, the analytical ranges were: Li, 1%~9%, Fe, 20%~40%, P, 10%~30%. The coefficient of the calibration curve, r>0.999 0. The relative standard deviation (RSD, n=7) was 0.35 %~1.01 %. The standard recovery rate was 91.2%~112%. Internal round robins (IRR) result was evaluated by F, t-test, the result showed no obvious difference between the test results of two operators. The method has promotional value for application in the lithium-ion polymer battery industry.
Sep. 01, 2021Vol. 41 Issue 9 2703 (2021)

Jun-peng BAI, Bin LI, Shu-juan ZHANG, and Yi-mei CHEN
The unreasonable use of antibiotics in poultry breeding has led to the frequent occurrence of antibiotic residues in poultry products, affecting food safety and posing a threat to human health. Therefore, accurate and rapid detection of antibiotic drug content is of great significance. This study successfully carried out larger and smaller gradient whole content detection of norfloxacin This study successfully carried out larger out based on terahertz spectroscopy. First, in the samples of higher-gradient norfloxacin, 11 concentrations were set in the range of 1%~100% to complete the preparation of high-gradient samples. Then the time spectrum was scanned by the terahertz time spectrum system, the absorption coefficient of the sample was extracted, and the Savitzk-Golay(S-G) binomial fitting filter was used to remove the noise and smooth the spectral data of the sample. It was found that the absorption coefficient of pure norfloxacin had a strong absorption peak at 1.205 THz and a weak absorption peak at 0.816 THz. Finally, stepwise regression and successive projections algorithm (SPA) is used to select variables and combine the characteristic absorption peak to realize the prediction analysis of multiple linear regression modeling. Further, in the study of smaller gradient norfloxacin samples, we set 29 concentration series below 100 μg·mL-1 (0.01%) to complete the preparation of smaller gradient samples. Then the terahertz time domain spectrum was obtained, the S-G binomial fitting filter was used for data preprocessing, and no significant difference was found in the absorption spectrum of each concentration. Finally, stepwise regression and SPA were used to select variables and combine the characteristic absorption peak to realize multiple linear regression modeling and prediction analysis. The results showed that the multiple linear regression of stepwise regression selection variable in the higher-gradient norfloxacin sample reached the optimal model (Rp=0.962, RMSEP=2.74%), and the accuracy was better than the existing optimal prediction model (Rp=0.867, RMSEP=16.6%). The multiple linear regression model of the stepwise regression selection variable of the small gradient norfloxacin sample is optimal (Rp=0.728, RMSEP=18.79 μg·mL-1). This method has a certain prediction ability, but its accuracy needs to be improved. In this study, terahertz spectroscopy was used to detect norfloxacin in full concentration, which provided a certain research basis for exploring norfloxacin detection limit and other further studies.
Sep. 01, 2021Vol. 41 Issue 9 2710 (2021)
Jie LONG, and Jiu-sheng LI
With the rapid development of terahertz technology and its application, the demand for various kinds of terahertz manipulation devices increases as one of the important components of the terahertz system, the terahertz wave phase shifter has become a research hotspot. The reported terahertz wave phase shifters have large size, complex structure and small phase shift problems. In order to overcome the above defects, we proposed a novel terahertz phase shifter based on a grating liquid crystal composite structure. It is composed of quartz layer, graphene layer, liquid crystal cell, grating structure, graphene layer and quartz layer. By changing the voltage on graphene, the refractive index of the liquid crystal can be varied, and the phase of the proposed terahertz phase shifter will change due to the change of refractive index. Then, the phase shift of the proposed terahertz wave phase shifter can be effectively adjusted by controlling the externally applied voltage. The simulation results show that the phase shifter achieves 400° phase shift in the frequency range from 0.39 to 0.46 THz, and the return loss is less than -11 dB. The maximum phase shift is 422° at a frequency of 0.43 THz. When the incident angle of the terahertz wave varies from 0 ° to 30 °, the phase shift of the proposed phase shifter remains unchanged. In addition, the device is insensitive to the polarization state of the incident terahertz wave. The designed terahertz phase shifter has the advantages of a large phase shift and small structure size. It has widespread applications prospects in the future terahertz communication, security inspection, medical, sensing, imaging, etc.
Sep. 01, 2021Vol. 41 Issue 9 2717 (2021)
Xu-dong SUN, and Jun-bin LIU
Chinese black tea is widely respected for its long-term cultural heritage and multiple health benefits. Black tea uses fresh leaves of tea trees as raw materials and is finished by finishing, kneading, drying, screening, and drying. These traditional techniques create a mellow, varied, and rich taste of the famous tea. However, the complex processing technology also increases the risk of physical pollution, and non-tea and foreign tea matter will inevitably be mixed during the processing. Physical contamination is a random event, accounting for 19.8% of food safety complaints. Physical pollution can only be reduced, and it is difficult to eliminate it. It is the key to future disputes between manufacturers and consumers and import and export trade. X-rays use the density difference between the food matrix and foreign objects to detect foreign metal objects effectively and extend to high-density plastics. Organic foreign bodies such as insects are still food foreign bodies that X-rays cannot detect. Insect foreign bodies are mixed with a high frequency, which causes sensory discomfort and easily introduces pathogenic bacteria. There is an urgent need to develop corresponding non-destructive testing methods. As an emerging detection technology, Terahertz time-domain spectroscopy (THz-TDS) technology has good application potential in non-destructive testing of agricultural products, food and medicines. THz has good low-energy transmission and fingerprint spectrum characteristics and has no ionizing radiation damage. It can obtain the spectrum and image information of hidden foreign objects through the food matrix. It is a better choice for non-destructive testing of agricultural products and food. In order to realize the high-efficiency detection of low-density organic foreign matter in tea, this paper explores a new method of the non-destructive detection of black tea-infested insect foreign matter based on THz spectroscopy. In the range of 0.2~3.0 THz, the THz spectra of black tea matrix, insect foreign matter, and black tea mixed with foreign insect matter were collected. The THz absorption coefficient and dielectric loss response characteristics of the tea matrix and insect foreign bodies are analyzed. From the spectrogram, it can be seen that there are significant differences between the THz absorption coefficient and dielectric loss of the tea matrix and the foreign insect bodies, mainly caused by the protein and fat of the foreign insect bodies. The ingredients are caused, laying the foundation for the THz spectrum detection of black tea mixed with insects and foreign bodies. However, the absorption coefficients of tea and insects have no obvious characteristic peaks, and there is more obvious noise in the high-frequency band of 2.0~3.0 THz. The principal component analysis method is used to reduce the dimensionality of the absorption coefficient and the dielectric loss. The score map shows that there is a clear difference between the black tea matrix and the black tea with insect foreign bodies, and the clustering effect of the absorption coefficient is better than that of the dielectric loss factor. The THz absorption coefficient and dielectric loss in the range of 0.5~1.0 THz were selected as input vectors, and support vector machine (SVM) and linear discriminant analysis (LDA) discriminant models were established. The experimental results show that the LDA discrimination model based on the THz absorption coefficient has the highest accuracy, and the correct recognition rate of new samples is 73.68%. It shows that applying THz time-domain spectroscopy for non-destructive detection of black tea inclusions of foreign insect bodies is feasible. At the same time, THz spectrum combined with pattern recognition algorithm provides a new method for non-destructive detection of tea inclusions of foreign insect bodies and can also provide a reference for other agricultural products and food detection.
Sep. 01, 2021Vol. 41 Issue 9 2723 (2021)
Geng-yin CHEN, Qi-hang ZHANG, Yu-zhu LIU, Yuan-zhe ZHANGCHENG, Yu CHEN, Guo-qing CHEN, Bo-yuan HAN, and Bumaliya ABULIMITI
As the main substance of air pollution, volatile organic compounds (VOCs) have attracted wide attention because of their strong destructive and physiological toxicity to the atmospheric environment. On-line detection of volatile organic compounds in the atmosphere is a very challenging work. In this study, laser-induced breakdown spectroscopy (LIBS) was combined with Raman spectroscopy to analyze volatile organic compounds from the perspective of atomic emission spectroscopy and molecular structure information, respectively. The elements contained in the air, such as Br characteristic lines and N, O, H were observed in the LIBS spectra obtained by in-situ online detection. The experimental results reflect the detection effect of o-fluorobromobenzene in the air. For the detection of bromine in the atmosphere, LIBS reflects the presence of bromine in the atmosphere and provides a good reference for the study of its reaction mechanism. The mechanism of CN and C2 radical molecules produced by high energy laser was analyzed. The laser pulse can ionize and decompose nitrogen in the air and benzene of o-fluorobromobenzene. The carbon atom in o-fluorobromobenzene reacts with nitrogen in the air to form a high-temperature plasma. The carbon and nitrogen atoms in the plasma can be combined freely to form CN radical and spontaneous emission. The molecular spectrum of spontaneous emission of the free radical can be collected by the optical spectrometer. The o-fluorobromobenzene molecule of the sample to be tested contains a benzene ring, and there are many carbon atoms in the molecule. Under the action of the intense laser, o-fluorobromobenzene is photodissociated, which is easy to form C2 radical molecule, and the spectrum of C2 radical, as shown in the figure is produced by radiation. We can know that C2 radical comes from benzene ring group in o-fluorobromobenzene sample through experimental verification and data analysis. As a supplement to the molecular structure information of volatile organic compounds, the on-line detection of volatile organic compounds was improved by introducing Raman spectra. On the basis of the experimental results of the sample Raman spectrum, the vibration mode and distribution are calculated and fitted with density functional theory (DFT).The characteristic peaks generated by the vibration are calibrated, and the characteristic spectral fingerprints are obtained. The four peaks (310, 833, 1 036, 1 244 cm-1) with higher intensity showed C-Br bond and C-F bond vibration characterization, especially the former two (310, 833 cm-1) had bromine and fluorine atom shifts at the same time, which could be used as the characteristic spectral fingerprint to identify the molecule. The experimental results showed that the combination of LIBS and Raman spectrum was applied to the VOCs on-line detection, which has reference significance and value in its related detection work.
Sep. 01, 2021Vol. 41 Issue 9 2729 (2021)
Zhong REN, Tao LIU, and Guo-dong LIU
In order to rapidly and accurately achieve the identification of the real or fake blood, as well as recycled usage of blood, the photoacoustic spectroscopy was used in this work to establish a set of blood photoacoustic detection systems and to capture the photoacoustic signal of blood samples. Three kinds of animal blood (horse blood, cow blood, and rabbit blood), two kinds of fake blood (props blood and red ink), the total number of blood samples are 125 groups, were used as the experimental samples. The photoacoustic signals and photoacoustic peak-to-peak spectral of all blood samples at 700~1 064 nm were obtained. Photoacoustic experimental results show that the amplitude, profile, peak-point time, and peak-to-peak values of real and fake blood samples are different. To achieve the classification and identification of the real and fake blood with high precision, we used the wavelet neural network optimized by a genetic algorithm (WNN-GA) to train the 100 groups of samples for five kinds of blood in full wavelengths. Moreover, a kind of Morlet-like wavelet basis function was built. Then, 25 groups of blood samples were tested. Meanwhile, the GA algorithm was used to optimize the weights and thresholds of WNN network and the shift factor and stretch factor of wavelet basis function, and two learn factors can be adjusted. Compared with WNN, the correction rate of classification and identification for real and fake blood based on WNN-GA improved by 24%. Then, the principle components analysis (PCA) algorithm was used to extract the characteristic information of real or fake blood from the photoacoustic peak-to-peak full spectral. After that, the chosen principle components were trained and test by the WNN-GA algorithm. Results show that under 6 principle components, the algorithm of PCA-WNN-GA algorithm improves the correction rate of classification and identification for real and fake blood to 100%. Finally, compared with other the six algorithms, the correction rate of classification and identification for PCA-WNN-GA was superior to others. Therefore, the classification and identification of the real and fake blood can be well achieved via photoacoustic spectroscopy combined with the PCA-WNN-GA algorithm.
Sep. 01, 2021Vol. 41 Issue 9 2734 (2021)
Hao-guang LI, Yun-hua YU, Yan PANG, and Xue-feng SHEN
In the qualitative analysis of near-infrared spectroscopy, preprocessing and feature extraction are indispensable to achieve good recognition results. Preprocessing is mainly to eliminate the influence of various interference factors on the spectral data. The common preprocessing methods include smoothing, first-order derivatives, normalization, etc., while the feature extraction methods can eliminate the irrelevant information in the data and retain the effective information. The common feature extraction methods include partial least squares, principal component analysis, linear discriminant analysis, etc. Different preprocessing and feature extraction methods have different characteristics. When building a qualitative analysis model, it is often difficult to achieve ideal results by using a single preprocessing or feature extraction method. It is often necessary to use a combination of multiple preprocessing and feature extraction methods to improve the model's performance. Variable parameters such as feature extraction dimension need to be set in each preprocessing and feature extraction process. These variable parameters have an important impact on the performance of the model. Therefore, multiple parameters need to be determined in multiple preprocessing and multiple feature extraction methods. In practice, the trial and error method is often used to find the optimal value of each parameter. In order to get the optimal value of one of the parameters, it is necessary to fix the other parameter values according to experience. Then a parameter to be optimized is substituted into the NIR qualitative analysis model for trial and error to get the corresponding parameter value of the optimal recognition rate of the model, and take it as the optimal value. After several parameters to be optimized are obtained one by one by trial and error method, the combination of parameters is set into the qualitative analysis model, and finally, qualitative identification is carried out. However, the combination of parameters obtained by the trial and error method is difficult to guarantee the optimal optimal solution. In addition to the trial and error method, the multiple loops nesting method can also be used to obtain the optimal combination of parameters in the preprocessing and feature extraction of the near qualitative analysis model. However, this method consumes a lot of computer memory and computing time and has the disadvantage of low efficiency. In this paper, a method based on particle swarm optimization (PSO) is proposed to optimize the parameters of pre-processing and feature extraction of the NIR qualitative analysis model, which can quickly obtain the optimal parameter combination of pre-processing and feature extraction and ensure that the qualitative analysis model with the optimal parameter combination has the best recognition performance. The experimental results show that the method is effective.
Sep. 01, 2021Vol. 41 Issue 9 2742 (2021)
Hao-guang LI, Yun-hua YU, Yan PANG, and Xue-feng SHEN
In the research of near-infrared spectroscopy (NIRS) qualitative analysis technology, the experimental objects mainly include liquid matter, powder matter and non-uniform solid particles. The liquid and powder materials are evenly distributed, and the spectrum collection and analysis are relatively easy. The non-uniform solid particles are different in size, shape and internal material distribution. Near-infrared spectroscopy of these samples contain the type information to be extracted in qualitative analysis and the individual difference information to be eliminated. Therefore, the analysis of non-uniform solid particles is more difficult than that of liquid or powder materials with uniform distribution. At present, there is no effective NIRS qualitative analysis method for non-uniform solid particles with different sizes and shapes at home and abroad. In this paper, non-uniform solid grain maize is taken as the research object. Based on the study of various spectral acquisition methods, the characteristics of non-uniform solid grain spectral acquisition are analyzed, and the spectral acquisition device for non-uniform solid grain is designed. In order to ensure the objectivity of the experimental results, Five pattern recognition methods such as Naive Bayesian classifier, k-nearest neighbor, support vector machine, BP neural network and Biomimetic Pattern Recognition were used to establish the qualitative analysis model of single grain maize by near-infrared spectroscopy in diffuse reflection and diffuse transmission mode, and the qualitative analysis models established in diffuse reflection and diffuse transmission mode were compared to analyze the effect of embryo orientation on the identification of single grain maize. The effect of the time interval between train and test sets on the identification accuracy under diffuse reflection and diffuses transmission is studied too. The experimental results show that the diffuse transmission model is not easily affected by the lying style of non-uniform solid grains, and the model has better generalization ability, which provides a feasible spectral acquisition method for subsequent research. Taking the non-uniform solid maize grain as the main experimental object, the research on its collection method and qualitative analysis model can provide a useful reference for the qualitative analysis of near-infrared spectroscopy of similar objects, which has important research significance.
Sep. 01, 2021Vol. 41 Issue 9 2748 (2021)
Dai-qing SUN, Li-rong XIE, Yan ZHOU, Yu-tao GUO, and Shao-min CHE
In order to improve the accuracy of the whole blood hemoglobin (Hb) concentration prediction model, the original whole blood transmission spectrum signals were first preprocessed by using centering, auto scaling, standard normal variate (SNV), multiplicative scatter correction (MSC), and Savitzky-Golay (SG) smoothing combined with MSC. And the best preprocessing effect was obtained with a R2 value of 0.9441 by using SG smoothing combined with MSC. The width of the SG smoothing window was discussed, and the optimal width is 27.The baseline shift of the whole blood absorbance signals was eliminated, and the signal-to-noise ratio was improved after data preprocessing. The 190 samples were divided into a calibration set (corresponding Hb concentrations from 10.6 to 17.3 g·dL-1) of 143 samples and a validation set (corresponding Hb concentrations from 10.3 to 17.3 g·dL-1) of 47 samples. The model's applicability was ensured when two sets have a similar distribution and range of Hb concentrations. And then, the Monte Carlo uninformative variable elimination (MC-UVE) was used to select the informative wavelength, which simplified the model structure and increased the proportion of useful wavelengths. When the Monte Carlo iteration number was 1000, 191 wavelength points were selected from the 700 wavelengths of the whole blood absorbance spectrum to build the whole blood Hb concentration partial least squares (PLS) model. Finally, a comparison was performed among the model based on the original whole blood transmission spectrum, the model based on the whole blood absorbance spectrum, the SG-MSC-PLS model, the SG-MSC-MC-UVE-PLS model and an existing model. In addition to this, the number of selected wavelengths based on MC-UVE was much smaller than the total number, but the predictive effect was much better, which was beneficial to improve the calculation efficiency of the model. The results indicate that the SG-MSC-MC-UVE-PLS method effectively increases the signal-to-noise ratio of the whole blood absorption spectrum signal and simplifies the model. Besides, our procedure's prediction accuracy and calculation efficiency of the model was improved by our procedure, which has reference significance for the development of hemoglobin concentration detection technology.
Sep. 01, 2021Vol. 41 Issue 9 2754 (2021)
Yuan FANG, Zhang-ping HE, Shi-chao ZHU, Xian-rong LIANG, and Gang JIN
Misusing the wrong grades polymer during the polymer processing in the same production line may lead to poorer product performance and a lower qualification ratio. The traditional methods identifying the grades from same kind of polymer are usually time consuming and hysteretic. There has not yet been discovered a fast and real time method for grade identification. In this work, 5 different grades of GPPS were the research object. An in-line near-infrared spectral measurement system installed on the extruder was developed. Near-infrared spectroscopy was combined with chemometrics and machine learning algorithms. The different grades of GPPS could be fast and in-line identified during the extrusion process. First, the in- line near-infrared spectra of GPPS melts of 5 different grades were collected in real time by the developed system with a spectral range of 900~1 700 nm. After spectrum analysis, a K-means clustering algorithm in combination with PCA was performed to verify the distinguishability of in-line near-infrared spectra for different grades. Last, PLS-DA and RF algorithm were used to establish the grade identification models respectively, and the identification ability of these two models was compared. The results show that: ①After baseline correction, maximum and minimum normalization, and 7-point moving average smoothing, the characteristic peak values at 1 207, 1 388, 1 407, 1 429 nm of the in-line near-infrared spectra change in a step-like manner with the change of grades. With the first three principal components scores as input variables, the clustering accuracy by K-means can reach 88%. It shows the distinguishability of the in-line near-infrared spectral data of different grades of GPPS; ②The two prediction models established by PLS-DA and RF can both effectively identify the grades of GPPS. The classification accuracy on the validation set of the PLS-DA model with the optimal principal components of 3 can reach 90.4%. The classification accuracy on the validation set of the RF model with the first five principal components as input variables can reach 95.6%. The RF model shows better grade identification performance than that of the PLS-DA model. Therefore, combined with chemometrics and machine learning algorithms, the in-line near-infrared spectral measurement system can realize the rapid and in-line identification of GPPS grades. It provides a reference for the in-line identification of different grades of the same kind of polymer by near-infrared spectroscopy in a production line.
Sep. 01, 2021Vol. 41 Issue 9 2759 (2021)
Yong HAO, Qi-ming WANG, and Shu-min ZHANG
Black heart disease is a physiological disease that occurs during the storage of “Yali” pears. The initial stage of the disease manifests itself in brown plaques on the inner core, but there is no difference in the appearance of the fruit from normal fruits, which seriously affects the storage time and quality of “Yali” pears. A fast and non-destructive testing method is urgently needed to escort the quality of “Yali” pears. The vis-near infrared spectroscopy method was used to explore the feasibility of online detection of “Yali” pear black heart disease, combined with principal component analysis (PCA), k-nearest neighbor (kNN), naive Bayes classifier (NBC), support vector machines (SVM), and integrated learning based on Adaboost modeling were used to identify “Yali” pear black heart disease. Standard normal variable (SNV), multiplicative scatter correction (MSC), Savitzky Golay first-derivative derivative (SG 1st-Der) and wavelet transform (WT) were used to preprocess the spectra. Adaboost integrates three base learners: kNN, NBC and SVM. A total of 285 samples, including 120 normal pears and 165 black hearted pears, divided into the training set and test set for model construction and evaluation. The harmonic average of the precision/recall rate (F-measure) and accuracy were used to optimize and evaluate the classification model. The results of the study show that the first three principal components of the spectrum of the samples of different attributes (normal and black heart) “Yali” pears were interlaced with each other, and it was difficult to distinguish the black heart pears visually. The F-measure and accuracy of the training set of the kNN model, in which the spectra of the samples were preprocessed by wavelet transform (the wavelet basis is “Haar”), were 78.98% and 82.62%, respectively. The F-measure and accuracy of the training set of NBC model after the Savitzky Golay first-derivative pretreatment were 80.90% and 82.11%, respectively. The F-measure and accuracy of the training set of SVM model after the wavelet transform pretreatment were 90.24% and 91.58%, respectively. The F-measure and accuracy of the training set of AdaBoost model after the wavelet transform pretreatment were 91.46% and 92.63% respectively. By verifying the model through the test set, it can be known that: the Adaboost classification model after the wavelet transform pretreatment was the best, and the F-measure reached 90.91%, which was 11.39%, 15.23% and 2.30% higher than that of WT-kNN model, SG 1st-Der-NBC model and WT-SVM model, respectively. Accuracy reached 92.63%, improved by 10.52%, 11.58% and 2.10% respectively. The calculation time of the model for the prediction of test set samples was about 0.12 s, which meets the requirements of online sorting. The combination of vis-near infrared spectroscopy and the AdaBoost classification method can provide a quick and easy analysis method for online detection of “Yali” pear blackheart disease.
Sep. 01, 2021Vol. 41 Issue 9 2764 (2021)
Juan-juan FU, Dan-ying MA, Jin-lan TANG, Yi-lin BAO, Yuan ZHAO, Lin-wei SHANG, and Jian-hua YIN
Osteoarthritis (OA) is a major medical disease that threatens the middle-aged and aged people's public health and quality of life. The early lesions of OA are mainly shown in the content changes of extracellular matrix components, which are difficult to detect by patients themselves, even the existing clinical and experimental methods. In recent years, Fourier transform near-infrared (FTNIR) spectroscopy has been used for the field of surgical navigation, non-destructive testing and various disease diagnoses due to its fast speed, low cost, ease of penetrating tissue to obtain spectral information, etc. Based on the above advantages, FTNIR technology was used to collect and analyze NIR spectra of healthy and multi-period OA articular cartilage at different depth zones (superficial zone, transitional zone and deep zone) in this paper. Then, principal component analysis (PCA) and Fisher discrimination algorithm (FDA) were combined for studying the influence of different preprocessing methods on discrimination results, the changes of matrix composition at different zones, and the diagnosis of multi-period OA. Compared to other two preprocessing methods (baseline correction, second-derivative cubic polynomials 25-point Savitzky-Golay smoothing) at same zone, the preprocessing of first-derivative quadratic polynomials 21-point Savitzky-Golay smoothing shows the best discrimination results, and the recognition rates at the superficial zone are as high as 95% and 90% for initial case and cross validation case, respectively. The discrimination results at the superficial zone are better than those at the transitional zone, and far better than those at the deep zone, which proves that the early lesions in OA mainly occurs at superficial zone. In the multi-period OA recognition, the recognition rates of initial case, cross-validation and prediction sets through optimized data by the FDA model are 100%, 93.3%, and 87.5%, respectively. The results indicate that the first derivative pretreatment of the NIR spectra combined with the PCA-FDA method can effectively identify whether the articular cartilage is diseased and which period it is, which is of great significance in study of monitoring OA and early diagnosis. NIR technology with the appropriate spectral analysis method can be applied to the in situ staging and early clinical diagnosis of OA.
Sep. 01, 2021Vol. 41 Issue 9 2770 (2021)
Qi CHEN, Tian-hong PAN, Yu-qiang LI, and Hong LIN
Taiping Houkui Tea, one of China's precious tea series, occupies an important position in public consumption and the tea market. The price of Taiping Houkui tea varies greatly from different geographical origins, and accurate geographical origin discrimination is currently an important factor in promoting the green tea industry. Sensory evaluation methods that rely on the manual experience are highly subjective and poor instability and cannot be applied to the actual analysis process. As the main detection and analysis method at present, the chemical analysis method is time-consuming and laborious. More importantly, there is currently no uniform standard for the geographical origin discrimination of tea. Near-infrared spectroscopy (NIR), as non-destructive testing and analysis method, has the characteristics of fast, non-destructive, and non-polluting. However, the types and contents of main components of Taiping Houkui tea from different origins are similar, which results in the same spectral peak distributions of various samples, and conventional analysis methods are limited for selecting feature variables. As one of the typical deep learning network models, convolutional neural network (CNN) has strong feature extraction and model expression capabilities. Based on the analysis of the spectral characteristics of Taiping Houkui tea from different geographical origins, the 1-dimension CNN (1-D CNN) is used to extract the NIR features, and a discriminant method combing NIR with 1-D CNN is explored to identify the geographical origin of Taiping Houkui tea in this work. In this paper, 120 samples were collected from 6 different geographical origins. The NIR were sampled from 10 000~4 000 cm-1 and preprocessed by standard normal variate (SNV). The sample is randomly divided into a training set (84, 70%) and test set (36, 30%), and the effects of CNN structure, convolution kernel size, activation function and other parameters on the analysis results were discussed separately. As a result, a 1-D CNN model with 9-layer was constructed for the geographical origin discrimination of Taiping Houkui tea. The principal component analysis (PCA) was compared, and the Monte-Carlo method was used to evaluate the stability and robustness of the proposed method. Compared with the prediction accuracy and standard deviation of the models based on original spectral data (40.57%, 7.06) and the PCA method (31.93%, 6.96), the prediction accuracy and stability of the 1-D CNN-based geographical origin discrimination model are higher, and the average prediction accuracy and standard deviation of the testing set are 97.73% and 3.47, respectively. The comparison results demonstrate the proposed 1-D CNN model can effectively extract NIR features and has the ability to identify the geographical origins of Taiping Houkui tea, which provides an effective method for the identification and traceability analysis of the geographical origin and production of valuable tea products such as Taiping Houkui tea.
Sep. 01, 2021Vol. 41 Issue 9 2776 (2021)
Zhen-hua TIAN, Jing-xuan HE, Ying WANG, Lian DUAN, and Cong-hu LI
Collagen was modified by oxidized carboxymethyl cellulose (OCMC) and then their interaction and thermal stability were investigated by two-dimensional infrared spectroscopy (2D-IR). One-dimensional infrared spectra showed that the positions and intensities of the main characteristic absorption peaks (amide Ⅰ, Ⅱ and Ⅲ bands) for collagen had no significant change upon cross-linking; additionally, all the absorption ratios of amide Ⅲ bands to 1 455 cm-1 (AⅢ/A1 455) of native and cross-linking collagen were close to 1.000. These results indicated that the triple helix of collagen was not demolished by the introduction of cross-linking. The 2D-IR spectra were constructed from OCMC amount-dependent infrared spectra, and then the interaction between OCMC and collagen was further analyzed. The response sensitivity and order of collagen structure and the groups of OCMC showed that electrostatic interaction formed firstly between carboxyl groups of OCMC and guanidine or amino groups of collagen. Then Schiff's base reaction occurred between aldehyde groups of OCMC and amino groups of collagen, which was the dominated interaction. As a result, the thermal stability of cross-linked collagen increased. With the increase of temperature, the red-shift of absorption bands and the decreased AⅢ/A1 455 value reflected that hydrogen bonds were weakened, and the unwinding of triple helix occurred for both native and cross-linked collagens; whereas the fewer changes in red-shift and AⅢ/A1 455 value for cross-linked collagen also confirmed the increase in thermal stability. Furthermore, the 2D-IR spectra were constructed from the temperature-dependent infrared spectra and provided information about the thermally induced structural changes. It could be conjectured that the triple helix was transformed into random coils for the native and cross-linked collagen, resulting in the loss of secondary structure with increasing the temperature. Nevertheless, the response sensitivity and order of the triple helix to temperature changed significantly. (1) For native collagen, the most temperature-sensitive structure was triple helix; whereas, it was random coils for cross-linked collagen, demonstrating that the triple helix of cross-linked collagen was less sensitive to temperature than that of native collagen. (2) Moreover, the response order of the triple helix for cross-linked collagen to the increased temperature lagged. It was illustrated that the stabilization of collagen by OCMC was due to the reinforcement of the triple helix.
Sep. 01, 2021Vol. 41 Issue 9 2782 (2021)
Jin-ge MA, Qiao-ling YANG, Xiao-jun DENG, Yi-yin SHI, Shu-qing GU, Chao-min ZHAO, Yong-ai YU, and Feng ZHANG
With the integration of the global food industry chain and the improvement of people's living standards, the proportion of imported vegetable oil in the daily diet has gradually increased. Olive oil with rich nutritional value has attracted much attention in vegetable oil products. During the cross-border transportation and customs clearance of imported bulk olive oil, due to the influence of factors such as environment, temperature and time, the unsaturated fatty acids in the olive oil transported in storage may be oxidized. The pulp residue in the virgin olive oil may precipitate in The accumulation of multiple warehouse exchanges has resulted in large differences in the quality of vegetable oil in different locations of the olive oil warehouses and in the same warehouse, which has caused great difficulties for the on-site sampling supervision and quality evaluation of olive oil ports. In response to the need for rapid quality evaluation of bulk olive oil on-site, this paper converts the Raman response intensity into a vector space angle value based on the partial least square method, establishes an olive oil quality index analysis and prediction model, and conducts olive oil based on samples from different sampling points. The fast on-site prediction of quality ensures the precise supervision of bulk olive oil in the import and export links. Firstly, the traditional method is used to measure the acid value, peroxide value and linolenic acid value of olive oil heated for different durations at 220, 240 and 260 ℃ respectively. At the same time, a portable Raman spectrometer is used to detect the corresponding oil sample. Mann spectroscopy, preprocessing the spectral data by means of smoothing filtering and derivation, combining the partial least squares method and the angle measurement method to model and analyze the acid value, peroxide value, and linolenic acid of olive oil. The correlation coefficients of the index models established by the method are all above 0.99, and the relative error range of the angle measurement method does not exceed -5.43%. Seven different samples were randomly selected from imported bulk olive oil for verification. The root means square errors of the three models established by the angle measurement method were 0.025 8, 0.222 8, and 17.064 1 respectively, and the relative error range was -4.71%~5.98%. The results show that the model established by the angle measurement method is more accurate, with better predictability and stability. This method can be applied to the on-site rapid quality identification of imported bulk olive oil quality, improve the quality evaluation of the port on-site supervision link, and provide technical guarantee for the comprehensive evaluation of imported and exported bulk olive oil quality.
Sep. 01, 2021Vol. 41 Issue 9 2789 (2021)
Rui-rui ZHANG, Wei-qian ZHAO, Yun WANG, and Li-rong QIU
Confocal Raman microscopy can realise quantitative, nondestructive, and unlabeled imaging for sample microregions and obtain molecular structure characteristics. The time consumption of the confocal Raman microscopy system always lasts up to several hours or even tens of hours. During the time-consuming measurement process, it is highly vulnerable to some disturbing factors. These factors lead to the system's shift and make the sample out-of-focus, which results in poor imaging quality. This paper proposes a high-stability confocal Raman microscopy based on bilateral fitting subtraction to solve the above issues of the existing confocal Raman microscopy. Firstly, the proposed method utilizes the linear fittings about the data areas on both sides where the axial response of the confocal Raman spectral intensity curve is sensitive to the defocus of the sample position. The expressions of the two equations about the linear fittings are obtained. Secondly, through subtracting these two expressions, a differential expression can be obtained. The zero-crossing of the differential expression is the focal plane position of the confocal Raman microscopy. Monocrystalline silicon is used to test the focusing repetition accuracy of the proposed method. The monocrystalline silicon surface is axially scanned with a scanning pitch of 100 nm and the experiment is repeated 60 times. The results show that the maximum difference is 80.2 nm, which indicates that the proposed system exhibits a strong anti-drift ability. We also performed a Raman mapping imaging test on a standard atomic force step sample with a bar lattice of a period of 5 m. Compared with the image obtained by the confocal Raman microscopy without auto-focusing ability, the image obtained by the proposed confocal Raman microscopy is clearer, and the edge of the image is sharper as well, as a high signal-noise ratio. The simulation analysis and experimental results show that the proposed confocal Raman microscopy based on the bilateral fitting subtraction method can improve the focus ability and suppress the defocus effect caused by interference factors on the image quality. The proposed method provides a guarantee for obtaining a confocal Raman spectrum image with high stability and offers a new avenue of Raman spectral imaging method for automatic focusing and anti-drift.
Sep. 01, 2021Vol. 41 Issue 9 2795 (2021)
Xing-hu FU, Zhen-xing WANG, Shuang-yu MA, Fei ZHAO, Xin LU, Guang-wei FU, Wa JIN, and Wei-hong BI
In this paper, a silver modified micro-cavity fiber surface-enhanced Raman scattering (SERS) probe was proposed. Using Rhodamine 6G (R6G) solution as the probe molecule, the wet detection method was used to place the fiber SERS probe directly into R6G, and the far-end experimental performance of the prepared fiber SERS probe was studied. A micro-cavity fiber structure was fabricated by etching of hydrofluoric acid (HF). By controlling HF's etching time, a series of fiber structures with different etching times and different micro-cavity lengths were obtained. The effect of the length of the micro-cavity on the fiber SERS probe's performance was studied experimentally. The R6G with a 10-3 mol·L-1 concentration was used as the probe molecule. The mixing of the nano silver sol and the R6G was continuously optimized, and the structure of bare fiber micro-cavity was used for Raman detection of the mixed solution. It was found that the Raman signal was highest when the mixed order and the ratio of the mixed solution were the equal volumes of nano silver sol and R6G solution. The obtained mixed solution was used to find the -fiber micro-cavity structure parameters when the Raman signal enhancement effect was the highest. The experimental results showed that under the same experimental conditions, when the fiber's etching time was 5 minutes, the fiber micro-cavity structure had the best Raman signal enhancement effect. The average length of micro-cavities observed under the microscope for multiple sets of fiber was about 81 μm. For the obtained fiber micro-cavity structure, a series of silver nanofilm/multi-mode fiber (Ag/MMF) composite materials were fabricated by the magnetron sputtering technology with a controllable preparation process. When the magnetron sputtering time was 10 minutes, the fiber SERS probe (Ag/MMF-10) was obtained. In the experiment, deionized water was used to prepare different concentrations of R6G solutions. Using different concentrations of R6G as probe molecules, the remote detection limit (LOD) of the Ag/MMF-10 was as low as 10-7 mol·L-1. The detection of Raman signal reproducibility of Ag/MMF-10 showed that the relative standard deviation (RSD) of each characteristic peak was less than 10%. Simultaneously, the analytical enhancement factor (AEF) of Ag/MMF-10 to R6G with 10-6 mol·L-1 concentration can be as high as 2.64×10⁶. The experimental results showed that the Ag/MMF-10 had high sensitivity and good reproducibility. Therefore, the fiber SERS probe may have potential application value in trace detection, such as biomedical detection, chemical analysis of pesticide residues.
Sep. 01, 2021Vol. 41 Issue 9 2800 (2021)
Ming-bo LIU, Xue-liang LIAO, Da-wei CHENG, Zi-yue NI, and Hai-zhou WANG
In the analysis of spectrum for energy dispersive X-ray fluorescence (EDXRF), if the contentof elements is not high in the sample, the peak will keep its original shape as the pure element, peeling the spectrum of pure elements is a good way. Meanwhile, the linear relationship between peak intensity and element content is reliable, and the quantitative analysis is accurate. But in constant analysis, there usually has obvious absorption and enhancement effect between elements, which lead to a different spectrum for the element in the mixed sample compared with pure element spectrum, hence, usingthe fixed shape of pure element spectrum peeling methods will have greater deviation.At the same time, the linear relationship between peak intensity and element content will be disturbed by the absorption enhancement effect.The superposition of the two factors leads to the inaccuracy of element quantification. Therefore, in constant analysis, the simple spectral peeling method is not suitable.This article introduces a full spectrum fitting quantitative algorithm based on the Fundamental Parameter (FP) method, which can fit the spectrum accuratelyandrealize the quantitative calculation at the same time. The process is as follows: firstly, the measured intensity for each line was obtained base on pure element peeling method,and which was used to estimate the content for elements in the sample, and then the theoretical intensity of each spectral line was calculated in the sample using FP method. The element content was adjusted according to the deviation of the measured value, and the two processes of “FP calculating content Adjusting” were iterated until the intensity of the calculated spectrum has no different from the measured spectrum.The obtained sample composition was used to calculate the shape of spectrum intensity for each element. In the meantime, the pure element spectrum was modified. And the steps of “peeling spectrum-estimating content-iterating FP calculation” was repeated. After that, the final element content was considered the test result. This method was used to analyze La/Ce/Pr/Nd spectra in mixed solution samples for about 250 g·L-1 based on EDXRF. The residual error between the calculated spectra and the measured spectra was reduced to 474.5, which was less than the 1 415.0[1] for using the pure element spectral stripping method alone. The method is applied to the determination of several rare earth mixed solutions with the partition content ranging from 0% to 90%, and the deviation of each element in each sample is less than 1%. For a successive test, each element's relative standard deviation (RSD) was less than 1%. The actual measurement shows that the accuracy and stability of the method are good, which can well meet the needs of the rare earth hydrometallurgy industry.
Sep. 01, 2021Vol. 41 Issue 9 2807 (2021)
Ya-bing WANG, Shang-kun SHAO, Xue-peng SUN, Xiao-yun ZHANG, Hui-quan LI, and Tian-xi SUN
The focal spot size and depth of the X-ray source are crucial parameters for X-ray spectroscopy, especially for micro X-ray diffraction and micro X-ray fluorescence. Determining these parameters efficiently and accurately is important for the application and development of the X-ray source. The existing methods for determining these paraments of X-ray source all have their limitations, especially for determining the micro focal spot X-ray source. The tapered glass monocapillary X-ray condenser (TGMXC) is a common X-ray focusing device. According to the filter property and the geometrical characteristics of the TGMXC, the conclusion that the energy upper limit of the focused X-ray of the TGMXC is affected by the focal spot size of the X-ray source can be obtained. The relation between the energy upper limit of the focused X-ray of the TGMXC andthe focal spot size of the X-ray source, and the distance between the TGMXC and the focal spot of the X-ray source was proposed. A method of determining parameters of the X-ray source based on TGMXC was designed. Measuring and determining the parameters of the TGMXC and placed the TGMXC in front of the measured X-ray source to form a focusing X-ray path. In the case that the focusing X-ray path is collimated and ensures that only the single reflected focused X-rays, TGMXC is detected, though changing the distance between the X-ray source and the TGMXC and using the energy spectrum detection system to obtain the corresponding focused X-ray energy spectrums. Though calculating and analyzing the energy spectrums, the maximum energy of each spectrum, namely the energy upper limit, is obtained. The focal spot size and the focal depth can be obtained simultaneously using the above relation and linear fitting. Parameters of a micro focal spot X-ray source with a Mo target were determined by this method. The manufacturer gave the focal spot size and focal depth as about 60 μm and 20 mm and were obtained by this method as 60.1 μm and 19.7 mm, respectively. The conventional pinhole imaging method was also used to determine this X-ray source, and the results were 60.3 μm and 20.1 mm, respectively. Compared with existing methods, this method can determining the micro focal spot X-ray source and has potential practical value and development for determining the high-energy X-ray source.
Sep. 01, 2021Vol. 41 Issue 9 2812 (2021)
Yu LIU, Zeng-wei LI, Zhi-peng DENG, Qing-xian ZHANG, and Li-kou ZOU
In recent years, food safety accidents by microbial contamination is a considerable threat to health. The rapid detection of microorganisms is of great significance to food safety. At present, the rapid microorganism detection technology is a difficult operation and high cost. Laser-induced fluorescence spectrometry (LIFS), with the advantages of high sensitivity, convenient operation, relatively cheap equipment, could provide a potential technique for rapid detection of microorganisms. In this paper, we use a portable 405 nm laserto excitefluorescence of three common foodborne pathogenic bacteria (Enterococcus faecalis, Salmonella Typhimurium and Pseudomonas aeruginosa), and a fiber spectrometerto detect the spectra. By adjusting the laser power (10~100 mW) to get the fluorescence intensity of Enterococcus faecalis, the relationship between the laser power and bacterial fluorescence intensity has been verified, and the result showed the optimal laser power range of 50 to 80 mW. In this experiment, the fluorescence spectra between bacterial samples are obtained at P=50 mW. We discussed the relationship between bacterial structure and fluorescence spectra. According to the research result, It was concluded that E. faecalis exhibited a fluorescence peak of flavonoid groups near 528 nm, and the fluorescence peak at 634 nm of P. aeruginosa corresponds to the fluorescence emission of protoporphyrin. The results showed that, (1) the fluorescence peaks at 634 and 703 nm of P. aeruginosa for excitation are different from other two bacteria, which can be a feature for direct detection; (2) based on statistics, the spectrum of E. faecalis and S. Typhimurium was divided into 9 characteristic areas, and the recognition rate of the two bacteria reached 100% detected by the dynamic clustering method. The results show that the laser-induced fluorescence spectrometry can effectively detect P. aeruginosa, E. faecalis and S. Typhimurium. Compared with other rapid detection techniques, LIFS has significant application value for the rapid detection of foodborne pathogenic bacteria with the easier operation, faster detection speed and higher recognition rate.
Sep. 01, 2021Vol. 41 Issue 9 2817 (2021)
Yu-xuan ZHU, Jing-bin LU, Xiao-fan ZHAO, Xiao-yan LIU, Wei-wei CUI, Wei LI, Yu-sa WANG, Zhong-hua LÜ, and Yong CHEN
Hard X-ray Modulation Telescope (HXMT) is China's first X-ray astronomical satellite. Low Energy X-ray Telescope (LE) is one of the HXMT's payloads, which used a special swept charge device (SCD) CCD236 detector to observed photons in an energy band of 0.7~13.0 keV. The CCD236 detectors need to be calibrated well before the launch of HXMT, including the calibration of the energy response matrix, which is the key to energy spectrum analysis. The output spectrum of CDD236 is not the actual emission spectrum of the observation source but the convolution result of the emission spectrum and the energy response matrix (RSP). Generally, we can apply a direct deconvolution method to restore the spectrum of the source. A general deconvolution algorithm is the Lucy-Richardson iterative method which uses the Bayes theorem of conditional probability to carry out repeated operations. Using this method, one can use the RSP to deconvolute with the output spectrum, and restoration of the actual spectrum can be obtained by this method. The spectrum of 55Fe radioactive source can be restored using LR iterative algorithm for verifying the robustness of this method. After the iteration, the energy resolution is optimized from 144.3 to 65.6 eV @5.9 keV, and the continuous plateau is obviously suppressed. The restoration spectrum, which is composed of two Gaussian peaks with very narrow FWHM, can well characterize the structure of the real emission X-ray of 55Fe. At the same time, the X-ray fluorescence spectrum of a composite was inversely solved by this method, and the X-ray fluorescence spectrum of the material was reproduced by iteration. The FWHM of each spectrum line was very small, and the main spectrum line of Ag element in the material was changed into an independent line spectrum by iteration. This kind of inverse energy spectrum can be well used for the analysis of element composition.
Sep. 01, 2021Vol. 41 Issue 9 2823 (2021)
Lin XU, Hong-yuan HE, Cui-mei LIU, and Zhen-dong HUA
In this study, the infrared (IR) and Raman spectra of 28 kinds of fentanyl-class substances were analyzed. The spectrum characteristics and the distinguishing ability of IR and Raman for fentanyl-class substances were investigated. On the whole, IR and Raman spectra of fentanyl compounds showed different spectral characteristics and were complementary. For IRspectroscopy, different salt forms of fentanyl-class substances showed significant differences in the range of 3200~2 000 cm-1. The base-form compounds showed strong absorption peaks at 2 972~2 952 cm-1, the hydrochloride compounds showed multiple absorption peaks with medium intensity at 2 600~2 320 cm-1, and the citric acid compounds showed broad absorption peaks with moderate intensity at 3 100~2 800 cm-1. In addition, the IR spectra all showed a strong absorption peak caused by the stretching vibration of C=O bond at 1 750~1 630 cm-1, and a strong single or double peaks caused by the bending vibration of the benzene ring at 710~680 cm-1. For Raman, all types of fentanyl-class substances showed a strong Raman peak at 1 001~1 002 cm-1, which was caused by the in-plane bending vibration of C—H bond on the benzene ring. In the Raman spectra of substituted compounds containing alkyl, phenyl and tetrahydrofuran groups, the peak at about 1 000 cm-1 was the base peak, and the intensity of other peaks was all lower than 30% of the base peak. For Raman spectra of substituted compounds containing fluorine, furan and sulphur groups, there were other high-intensity peaks besides the base peak at about 1 000 cm-1. IR spectrum can distinguish all fentanyl-class substances, even for certain structural analogues with high spectrum similarity. When there is no fluorescence interference, Raman spectra are distinguishable for all fentanyl-class substances. The Raman spectra for homologues with differences in only a methyl group and regioisomers with methyl substituted at different positions were found to be highly similar; however, their spectra demonstrated small but detectable differences. Both the Infrared and Raman methods were simpler, more rapid, less expensive, non-destructive, and fit for in-field testing. Raman may be used non-invasively, minimizing exposure to potentially dangerous substances; however, its fluorescence based problem sometimes affects its usefulness. Compared with Raman, IR shows no fluorescence interference, higher spectrum consistency, and a more complete commercial spectrum library, which is the preferred method for rapid qualitative analysis of fentanyl-class substances in-field.
Sep. 01, 2021Vol. 41 Issue 9 2829 (2021)
Chang-hu YANG, and Jian-hui YUAN
X-ray diffraction spectrum, Raman spectroscopy and UV-Vis transmission spectroscopy are important techniques for detecting thin films. By analysing these spectral properties, we can obtain the information of the phase, crystal structure and light transmission properties of the films. The films with different thicknesses were prepared on a quartz glass substrate by sol-gel and spin coating method. The X-ray diffraction, Raman spectroscopy and UV-Vis transmission spectrum detection of the samples were carried out. Firstly, the X-ray diffraction shows that the films exhibit peak (002) crystal plane. The ZnO thin films are hexagonal wurtzite structures and grow along the c-axis preferred orientation. With the increase of the film thickness, the (002) peak is enhanced, and the grain size of the ZnO grows with the increase of the film thickness. Scanning electron microscopy analysis of the film's surface morphology also shows that the film surface is compact and uniform, with nanocrystalline structure and obvious hexagonal shape. Secondly, the Raman spectrum detection shows that 437 cm-1 Raman peak appears in all samples, which is the characteristic Raman peak of the ZnO wurtzite structure. With the increase of film thickness, the intensity of 437 cm-1 peak also increases, which further indicates that the crystallization of film is strengthened with the increase of film thickness. Finally, It is found that the absorption edge of the film has a certain redshift with the increase of the film thickness based on that of the UV-Vis transmission spectrum. The transmittance of the film in the visible region decreases slightly with the increase of the film thickness, but the average transmittance is above 90%. On this basis, the further theoretical calculation of the experimental results shows that the change of thickness has little effect on the refractive index of the film samples, but the bandgap width becomes narrow with the increase of the thickness of the film. However, the bandgap width of undoped ZnO films is larger than the theoretical value of 3.37 eV. Further analysis shows that the change of ZnO film thickness is positively related to the change of ZnO grain size. Essentially, the change of absorption edge or optical band gap is caused by the change of ZnO grain size.
Sep. 01, 2021Vol. 41 Issue 9 2835 (2021)
Yuan DAI, Ji-zheng XIE, Jing YUAN, Wei SHEN, Hong-da GUO, Xiao-ping SUN, and Zhi-gang WANG
In view of the increasingly serious organic pollution of urban waterbodies, this paper proposes a water quality indexes prediction model based on excitation-emission matrix (EEM) fluorescence technology and a method for quickly judging the water quality category. In this study, a large number of diversified surface waters around Yangzhoucity were taken as the training sample of the model. Based on the EEM spectrum of water and linear support vector regression (LIBLINEAR), the prediction models of six water quality indexes were established, including chemical oxygen demand (CODCr) and permanganate index (CODMn) , ammonia nitrogen (NH3-N), total phosphorus (TP), total nitrogen (TN) and five-day biochemical oxygen demand (BOD5). The test results show that the determination coefficient R2 of the training set and the test set of the six index prediction models are both greater than 73%, while the correlation coefficient between the predicted value and analysis results by the national standard and industry-standard methods is greater than 0.9. Base on the prediction results of the water quality index, the water quality category could be the further judge. The recognition rate of black-odor waterbody reached 86%, and the classification accuracy rate of water bodies above category Ⅲ was 60%. The results show that the method has good accuracy and precision in predicting the water quality index through the three-dimensional fluorescence spectrum information of the waterbodies, which provides a solution for the efficient in-situ monitoring and rapid classification of water quality of urban and surrounding surface water.
Sep. 01, 2021Vol. 41 Issue 9 2839 (2021)
Yan LI, Dan WEI, Wei WANG, Liang JIN, Jian-li DING, Shan-shan CAI, Yu HU, and Yang BAI
Dissolved organic matter (DOM) plays an important role in transforming organic matter into inorganic matter in the natural ecosystem. DOM can provide nutrition and energy for microorganisms and has an important role in indicating the transfer and transformation of humus. Cow dung can improve the humification efficiency of corn straw, which makes better use of agricultural waste. In order to study the characteristics of DOM in the fermentation process of corn straw-cow dung, which were treated with 2:8 (T1), 4:6 (T2), 6:4 (T3) and 8:2 (T4), we adopted three dimensional fluorescence spectrum - parallel factor analysis method to analyze the fluorescence components of DOM in the fermentation substrate. Fluorescence index (FI) and biological index (BIX) were used to analyze the source of DOM; humification index (HIX) was used to characterize the humification degree of fermentation, and the correlation among the maximum fluorescence intensity of DOM components was analyzed. The results showed that the sources of DOM were influenced by both autochthonous and allochthonous sources (FI>1.4, 0.8fulvic-like acid>humic-like acid. There was a significant positive correlation between fulvic-like acid and humic-like acid. Based on these, according to the DOM fluorescence spectroscopy characteristics, to improve the utilization rate of straw in the fermentation process, the ratio of straw and cow dung is 6:4, which can be used as the reference value of actual composting.
Sep. 01, 2021Vol. 41 Issue 9 2846 (2021)
Ming-jie SHAO, Wen-ke LIU, Cheng-bo ZHOU, Qi WANG, and Bao-shi LI
As the largest band of light absorption of plant photosynthetic pigment, the red and blue spectrum is the main function spectrum of plant photosynthesis, and red-blue LED has become the mainstream light source of plant factories. The response of plants to red-blue light and its mechanism needs to be explored. In this study, effects of high light duration and alternating frequencies of high light supplied with red-blue LEDs on growth and nutrient element content as well as accumulation of hydroponic lettuce were conducted using ICP-AES analysis technology in an artificial plant factory. Five treatments were set up in experiment 1: high light (500 μmol·m-2·s-1) was irradiated for 0 h (CK), 0.5 h (HL0.5), 1 h (HL1), 2 h (HL2) and 4 h (HL4) in the middle of the light period (150 μmol·m-2·s-1), respectively. In experiment 2, set up one conventional treatment (NL, 170 μmol·m-2·s-1) and four alternate light treatments, in which 1 h high light was separated into four different alternating frequencies: one time (A1), three times (A3), six times (A6) and twelve times (A12). The light quality (4R:1B), photoperiod (16/8 h), and treatment days (20 days) were the same in the two experiments. The results showed that the biomass production and the accumulation of nutrients of lettuce such as N, C, P, K, Ca, Mg increased first and then decreased with the increase of high light duration. Compared with the CK, the root dry and fresh weight, and specific leaf weight of lettuce grown under HL4, increased significantly, and the leaf area decreased significantly. The dry weight of lettuce and the accumulation of N, C, P, K, Ca and Mg were the highest under HL2. Compared with NL treatment, A6 significantly reduced the fresh weight and increased the root shoot ratio of lettuce, but there was no significant difference among other treatments. The alternating light treatments significantly increased the C element content of lettuce, but the alternating frequencies of high light had no significant effect on the biomass production and the accumulation of nutrient elements. In conclusion, applying a short-term continuous high light irradiation in the middle of the light period can effectively improve the accumulation of nutrients and biomass production in lettuce and is more suitable for lettuce cultivation in plant factories.
Sep. 01, 2021Vol. 41 Issue 9 2853 (2021)
Plant hormone Abscisic Acid (ABA) is a small molecule of an organic signal produced by the plant's own metabolism and can produce an obvious physiological effect to the plant itself in very low concentrations. ABA is one of the five endogenous hormones in plants, named for its ability to promote leaf shedding and mainly exists in the plant's withered leaves, roots, seeds etc. Because of its ability to regulate plant growth, ABA has a great prospect of agricultural engineering. However, the concentration of ABA in plants is deficient, so the detection of ultra-low concentration is the key to the application of ABA. As for the detection of ABA, there are many detection methods reported in the literature, but as far as we know, the theoretical and experimental studies on ABA by Raman spectroscopy have not been reported. Raman spectral technology has the advantages of simple sample pretreatment, fast analysis speed, low requirements for the detection personnel, and more suitable for in-situ and in-situ detection. Therefore, the experimental and mechanistic study of ABA Raman spectroscopy can provide a reliable basis for detecting and identifying plant hormones. In this paper, the molecular structure of ABA was optimized by software Gaussian09 and GaussView5. 0, and the molecular energy level, Front orbit, Raman spectrum, Infrared spectrum and Nuclear magnetic resonance spectrum of ABA were calculated. In order to verify the accuracy of theoretical calculation, the IR, Raman, SERS and NMR spectra of ABA molecules were tested. The results show that: ABA Raman characteristic peak theory calculated value at 616, 1 056, 1 272 and 1 689 cm-1, experimental measured Raman characteristic peak in 612, 1 048, 1 272, 1 635 cm-1, SERS experiment to obtain the characteristics peak is located at 598, 1 032, 1 268, 1 625 cm-1, the theoretical calculation and experimental results are in good agreement. At the same time, the infrared and Raman peaks of ABA were identified in the range of 400~4 000 cm-1, and the molecular oscillation modes of the ABA producing Raman spectrum at the corresponding Raman frequency shift were pointed out. The most substantial Raman peak of 1 635 cm-1 was mainly caused by the stretching motion of the C=C bond and the C—C bond of ABA molecules, among which the stretching vibration of the C=C bond caused the most intense Raman scattering. Finally, atomic attribution and relative atomic displacement were analyzed, and the molecular structure of ABA was further studied according to comparing the calculation with the experimental nuclear magnetic resonance spectrum of ABA. What had done in the paper provided some experimental reference and theoretical basis for the trace detection of ABA.
Sep. 01, 2021Vol. 41 Issue 9 2859 (2021)
Wei LIU, Qiang YU, Teng NIU, Lin-zhe YANG, Hong-jun LIU, and Fei YAN
Heavy metal pollution constitutes one of the most urgent problems in soil environmental pollution, as plants become enriched in heavy metals through the soil, which endangers human health and poses a great potential danger to the ecological environment. The monitoring over heavy metal pollution in soil by traditional chemical methods is time-consuming and laborious and limited in scope. However, the method for monitoring heavy metal in soil leveraging hyperspectral vegetation technology is capable of quickly and accurately obtaining the heavy metal content in the soil, breaking through the vegetation barrier, and making the monitoring more efficient. Providing an important reference for the monitoring over and early warning of heavy metal elements in soil, this method matters for achieving the goal of constructing ecological civilization into a higher level and improving the quality of arable land. In this study, peach trees, the dominant economic fruit tree in Beijing, were research targets. 50 sampling points were evenly set up in the study area, and the spectral data of peach tree leaves were measured by using FieldSpec 4 portable ground wave spectrometers, while soil samples were collected and brought back to the laboratory for testing and analysis to obtain the data of heavy metal content in the soil. Efforts were made to analyse the leaf spectral characteristics of peach tree leaves under the stress of heavy metals in soil in different kinds of pollution and investigate how different soil heavy metals are correlated with leaf spectra through calculation. It was determined that element As in soil had a higher correlation with spectral reflectance. As a result, we calculated the correlation coefficients between element As in soil and vegetation indices, and construct a prediction model for elements As in soil using the appropriate vegetation indices. The results show that the spectral reflectance of peach leaves in the polluted area was generally higher than that in the background area and was more sensitive to heavy metals in soil in the wavelength range of 760~1 300 nm. The heavy metals in soil did not interfere considerably with the position of the red, blue and yellow edges of the leaves and were sensitive to the slope of the red, blue and yellow edges, and all of them were positively correlated. Spectral reflectance was weakly correlated with elements Cr, Cu and Hg in soil, and 0.1 level of significant correlation was reached with elements As, Pb and Cd in some wavelength ranges. The overall correlation curve trend was the same, with the correlation magnitude ranked as As>Pb>Cd in order. According to the above studies, it is found that As elements in soil have the strongest correlation. Therefore, we performed correlation analysis using As elements in soil and vegetation index, which showed that As elements were significantly correlated with both PRI1 and PRI3. The regression analysis was performed using SPSS data analysis software with PRI1 and PRI3 as independent variables and As in soil as a dependent variable. The test results show that the index prediction model of PRI3 (y=e43.644x-39.386, R2=0.937, RMSE=0.161) rendered the best results and was more stable.
Sep. 01, 2021Vol. 41 Issue 9 2866 (2021)
Zhi-yuan LI, Fan DENG, Jun-liang HE, and Wei WEI
Arsenic is one of the heavy metals that seriously harm the human body. The estimation of arsenic content of heavy metals in soil by using hyperspectral technology has great potential for application. However, the applicability and accuracy of the estimation model will vary greatly due to the influence of the region and soil background. The hyperspectral estimation was done in the protection zone of surface water zone of Shijiazhuang. Soil field samples were conducted in the main mining sites and smelting enterprises in the study area and analyzed the heavy metal in the laboratory. After 7-point Savitzky-Golay smoothing of the original spectral reflectance of soil samples, 9 spectral transformations were performed: first derivative (FD), second derivative (SD), reciprocal transformation (RT), reciprocal first derivative (RTFD), reciprocal second derivative (RTSD), absorbance transformation (AT), absorbance transformation and first derivative (ATFD), absorbance transformation and second derivative (ATSD), and continuum removal (CR). Then, the measured content of heavy metal arsenic was correlated with the spectral indexes after spectral transformations, and the maximum sensitive band of each spectral index was extracted. In order to compare the estimation effect of each model, and find the optimal model, the multivariate linear stepwise regression (MLSR), univariate partial least squares regression (U-PLSR) and multivariate partial least squares regression (M-PLSR) method were used to construct the soil heavy metal arsenic content estimation model. The model of arsenic content estimation finally compared the modeling effect through correlation coefficient R2, root means square error (RMSE) and statistical value F. The results showed that: most of the samples in the study area were in the critical state of contamination, although some of the soil samples were already mildly contaminated with heavy metal arsenic. The maximum positive and negative correlations existed between CR and ATFD and arsenic content, respectively. Compared with MLSR and U-PLSR, the estimated value of M-PLSR was closest to the measured value, and the fitting samples' R2, RMSE and F of M-PLSR were 0.852, 0.147 and 32.384, respectively, which indicated that the integration effect of multivariate transformation modeling was effective. Therefore, the research results can provide a scientific basis for rapid monitoring of heavy metal arsenic pollution in the region.
Sep. 01, 2021Vol. 41 Issue 9 2872 (2021)
Rui-rui YUAN, Bing WANG, Gui-shan LIU, Jian-guo HE, Guo-ling WAN, Nai-yun FAN, Yue LI, and You-rui SUN
Lingwu long jujube as Ningxia dominant characteristic jujube fruit. It has important economic and social value and scientific research significance. This paper has been lingwu long jujube as the research object. First, 60 intact jujubes images were collected Visible/near-infrared (Vis/NIR) using the hyperspectral imaging system. Damage tests were performed on 60 intact jujubes using the damaged device, and 60 damaged (internal bruising) jujube were obtained. The hyperspectral imaging system was used to collect the five time periods after damage (2, 4, 8, 12 and 24 h after damage) jujube spectral image. Region of interest (ROI) was extracted with ENVI software for the collected hyperspectral images of long jujube, and the average spectral value of intact long jujube and each time period long jujube were calculated. Then, the raw spectral data used Savitzky-golay smooth first derivatives (SG-1) and second derivatives (SG-2), standard normal variate (SNV) and de-trending, and the combined algorithms of SNV-SG-1, SNV-SG-2, de-trending-SG-1 and de-trending-SG-2 were pre-processed. The partial least squares-discriminant analysis (PLS-DA) classification model was established for the original spectrum and the pretreated spectrum. Finally, the optimal pre-processing spectral data were selected, and successive projection algorithm (SPA), interval random frog (IRF), uninformative variable elimination (UVE), variable combination population analysis (VCPA), interval variable iterative space shrinkage approach (IVISSA), IRF-SPA, UVE-SPA and IVISSA-SPA were used to select characteristic variables. The PLS-DA, linear discriminant analysis (LDA) and support vector machine (SVM) classification discriminant models were established for the selected feature variables. The results show that in the PLS-DA model based on the original spectral data, the accuracy of model calibration set and prediction set was 82.96% and 90%, respectively. After spectrum pretreatment, the SNV-SG-2-PLS-DA was obtained as the optimal classification discriminant model, and the accuracy of model calibration set and prediction set was 91.11% and 96.67%, respectively. In the classification model established by feature variables, the accuracy of the SNV-SG-2-UVE-PLS-DA model calibration set and prediction set were 86.3% and 94.44%, respectively. The accuracy of the SNV-SG-2-SPA-LDA model calibration set and prediction set were 86.3% and 83.33%, respectively. The accuracy of the SNV-SG-2-UVE-SVM model calibration set and prediction set were 77.78 and 71.11%, respectively. For the classification model, the classification results of the linear classification model (PLS-DA, LDA) were superior to those of the nonlinear classification model (SVM). The results of the linear classification model, PLS-DA was superior to LDA classification results, and PLS-DA could provide a better classification effect. The results show that the hyperspectral combined with the partial least squares-discriminant analysis model could effectively realize the rapid detection of the damage of lingwu long jujube of the change of time, providing a theoretical basis for the online detection of lingwu long jujube.
Sep. 01, 2021Vol. 41 Issue 9 2879 (2021)
Cong WANG, Camaiti Mara, Fu-de TIE, Xi-chen ZHAO, Yi-jian CAO, and [in Chinese]
Non-invasive analysis of artworks is one of the essential requirements in heritage conservation. In this study, a spectroradiometer in the field of remote sensing -a portable, full range hyperspectral sensor—was used to characterize organic compounds commonly found in cultural relics. It can obtain a continuous reflection spectrum within 0.2 s in the range of 350~2 500 nm, which covers visible, near-infrared and short-wave infrared regions. In the study, the three most widely used binders (egg yolk, rabbit skin glue, and linseed oil) were analysed. Four different pigments were used to mix with them to prepare painting mock-ups. This technique's applicability and accuracy were verified by testing a single component and a mixture of binders with pigments. The most diagnostic information of the three binders mainly lies in the range from 1 100 to 2 400 nm. Once the binders were mixed with inorganic pigments, the original position of the peaks experienced three types of modifications: (1) the shoulder peak at about 1 507 nm disappeared; (2) the broad peak between 1 943~1 922 nm shifted; (3) the absorption peak of N—H stretching and bending combination band at 2 050 nm shifted to about 2 070 nm. It is worth noting that the absorption peaks of the C—H combination and overtone bands showed the same positions in the spectra of single component and mixtures. Although in some cases, the interference between the absorption peaks of inorganic pigments and organic compounds influence on the identification, the use of their first derivative transformation can ameliorate this situation. Results showed that the hyperspectral sensor could effectively identify organic binders. This fast and non-destructive technique is feasible not only in laboratory conditions, but its portability also allows for in-situ analyses in outdoor environments.
Sep. 01, 2021Vol. 41 Issue 9 2886 (2021)
Hua-feng ZHANG, Wu WANG, Yu-rong BAI, Yi-ru LIU, Tao JIN, Xia YU, and Fei MA
Frozen-thawed pork was widely used as a raw material for processing boneless meat products. The hazardous bone fragment (1~2.5 cm) embedded in the pork can risk processing equipment and consumer health. Therefore, it is necessary to study the feasibility of multispectral imaging technology (405~970 nm) for rapid and non-destructive identification of the bone fragments embedded in frozen-thawed pork. In this work, 195 lean pork slices (LPSs) were prepared into 65 samples of boneless LPSs, 65 samples of bone fragments embedded in the surface of LPSs and 65 samples of bone fragments embedded in the inner of LPSs, and then the multispectral images of them were captured after freeze-thaw treatment. These images were segmented by canonical discriminant analysis (CDA) and converted into two types of regions of interest(ROIs-1 and ROIs-2), then extracted their spectral and image information. Finally, the identification models of hazardous bone fragments embedded in the frozen-thawed LPSs were established by support vector machine (SVM) and neural network (NN). The results showed that the whole spectra extracted from ROIs-2 had better identification ability of bone fragments than that extracted from ROIs-1 and could be used to establish SVM and NN models with 100% accuracy, indicating that the region segmentation was closely related to model accuracy. The bone fragments in pork could be identified with 100% accuracy using the spectra extracted from ROIs-2 at six key wavelengths (505, 590, 700, 850, 890 and 970 nm) that were selected by successive projection algorithm (SPA), implying that the testing efficiency was further improved. The image information had a significant advantage because it could establish the SVM model with 93.8% accuracy and the NN model with 93.33% accuracy for identifying the bone fragments that were lower than those established by the spectral information and obtain visible results. In conclusion, the bone fragments embedded in the frozen-thawed pork could be precisely identified based on multispectral imaging technology, which would provide a theoretical basis for industrial online detection.
Sep. 01, 2021Vol. 41 Issue 9 2892 (2021)
Xue-ying LI, Zong-min LI, Guang-li HOU, Hui-min QIU, Hong-min LÜ, Guang-yuan CHEN, and Ping-ping FAN
The change of carbon in marine sediment is the information bridge between the past and the future of the marine ecosystem, which reveals the law of the marine ecological process. Therefore, the research on the carbon content of marine sediments plays an important role in mastering the carbon cycle law of the marine ecosystems, studying the global carbon cycle, and studying the response and feedback to climate change. Spectrum technology is a fast and non-destructive measurement method, which has been widely used in quantitative analysis. Multispectral fusion based on spectral technology, through the combination of multiple spectral data, we can get more information than a single spectrum, which is conducive to the analysis of substances. In this paper, multispectral fusion was applied to the study of carbon content in marine sediments. 161 samples of Qingdao, China intertidal sediments are taken as samples. The visible near infrared spectra of sediments were collected by QE65000 spectrometer (spectrometer 1) and AVANTES optical fiber spectrometer (AvaSpec-ULS2048) (spectrometer 2), respectively. The spectra of the two spectrometers were fused, PLSR and BPNN were used to establish the carbon content model. The results of PLSR modeling showed that the results of multi fusion spectrum were better than that of spectrometer 2, slightly lower than that of spectrometer 1, and the RPD value was 1.968. The results of BPNN modeling showed that the results of multi fusion spectrum were better than those of two single spectrometers, and the RPD value was 2.235. The spectra after multispectral fusion were divided into several bands to find the characteristic bands of carbon in sediments. By analyzing the results of the multispectral fusion model, 560~790 nm was the best, the RC2 was 0.949, the RMSEC was 0.550, the RP2 was 0.874, the RMSEP was 0.733, and the RPD was 2.823. Compared with spectrometer 1, spectrometer 2 and multispectral fusion, the prediction effect was significantly improved. Therefore, using the multi fusion spectral characteristic band to establish the model of the carbon content of marine sediments can improve the prediction results of the carbon content in marine sediments. It can establish a more accurate model of the organic carbon content of sediments, which will lay a foundation for the rapid determination of the organic carbon content of sediments.
Sep. 01, 2021Vol. 41 Issue 9 2898 (2021)
Xiao-xia WANG, Hao WU, Zhi-hua NIE, Li-tong MA, Jin-long CUI, Hua-zheng SAI, and Jian-guo CHENG
In this paper, the interaction between fulvic acid (FA) and bovine serum albumin (BSA) was studied by fluorescence spectroscopy, ultraviolet spectroscopy, circular dichroism, synchronous fluorescence spectroscopy, three-dimensional fluorescence spectroscopy and molecular docking simulation in the simulated physiological environment. In the fluorescence spectroscopy study, the dynamic fluorescence quenching rate constant Kq and quenching constant at 298, 303 and 308 K are calculated by the Stern-Volmer equation, which proves that the quenching process of the interaction between BSA and FA is static quenching. At the same time, according to the calculated binding sites n, the interaction ratio between FA and BSA is 1:1. The thermodynamic parameters at three temperatures are calculated by static quenching double logarithm equation, enthalpy change ΔHSG<0, indicating that the interaction process is spontaneous. Based on Förster's dipole-dipole non-radiative energy transfer theory, the binding distance rang 6.340 nm is calculated, indicating a non-radiative energy transfer between BSA and FA. The molecular docking simulation results show that the binding force between FA and BSA residues is hydrogen bond and van der Waals force, and there is a hydrophobic force between them. The interaction of multiple forces makes FA and BSA combine stably. Through the UV-Vis absorption spectrum analysis of the interaction between FA and BSA, it is found that the maximum absorption peak of BSA has an obvious red-shift, indicating that FA changes the secondary structure of BSA. By studying the synchronous fluorescence spectrum of the interaction between FA and BSA, it was found that FA enhanced the polarity of the microenvironment around the tryptophan (Trp) residue in BSA, weakened its hydrophobicity and enhanced its hydrophilicity, which changed the protein conformation of BSA to a certain extent. Through the study of the three-dimensional fluorescence spectrum of the interaction between FA and BSA, the maximum emission wavelengths of peak 1 (peak 1) and peak 2 (peak 2) were red-shifted, which proved that FA interacted with BSA. FA increased the polarity of the environment around BSA, decreased its hydrophobicity, increased its hydrophilicity, and changed the protein conformation of BSA. Finally, circular dichroism was used for analysis, and the software was used to calculate that under the experimental interaction system, α-helix (α-Helix) decreased by 2.3%, β-sheet increased by 7.7%, β-Turn increased by 0.6%, and irregular structure (Random coil) content decreased by 1.2%. The content of β-sheet increased most obviously, which strongly indicated that FA changed the structure of BSA.
Sep. 01, 2021Vol. 41 Issue 9 2904 (2021)
Zi-han ZHANG, Lei YAN, Si-yuan LIU, Yu FU, Kai-wen JIANG, Bin YANG, Sui-hua LIU, and Fei-zhou ZHANG
Leaf nitrogen concentration is of great significance in the vegetation biochemistry process. Airborne hyperspectral data is widely utilized to retrieve leaf nitrogen concentration. Since the current algorithms cannot completely fulfill the accuracy requirement of precision agriculture, it is urgent to improve the retrieval accuracy of leaf nitrogen concentration. The accuracy of leaf nitrogen concentration retrieval is restricted by principle error and algorithm error. The principle error is generated in the process of specular reflection at the leaf surface. The radiant energy detected by sensors consists of a specular components and multiple scattering components. Solely the multiple scattering component carries vegetation biochemistry information (leaf nitrogen concentration, for instance). The specular component represents the energy reflected directly at the foliar wax layer, thus carries no inner information of the leaf. Based on the Fresnel formula, the specular component is partially polarized, and the multiple scattering component is unpolarized. Therefore, the principle error can be eliminated by the specular reflectance estimate, particularly with the aid of polarization reflectance modelling. The algorithm error is derived from the difference of airborne hyperspectral data mining capability between different algorithms. The performance of Partial Least Squares Regression, Principal Component Regression, Support Vector Regression, K-Nearest Neighbor Regression and Random Forest Regression are systematically compared in this research, and ultimately Random Forest Regression is chosen to reduce the algorithm error. In this research, in order to estimate the polarization reflectance of broadleaf and needle vegetation, multispectral data gained by POLDER/PARASOL satellite (equipped with multi-angle polarization sensors) are used to establish Bidirectional Polarization Distribution Function model. Hyperspectral data gained by the HySpex sensor system is used to conduct high-precision retrieval of leaf nitrogen concentration. Root Mean Square Error is taken as a major evaluation index. The conclusion is: After eliminating polarization reflectance in hyperspectral data, an average accuracy improvement of 4.244% is achieved among the above algorithms. Random Forest Regression is rather competitive by reaching 13.103% improvement in accuracy (RSQ 0.803, RMSE 0.252), which indicates that Random Forest is sensitive to polarization information. Compared to the basic method (Partial Least Squares Regression), the accuracy is improved by 32.440% after eliminating principle error and reducing algorithm error. In our research, the high-accuracy retrieval of leaf nitrogen concentration is realized, proving the significance of eliminating polarization reflectance and indicates the potential of random forest regression in hyperspectral remote sensing retrieval.
Sep. 01, 2021Vol. 41 Issue 9 2911 (2021)
Feng-shun XU, Quan-li CHEN, Wei DING, and Hai-tao WANG
Turquoise is mainly presented as colors like blue, green and variegated, among which blue and green possessing the highest value due to their vividness are preferred as optimization products. Organic matter injection is the most commonly used treatment to optimize turquoise, usually divided into organic matter soaking treatment and filling treatment. By means of test methods like the conventional gemological characteristic test, FTIR, 3D fluorescence spectrometer and X-ray fluorescence, this paper has conducted a thoroughly comparative study, among natural turquoise and those treatments with organic matter glue injection, upon their mineralogical and spectroscopic characteristics such as exterior features, density, ultraviolet fluorescence, infrared absorption spectrum, fluorescence spectrum and chemical composition. The test results revel that the LW fluorescent of natural turquoise is correlated with the hue and density exhibiting medium to the inert degree of fluorescence. The soaking treated turquoise under LW ultraviolet displays a higher degree of fluorescence than that of natural turquoise in the same color. And filling treated turquoise has a medium degree of fluorescence under the LW and SW. In addition to the characteristic peaks of turquoise itself, the infrared absorption spectra of the soaking treated turquoise can also be seen the absorption peaks ofν(C=O) 1 739, 2 926 and 2 851 cm-1 methylene peaks, and the filling treated turquoise characteristic absorption peaks of benzene ring skeleton at 1 508 cm-1 were observed. 3D fluorescence spectra show that natural blue turquoise has a medium intensity fluorescence peak with Ex of 370 nm, and its FWHM is about 100 nm, while green, mixed color and low-density turquoise have very weak fluorescence, blue soaking treatment turquoise has a strong symmetrical fluorescence peak in Ex 380~400 nm, and green soaking treatment turquoise has a strong fluorescence characteristic peak with FWHM about 80 nm. Blue filling treatment turquoise has two weak fluorescence characteristic peaks near 278 and 390 nm, respectively. Green filling treatment turquoise has a medium-intensity fluorescence peak with a half-width of about 150 nm. The increase of the fluorescence peak region may be due to the presence of more organic matter. The XRF reveals that the Fe content holds a degree of inhibitory effect on the fluorescence in the turquoise. The turquoise testing of fluorescence characteristics and three-dimensional fluorescence spectrum as non-destructive testing techniques have advantages like simplicity, convenience, fastness and effectiveness, which are vital to accurate identification of nature turquoise and its organically filled product.
Sep. 01, 2021Vol. 41 Issue 9 2918 (2021)
Plant growth is an important indicator of environmental changes. Under the global environmental change pattern, it is particularly important to study the impact of multiple environmental factors and interactions on plants. In order to explore the spectral characteristics of plants in response to environmental changes, to explore the impact of environmental changes on plant growth, and to realize remote sensing monitoring of plants, this study took the dominant species of Quercus mongolica in Northeast China as the research object, and analyzed and studied different photoperiods, temperature and Changes in spectral reflectance characteristics of the canopy of Quercus mongolica during its leaf development period caused by the interaction of nitrogen deposition. Plant growth is an important indicator reflecting environmental changes. In order to realize the monitoring of plants by remote sensing, this study took Quercus mongolica, the dominant tree species of Northeast China, as the research object, and used a simulation test to analyze the influence on the canopy spectral reflectance of Quercus mongolica in 50% leaves the unfolded stage. The simulation test was carried out in a large-scale artificial climate room and was set up with 3 temperature, 3 photoperiods and 2 nitrogen deposition interactive treatments. There were 18 treatments with 4 replicates in each treatment. When Quercus mongolica entered 50% leaves unfolded stage, three repetitions with small differences in each treatment measured spectral reflectance, and used the FieldSpec Pro FR 2500 back-mounted field hyperspectral radiometer to measure the spectral reflectance. Analyzed the spectral reflectance of the canopy of Quercus mongolica with different treatments, and selected NDVI (Normalized Vegetation Index), Chl NDI (Normalized Chlorophyll Index) and PRI (Photochemical Reflectance Index) three commonly used spectral indices as auxiliary analysis. At the same time, to calculated the first derivative spectrum to obtain the red edge parameters. The spectral reflectance trends of Quercus mongolica in 50% leaves unfolded stage of different treatments are roughly the same, which are in line with the unique spectral reflectance characteristics of plants. There is a small peak in the range of 350~680 nm, the reflectance of 680~750 nm rises rapidly, and the reflection platform enters after 750 nm. The results show that: (1) Photoperiod had no obvious effect on the spectral reflectance of Quercus mongolica canopy; (2) Increasing temperature reduced the spectral reflectance of Quercus mongolica canopy at 350~750 nm; (3) Nitrogen application reduced the spectral reflectance of Quercus mongolica canopy at 350~750 and 750~1 100 nm; (4) The interaction of temperature increase and nitrogen application significantly reduced the spectral reflectance of Quercus mongolica canopy; (5) And the first derivative spectrum can indicate the red edge characteristics of plants. The results can provide a theoretical basis for monitoring phenological changes and the analysis of influencing factors.
Sep. 01, 2021Vol. 41 Issue 9 2924 (2021)
Ke-jia HUANG, Jing DU, Jian ZHU, Nai-sheng LI, Yue CHEN, and Yuan-yuan WU
“Nanhai No.1” is a wooden merchant ship from the Southern Song Dynasty of China. It sank about 20 nautical miles south of Dongping Port in Yangjiang City, Guangdong Province. It was discovered in 1987. After several underwater archaeological investigations, it was strictly followed in 2007. Under the archaeological regulations, it was successfully salvaged out of the water. So far, the oldest, largest and most intact ancient sunken ship has been discovered in China. During longtime in seabed and damaged by seawater, the waterlogged archaeological wood have undergone serious physical, chemical and biodegradation effect by salt in the seawater and various microorganisms. It is give rise to wood components are degraded and eroded, and the supporting force between wood fibers is reduced, resulting in reduced strength and decayed structure. The accumulation of sulfur and iron considered to be associated with bacterial degradation of the wood. Iron sulfides can be oxidized to form sulfuric acid, which damages the wood cellulose and results in the degradation of organic materials. Thus, the content, distribution, and occurrence of iron and sulfur elements have important academic value for the research and protection of organic materials under sea. Due to sample preparation and method limitations, traditional methods make it difficult to perform in-situ and non-destructive analysis of iron/sulfur in waterlogged wood. Also, analysis speed and cost are also hard to overcome. μ-X-ray fluorescence, especially micro-focusing technology based on commercial X-ray tubes, provides a more convenient, fast, reliable, non-destructive and low-cost solution to this problem. Based on the opinion, selected the samples of the “Nanhai No.1” shipwreck hull, applied the latest multi-capillary μ-X-ray fluorescence spectroscopy technology, combined with Raman spectroscopy analysis, and conducted a surface scan analysis of the iron and sulfur content and distribution in the waterlogged archaeological wood. The results indicate that the distribution of iron and sulfur elements in the sample is heterogeneous, and there are multiple occurrence forms. The characteristics and rules of element distribution provide clues to reveal the sources, enrichment and coupling relationships of sulfur and iron in waterlogged wood. Studies have shown that μ-XRF technology can effectively analyze the iron and sulfur abundance in different parts of irregular and uneven waterlogged wood and reveal the distribution of elements and their correlation on a two-dimensional scale.
Sep. 01, 2021Vol. 41 Issue 9 2930 (2021)
Gui-xiong ZHANG, Xiao-xia YANG, Kai LIU, and Feng FU
Understanding the depolymerization and dissociation of the macromolecular structure of low-rank coal organic matter at the molecular level, is a key issue that needs to be solved urgently to efficiently use low-rank coal and obtain high value-added chemicals from it. Based on this, the Zichang low-rank coal was treated by sequential solvent treatment such as ultrasonic extraction, alcoholysis, and catalytic alcoholysis. Carbon nuclear magnetic resonance spectroscopy (13C NMR), X-Ray photoelectron spectroscopy (XPS) measurements, thermogravimetric (TG) and differential thermal analysis (DTG) were used to characterize the samples. The results show that the ratio of aliphatic carbon (fal) in coal macromolecular structure is decreased while the aromaticity (fa) increased during solvent treatments. The distribution of C and O elements are influenced greatly. The macromolecular structure of coal is depolymerized and dissociated to some extent, and its thermal stability is increased. After disulfide/acetone (CS2/AC) ultrasonic extraction at room temperature, the structures of oxy-aliphatic carbon (falO1, falO2, falO3) and oxy-aromatic carbon (faO1, faO2) in coal organic matter increase, while the proportion of carbonyl carbon (faC), the average methylene chain length (Cn) and the ratio of aromatic bridge carbon (χb) decrease, indicating that the network system mainly composed of polyhydroxyl in the macromolecular structure of coal is weakened and depolymerized during CS2/AC extraction. The structures of Calk—O, Car—O are increased. Some carbonyl carbon structures are dissociated. Some aromatic and aliphatic hydrocarbon fragments bound in coal by π—π interaction and other non-covalent bond interactions are dissociated by CS2/AC extraction. After alcoholysis treatment, the fal in coal organic matter decreases to 24.89%, and the methyl carbon (fal1) increases, indicating that a nucleophilic substitution reaction occurs during alcoholysis. Some weaker bonds such as Calk—O, Calk—Calk are broken. After continued catalytic alcoholysis, the content of oxygen-bound aliphatic carbon (faO3) in coal organic matter is significantly reduced, and Cn is greatly reduced, indicating that the organic matter in the coal is further dissociated and some of the Calk—O, Car—O and Car—Calk bonds are broken.
Sep. 01, 2021Vol. 41 Issue 9 2934 (2021)
Chun FENG, Nan-jing ZHAO, Gao-fang YIN, Ting-ting GAN, Xiao-wei CHEN, Min CHEN, Hui HUA, Jing-bo DUAN, and Jian-guo LIU
The realization of rapid identification of pathogenic bacteria has important practical significance for preventing large-scale disease outbreaks caused by microbial pollution in water bodies. Conventional bacterial detection methods such as biochemical identification and nucleic acid detection have the characteristics of time-consuming and precise experimental equipment, which are insufficient for the rapid and real-time online monitoring of bacteria. Since the multi-wavelength transmission spectrum of bacteria contains abundant characteristic information, and this spectral detection technology has the advantages of fast, simple, non-contact, and non-polluting, it has become a hot spot in bacterial detection research in recent years. This article takes Klebsiella pneumoniae, Staphylococcus aureus, Salmonella typhimurium, Pseudomonas aeruginosa and Escherichia coli as research objects. The characteristic wavelength range with the most significant spectral change is obtained by normalization and the analysis of variance method, and the characteristic spectral values such as the absorbance value at 200nm and the slope value of the short waveband are extracted from this range, and the support vector machine is used to predict different types of bacteria. The results show that the normalization of the multi-wavelength transmission spectrum can effectively eliminate the concentration effect and retain the complete original spectral information. The characteristic wavelength range of 200~300 nm is obtained by analysis of variance. The characteristic values of the normalized spectral trend graphs of the five bacteria extracted in this interval are: The absorbance values at 200 nm are 0.006 5, 0.005 1, 0.007 5, 0.007 5, and 0.008 5. The slope values at the 200~245 nm band are -62.45, -35.94, -81.30, -82.67, and -103.49, and the slope values at the 250~275 nm band are -15.48, -14.82, -20.91, -13.92 and -26.21, the slope values at the 280~300 nm band are -29.96, -24.62, -33.71, -36.09 and -30.88, respectively. Feature values were extracted from the samples and randomly divided into a training sets and test sets. The penalty factor model and the linear kernel function were selected for SVM, the best penalty factor parameter c and kernel function parameter g were determined through the optimization algorithm. The prediction accuracy rates of the five species of bacteria all reach 100.0%. In summary, theobvious spectral characteristic values of the multi-wavelength transmission spectrum of bacteriacan be extracted through proper data preprocessing. The spectral feature value combined with the support vector machine can be effectively used for the identification of different bacterial species. This method provides important technical support for rapid identification and real-time online monitoring of water bacteria.
Sep. 01, 2021Vol. 41 Issue 9 2940 (2021)
Lu-yi WU, Guang-zhen GAO, Xin LIU, Zhen-wei GAO, Xin ZHOU, Xiong YU, and Ting-dong CAI
Cavity Enhanced Absorption Spectroscopy (CEAS) technology is an important part of high sensitive spectroscopy, which has the advanced characteristics of relatively simple apparatus, high sensitivity, and strong environmental adaptability. Using a 2.0 μm tunable diode laser as the light source, combined with CEAS, a device for measuring the reflectance of the lens was built, and the absorption spectrum of CO2 gas at 5 001.49 cm-1 was used as the research target. The path length absorption cell and the known concentration of absorption gas have been calibrated for the reflectivity of the same pair of high reflectivity lenses. The first calibration method uses a multi-pass cell with a known path length as a reference cell. In this calibration, the absorptions from the resonant cavity and the multi-pass reference cell are measured simultaneously and compared to deduce the effective absorption path of the cavity enhancement system. Then the mirror reflectivity is obtained from the relationship between the mirror reflectivity and the effective absorption path. In the second calibration method, the integrated absorbance of a CO2 transition in a mixture with known concentration are measured for calibration. The mirror reflectivity is calculated by the relation of the integrated absorbance, the gas molecule number density and the line intensity of the selected CO2 transition. Finally, the two methods are compared for the calibration results of the lens reflectivity. The results show that the ratio of the integrated absorption area of the signal measured by the integrating cavity to the reference cell in the first method is 10.5, and the effective absorption path of the integrating cavity and the reflectivity of the lens are 302.65 m and 99.85%, respectively. The concentration of CO2 gas in the atmosphere is 0.037 3%, which is consistent with the actual atmospheric CO2 content. The advantage of this method is that it is not affected by sample concentration, but because of the introduction of a new reference cell, the pressure and temperature of the gas in the two cells need to be kept the same, so this method is suitable for an open cavity structure. In the second method, the absorption spectrum of CO2 is measured at 5 001.49 cm-1, the molecular number density N of CO2 gas is 9.099 101 5 molecules·cm-3, and the line intensity of the line in the Hitran database is 3.902×10⁻²² cm·molecule-1, the reflectance of the lens is calculated to be 99.84%. The advantage of the above method is that the structure is simple, but the molecular number density of the gas needs to be known, so the error of concentration and pressure will affect the calibration of the reflectivity of the cavity mirror. These two methods can accurately calibrate the reflectivity of the cavity mirror, and the corresponding suitable method can be selected as a reference in actual application.
Sep. 01, 2021Vol. 41 Issue 9 2945 (2021)
Xue-zhi REN, Peng HE, Zou-rong LONG, Xiao-dong GUO, Kang AN, Xiao-jie LÜ, Biao WEI, and Peng FENG
Traditional computed tomography(CT) uses an integral detector to collect projection, which reflects the average attenuation characteristics of the object and causes the loss of attenuation characteristics to some extent, so it cannot measure the object qualitatively and quantitatively. The spectral CT based on photon-counting detectors can collect the incident photons in different energy ranges by setting several energy thresholds to collect more material composition information of measured objects, which is helpful to identify materials with different physical characteristics, so the spectral CT is widely used in imaging of small lesions, low contrast structures and fine structures. However, dividing the whole energy spectrum into several energy segments for data acquisition will lead to the relatively reduced proportion of effective photons, resulting in more noise in the image and affecting the clinical application of energy spectrum CT. To effectively suppress the noise in different energy segments of spectral CT image, we propose an image denoising method basedondeeplearning. We combine the full convolution network and the residual pyramid network into the full convolution pyramid residual network (FCPRN). Our study, scanned a mouse specimen with spectral CT based on photon-counting detector and used the FDK algorithm and Split-Bregman algorithm for reconstruction to obtain training data and labeled data, respectively. Then we use the data set to train our network for image denoising. To verify our network's performance, we selected the common denoising networks, denoising convolutional neural networks(DNCNN)and residual encoder-decoder convolutional neural network(REDCNN)for comparison, and the training data and experimental configuration of the three networks are identical. Experimental results demonstrated that the proposed method could reduce the noise of spectral CT images in different energy ranges,and the performance of FCPRN is better than that of other neural networks discussed in this paper for denoising. When the model is trained, the image reconstructed by the FDK algorithm can be processed quickly via the model to improve the denoising efficiency and ensure the reconstructed image's quality of spectral CT.
Sep. 01, 2021Vol. 41 Issue 9 2950 (2021)
Bing ZHOU, Bing-xuan LI, Xuan HE, He-xiong LIU, and Fa-zhen WANG
In recent years, the military equipment used for reconnaissance has achieved high precision levels. The high-tech reconnaissance methods can often perform precise strikes on targets, greatly reducing victory in war. Two commonly used methods for acquiring hyperspectral data are hyperspectral satellite remote sensing and high-altitude aerial technology. These two imaging methods have the same reconnaissance time. The direction of light source is basically the same. Because the hyperspectral equipment is basically perpendicular to the ground, the reflected light direction usually keeps unchanged, the BRDF coefficient of the ground features is basically relatively fixed. In army application, the reconnaissance time is random, the incident angle of the sun changes all the time, and the reconnaissance diction is arbitrary, the hyperspectral position is on the ground or near the ground, the detection direction changes endlessly. The spectral curves under different conditions are greatly affected by the BRDF coefficient of the object surface. This paper analyzes the influence of the sun's altitude, azimuth and the detection angle on the camouflage and green vegetation spectrum under land-based conditions. The results show that although the reflection characteristics of the three materials are different, they present similar laws at different solar altitude angles, azimuth angles and detection angles. When the detection angle is constant for the solar altitude angle, the reflectance curves of the artificial camouflage and the green vegetation first increase and then decrease with the increase of the solar altitude angle. The green vegetation changes more obviously in the near-infrared band; for the azimuth, as the azimuth angle increases, the spectral reflectance of the three materials generally increases first and then decreases. At the same time, the reflectance during backward observation is generally larger than forwarding observation; for the detection angle, the relationship between the spectral reflectance of the material and the detection angle is not very obvious, but the three materials all have “hot spots” at different detection angles. Finally, this paper analyzes the BRDF model parameters of greenbelt vegetation and camouflage panels and obtains their reflection laws in different directions.
Sep. 01, 2021Vol. 41 Issue 9 2956 (2021)
Hai-jiang ZHU, Hao TANG, Jing-xian SUN, and Zhen-xia DU
In order to establish a fast and accurate method for liquor quality identification, this paper uses the machine learning method to model liquor of different quality. To extract the characteristics of different quality liquor, we analyzed different quality liquor with the ion mobility spectroscopy, constructed the feature vectors based on the signal of ion mobility spectroscopy, and classified different quality liquor. The ion mobility spectroscopy signals of liquor samples were obtained using the Excellims GA2100 electrospray ionization mobility spectrometry (ESI-IMS). Each ion mobility spectroscopy signal is a time series signal with its intensity varying with time. In the aspect of feature extraction, the time-domain characteristic peaks of the original data were extracted. Fourier transform is performed on the data of ion mobility spectroscopyfor more comprehensive characteristics, and the characteristic peaks in the frequency domain were extracted. At the same time, in order to express the characteristics of signal change, the spectral entropy and zero-crossing rate of ion mobility spectroscopy were calculated, and the N×9 dimensional feature matrix was constructed; Then, principal component analysis (PCA) and linear discriminant analysis (LDA) were used to reduce the dimensions of the features. The cumulative contribution rate of the first three-dimensional features of PCA to the overall features is 95%. By contrast, the cumulative contribution rate of the first two-dimensional features of LDA is 95%. Therefore, LDA is chosen as the feature dimension reduction method; Finally, a support vector machine (SVM), a nonlinear classifier in machine learning, was used to classify liquor ion mobility spectrum data. The experimental results show that the correct classification rate of the SVM method is 100% in the classification of real liquor and liquor with added alcohol; The correct classification rate of the SVM method is 99.7% in the six classifications of real liquor and five kinds of fake liquor with 10%, 20%, 30%, 40% and 50% alcohol concentration respectively. In addition, this paper compared the results of classification of ion mobility spectroscopy of liquor samples by logistic regression analysis (LRM), fuzzy C-means (FCM) and k-nearest neighbor (KNN). The results show that the SVM method based on spectrum feature vector can accurately distinguish the real liquor and the liquor with added alcohol, which provides a new detection method for identifying liquor quality.
Sep. 01, 2021Vol. 41 Issue 9 2962 (2021)
Yan-fen XU, Kai-hua ZHANG, Yan-lei LIU, Kun YU, and Yu-fang LIU
With the development of science and technology, the requirements for the quality of copper-nickel alloy products rise rapidly in the industrial field. During smelting and processing of copper-nickel alloy, the quality of products depends on the accurate surface temperature measured by radiation thermometry.Therefore,it is particularly important to study the spectral emissivity characteristics of copper-nickel alloy. In this paper, the spectral emissivity of the copper-nickel alloy is measured by the apparatus based on a Fourier transform infrared spectrometer at four temperatures (673, 773, 873 and 973 K) over the spectral range from 2 to 22 μm. The effects of wavelength, temperature, heating time and oxidation on the spectral emissivity of copper-nickel alloy are studied. It was found that the spectral emissivity of the copper-nickel alloy increased with increasing temperature and decreased with increasing wavelength in a nitrogen environment. When copper-nickel alloy was exposed to an air environment, its spectral emissivity increased rapidly with temperature. At 673 K, a layer of tinoxide particles was formed on the surface, which prevented further oxidation of copper-nickel alloy. The spectral emissivity of oxide particles is higher than that of copper-nickel alloy, so the spectral emissivity at a short wavelength increases slightly. At 773 K, the phenomenon of copper-nickel alloy's surface gradually turned red was observed during the experiment. It is found that Cu2O is the main component of the surface oxide, which is the reason why the spectral emissivity of the copper-nickel alloy increases rapidly. At 873 K, the type and content of oxide increase obviously, and oxide film thickness satisfies the condition of interference effect. The evolution of the interference extremum can be obviously observed in the spectral emissivity curves of copper-nickel alloy, and the interference extremum gradually moves to long-wavelength with the increasing of heating time. The oxidationresistanceof copper-nickel alloy decreases with increasing temperature. At 973 K, the oxidation degree on the surface of copper-nickel alloy is the deepest, and the peak value of oxide in the XRD pattern is the largest. Therefore, the number of interference extremum is most due to interference effect after 1 h. In conclusion, the spectral emissivity of the copper-nickel alloy is significantly influenced by wavelength, temperature and oxidation, which should be considered in the application of radiation thermometry.This study enriches the spectral emissivity of copper-nickel alloy and provides reliable data support for radiation thermometry.
Sep. 01, 2021Vol. 41 Issue 9 2969 (2021)
El-Megharbel Samy M., and Refat Moamen S.
Carbocisteine, also known as carbocysteine, is a mucolytic that reduces the viscosity of sputum and thus can be used to help relieve symptoms of chronic obstructive pulmonary disorder and bronchiectasis by allowing the sufferer to expel sputum more easily. A total of three new metal complexes of carbocysteine, HCcy with the metal ions Sr(Ⅱ), Ba(Ⅱ), and Pb(Ⅱ) have been successfully prepared in alkaline medium in situ H2O/CH3OH (50/50 w/w). The complexes obtained are characterized quantitatively and qualitatively by using micro elemental analysis, FTIR spectroscopy, UV-Vis spectroscopy, X-ray powder diffraction spectroscopy, 1H-NMR, and conductivity measurements. From the spectral study, all the synthesized Ccy complexes obtained as monomeric structure and the metals center moieties are six-coordinated except lead(Ⅱ) complex which existed as a four-coordinated respectively, suggesting formulas [Sr(Ccy)(H2O)2], [Ba(Ccy)(H2O)2] and [Pb(Ccy)] in neutral form. Beside, regarding both Sr(Ⅱ) and Ba(Ⅱ) complexes, the aquo groups are existed inside the coordination sphere. The infrared assignments reveal that HCcy ligand act as a bidentate ligand with the metal ions through oxygens of the deprotonated carboxylic COOH group. The 1H-NMR spectrum of the [Ba(Ccy)(H2O)2] complex has an absent of the proton of —COOH groups upon the deprotonated of carboxylic group.
Sep. 01, 2021Vol. 41 Issue 9 2975 (2021)
Zhi-fen WANG, Wei-kuan JIA, Shan-hao MOU, Su-juan HOU, Xiang YIN, Ji ZE, and [in Chinese]
Efficient and accurate recognition of apples in the visible spectrum is the key part of realizing orchard production prediction and automatic harvesting. The color of the green target is similar to the background of the branches and leaves.Thus the recognition of green apples becomes a new challenge. In the natural orchard, many complicated environmental factors may affect the accurate recognition of target fruit, such as light, rain, occlusion of branches and leaves, and overlap of targets. The existing recognition methods of target fruit are difficult to realize the real-time and accurate production prediction and automatic harvesting. In order to better realize the recognition of the green target in the natural orchard, a new kernel density clustering (KDC) is proposed. Firstly, the target image is segmented into irregular blocks by the simple linear iterative cluster (SLIC) algorithm, and approximate pixels in a small area are merged into superpixel area. The basic calculation unit is converted from a pixel point to a superpixel area to reduce the complexity. The SLIC algorithm is used to effectively avoid the target fruit contour's blur when simplifying the image data. Based on superpixels, the two-dimensional feature components of the R-B region mean and the G-B region means are constructed, and the color feature space of the green apples for cluster analysis is established. Then, the density peak clustering algorithm calculates the local density and local difference degree of each data point of the green apple image. The preciseand accurate local density in different complicated scenes is calculated using kernel density estimation. The high-density area segmented by the low-density area is found more accurately, and the clustering of arbitrary shapes is realized. Finally, a decision graph used to find a cluster center is constructed according to local density and distance. A double sorting algorithm is employed to automatically select cluster centers and efficient segmentation of target fruit. The superpixel area representation of the image is obtained using the SLIC algorithm, and the local density of the data points is obtained using kernel density estimation. The new algorithm greatly reduces the computational complexity and achieves efficient and accurate segmentation of the target images. In order to better verify the performance of the new algorithm, the experiment collects occluded and overlapping target images under multiple lighting, rainy and other complex environments and evaluates them based on segmentation efficiency, segmentation effectiveness, false positives, and false negatives. By comparing the k-means clustering algorithm, mean shift clustering algorithm, fuzzy C-means (FCM) algorithm and density peak clustering algorithm (DPCA), it is finally concluded that the segmentation performance of the new algorithm is the best.
Sep. 01, 2021Vol. 41 Issue 9 2980 (2021)
© Copyright 2018-2021 | Chinese Laser Press.
All Rights Reserved 沪ICP备15018463号-20