


 View fulltext
Jie SHANG, Yuan HUANG, Kai YANG, Bao-wei CHEN, Chun-hua LIU, and Yi YANG
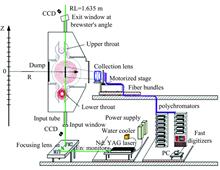
The diagnosis of incoherent laser Thomson scattering only needs to assume that the electron velocity satisfies the Maxwell distribution, and the measured data of plasma electron temperature and electron density are accurate and reliable. It is an important diagnostic tool in the Tokamak and other magnetically confined fusion research device, and it is developing towards the measurement requirements of high reliability, high spatial resolution and high repetition rate, while high reliability is the premise condition. The Thomson scattering cross section of electron is very small, and its total cross section is σT=6.65×10⁻²⁵ cm2. Generally, the Q-switched Nd∶YAG laser is used as the scattering light source. The laser pulse width is about 10 ns, and the pulse energy is about 3 J. The scattering spectrum is measured and analyzed by a 5~8 channel polychromator. One of the key problems of laser scattering diagnosis is how to collect the scattering-related electric pulse output from photoelectric detection module. In the past, charge-sensitive analogue-to-digital converters (Q-ADCs, such as CMC080 module) were used to integrate the scattered pulse signal on the sampling capacitor over a certain time width (such as 50 ns), so as to obtain the strength value of the scattered signal. This method is difficult to eliminate circuit noise and external interference. Now, fast digitizers (vertical resolution ≥10 bits, sampling frequency f≥1 GS·s-1, such as V1742B module) are used to collect the data in the time period including the scattering signal (such as 300~500 ns), so as to obtain the data sequence superimposed by the scattering pulse signal, the disturbance of plasma light and background noise. In this paper, the least square method is used to fit the scattering pulse with Gaussian function, and then the scattering pulse is numerically integrated into 50 ns-width to get the strength value of the scattering signal. The results show that the use of high-speed synchronous acquisition technology can eliminate most of the interference with digital filtering technology, so as to improve the signal-to-noise ratio, and its amplitude can reach about 10 times. After more accurate and reliable spectral data are extracted, the error-weighted least square method is used to process the data at the confidence level of 95%. A. C. Selden scattering spectral expression is used to estimate the parameters of electron temperature, and the measured value of electron temperature is obtained. The statistical error is about 3%, which is better than the previous 10%.
Feb. 01, 2021Vol. 41 Issue 2 333 (2021)
Song-jie GUO, Yue-ting ZHOU, Yong-qian WU, Xiao-bin ZHOU, Jian-fei TIAN, Gang ZHAO, Wei-guang MA, Lei DONG, Lei ZHANG, Wang-bao YIN, Lian-tuan XIAO, and Suo-tang JIA
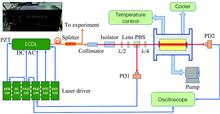
Narrow linewidth lasers are widely used in the field of optoelectronic detection due to their advantages such as good monochromaticity, high stability, and long coherence length, including coherent communication, precision measurement, optical frequency standards, absorption spectrum measurement, and research on the interaction between light and matter. At present, the linewidth of stable He-Ne lasers can reach the order of MHz. The linewidth of distributed feedback (DFB) fiber lasers can reach the order of kHz. The linewidth of DFB semiconductor lasers can also reach the order of MHz. However, grating feedback semiconductor lasers can achieve Hundreds of kHz line width output. In order to further narrow the line width of various lasers, it is necessary to lock the laser to a certain frequency reference through feedback control technology. In this paper, a self-designed ultra-stable cavity is used as the frequency reference, and the effective narrowing of the linewidth of 632.8 nm external cavity semiconductor laser (ECDL) is achieved. The narrow linewidth laser generation system includes the design of an ultra-stable cavity, the design of the optical path, the frequency control of ECDLand the integration of the system. The super-stable cavity adopts a two-mirror Fabry-Perot cavity (F-P cavity) structure, and the cavity is glass-ceramic with an expansion coefficient of about 10-6 K-1. The cavity mirror is a pair of flat and concave mirrors with a reflectivity of 99.988 5%±0.003 5%. In order to reduce the influence of the external environment on the cavity length of the FP cavity, the temperature of the cavity needs to be designed. This system uses four peltiers with a total power of 96 W and a water-cooled heat dissipation design. In order to reduce the influence of sound and air flow on the cavity mode frequency, the F-P cavity is placed in a vacuum chamber with a vacuum of 10-5 torr. For effective vibration isolation, the cavity is isolated from the vacuum chamber with a silicone rubber material. The ECDL used by this system is the DL pro series laser from German Toptica Company, which has two frequency control terminals of piezoelectric (PZT) and current modulation, and the response bandwidth is 1 kHz and 100 MHz respectively. The frequency control of the laser uses Pound-Drever-Hall (PDH) frequency locking technology. The modulation frequency of 18 MHz is loaded on the current modulation terminals of the laser. The error signal is obtained by demodulating the reflected signal of the FP cavity. Through two-way feedback control, a locked bandwidth of nearly 1 MHz is achieved. Through continuous optimization of the system, we finally narrowed the laser line width of about 300 kHz in the free-running state to the order of 10 kHz, and the system operated stably, and the frequency drift locked for 12 hours was about 30 MHz. The 632.8 nm narrow linewidth laser source developed in this paper can not only be applied to the field of absorption spectrum measurement, but also play an important role in the field of optical surface precision measurement.
Feb. 01, 2021Vol. 41 Issue 2 339 (2021)
Inquiring into the northern region of Tianshan Mountain valley oasis, urban traffic and the link between tropospheric NO2 vertical column density, Employing ground-based multi-axis difference spectrometer, (Mini MAX-DOAS) in 2018—2019, the north slope of Tianshan Mountains, economic belt comprehensive city Urumqi, Shihezi and in addition, medium-sized city, small continuous fixed monitoring Fukang city downtown area, carrying on the vehicle-mounted mobile monitoring on the city traffic trunk road, based on the urban traffic condition. Studying the influence of the tropospheric NO2 vertical column density, and analysis of mountain valley oasis city with developed cities of middle basin system’s pollution differences. The results show that: (1) Medium cities of the north slope of Tianshan Mountain cities of daily mean value flow in Urumqi (1 406/5 min) greater than the small and medium-sized cities, medium-sized city Shihezi (203/5 min) and the small city Fukang (185/5 min), there is no significant difference (p>0.05), and all kinds of city NO2VCD overall significant difference (p15 molec·cm-2)>Fukang (17.758×10¹⁵ molec·cm-2)>Shihezi (15.272×10¹⁵ molec·cm-2). The daily variation trend of traffic flow and NO2VCD in the three cities is consistent, showing a trend of “high in the morning and evening, low at noon”. In the seasonal variation, the traffic flow and NO2VCD of the three types of cities are: winter and spring>autumn and summer; (2) Although the traffic flow at the monitoring points in the morning and evening is different, the traffic flow of the three types of cities is concentrated near the city center; The movement monitoring data show that the high NO2VCD value occurs in urban areas with high traffic flow, and when the wind direction is stable in each city, the downwind concentration is greater than the upwind concentration. Due to the differences of living space, people’s activities in various functional areas of the city, traffic flow and NO2VCD are concentrated in the commercial district with dense population, indicating that vehicles have a great contribution to NO2VCD; (3)2009—2019, ten years north slope of Tianshan Mountain medium cities economic growth rate of GDP over 200%, Urumqi, Shihezi motor vehicle growth rate than developed cities such as Beijing, Shanghai, rapid urban development, and in the valley oasis area, low meteorological terrain north, the winter inversion layer, deep calm wind days more, heating period 6 months long, causing serious pollution in winter. In addition to the anthropogenic pollution discharge, natural factors contribute to the accumulation of pollutants in the north slope of Tianshan Mountain.
Feb. 01, 2021Vol. 41 Issue 2 345 (2021)

Jing-jing WANG, Tu TAN, Gui-shi WANG, Gong-dong ZHU, Zheng-yue XUE, Jun LI, Xiao-hai LIU, and Xiao-ming GAO
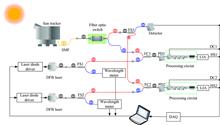
Laser heterodyne spectroscopy is a high-resolution remote sensing detection technology developed rapidly in recent years. Its device has the characteristics of small size, high spectral resolution, and is suitable for the detection of the concentration of atmospheric greenhouse gases. At present, it has been proved to be a practical and effective detection method in various observation experiments and has great application prospects and potentials in the field of earth atmosphere detection. Based on the existing laser heterodyne spectroscopy instruments, a new instrument structure is proposed in this paper. A fiber optic switch was used to modulate and split the direct sunlight, and realize the simultaneous detection of two-band laser heterodyne signals. It provides a new method for the next system integration of all-fiber laser heterodyne radiometer (LHR) and the construction of multi-band LHR. Based on the principle of laser heterodyne detection, this paper analyzes the advantages and key parameters of laser heterodyne spectrum detection technology. Combined with a self-developed high-precision solar tracker, a set of principle prototypes of a near-infrared dual-channel all-fiber LHR was built. The functions and parameters of the functional modules in LHR are elaborated in detail. The function principle and function of fiber optic switch are emphasized. The wavelength scanning mode and wavelength calibration method of the LHR are discussed. Based on this, the setting basis of related parameters and measurement method of the instrument function is discussed, and the instrument functions and the corresponding spectral resolution (0.004 4 cm-1) of the LHR described in this paper are given. Using the built LHR to conduct actual atmospheric surveys in the Hefei area (31.9°N, 117.166°E), the laser heterodyne signals of CH4 and CO2 in the band of (6 056.2~6 058.1 cm-1) and (6 035.6~6 036.5 cm-1) were obtained simultaneously. The wavelength calibration and normalization of the absorption signals were performed to obtain the entire atmospheric transmittance spectrum of CH4 and CO2 molecules in the atmosphere. The signal-to-noise ratios of the measured spectral signals are 197 and 209, respectively and the spectral characteristics of molecular absorption signals are analyzed. The measurement practice in this paper shows that the fiber optical switch can be used to optimize the structure of laser heterodyne spectroscopy system, achieve the simultaneous measurement of multi-channel and multi-band LHR, and expand the application of LHR in the field of atmospheric detection.
Feb. 01, 2021Vol. 41 Issue 2 354 (2021)
Guo-xian ZHANG, Ren-zhi HU, Pin-hua XIE, Feng-yang WANG, Yi-hui WANG, Jin-zhao TONG, Shi-yi CHEN, Shu-le LI, Wan-yi QIU, and Wen-qing LIU
Ammonia (NH3) is the most important reduced form of active nitrogen in the atmosphere, and is an important gaseous precursor for the formation of secondary inorganic ammonium salts. Under the extremely polluted conditions in China, these ammonium salts can account for 40%~60% of the mass of PM2.5. NH3 pollution not only affects the intensity of light radiation globally but also exacerbates atmospheric photochemical pollution. At present, the source of ammonia in urban areas is still controversial. In order to study the pollution of NH3 in Taizhou, and then determine the source of NH3. Based on the off-axis integrated cavity output spectroscopy technology, this paper carried out continuous observation of atmospheric NH3 concentration in Taizhou in summer. Other pollutant concentrations (such as O3, NOx, CO, NH4+) were measured simultaneously. The observation point is 300 m away from the traffic arterial. The average concentration of NH3 during the observation period is (25.1±4.5) μg·m-3, which was higher than that of other cities at home and abroad. There is no significant difference in the mean value of NH3 during the day and at night, but it generally decreases during the day and increases at night. The stable atmospheric boundary layer at night maybe one of the main reasons for the accumulation of pollutants. In the morning, the concentration of NH3 increased sharply, mainly due to the evaporation of NHx(gaseous NH3 and particulate NH4+) deposited in water vapor at night. With the enhancement of light, the evaporation of NHx in environmental water vapor gradually ended, the photochemical reaction process gradually began to be dominated, then NH3 concentration increased slowly, gradually reached equilibrium, and finally declined rapidly. When the humidity at a high level during nighttime, the deposition process of NHx is easier to observe. They are combined with the meteorological parameters during the observation period and the concentration with the concentration of the conventional pollutants. The trend and level of pollutants in the Taizhou area has been discussed. The results show that the impact of traffic emissions on the NH3concentration in Taizhou is small on most days. Only June 7th, NH3 has a good correlation with NOx, CO, with R2 of 0.740 and 0.911. It is speculated that the day’s traffic has a significant influence, and the traffic source is an important local source of NH3. Backward trajectory analysis was performed to compare the changes in pollutant concentrations caused by different air masses during the observation period. According to the analysis of observation results, pollution discharge from the industrial area on the northwest of the observation point may be an important cause of the pollution incident on June 10th at night.
Feb. 01, 2021Vol. 41 Issue 2 360 (2021)
Han-han YE, Xian-hua WANG, Qin-qin LI, and Xiao-di WANG
For atmospheric Carbon dioxide (CO2) satellite monitoring, high precision is the most important. However, because of the high similarity of spectra between plant chlorophyll fluorescence and atmospheric scattering effects, the atmospheric scattering effects were always misinterpreted and CO2 retrieval errors were caused. The minor radiance and high spectral similarity of the plant chlorophyll fluorescence made it hard to retrieve and correct. Considering the non-negligible effects of plant chlorophyll fluorescence on CO2 retrieval, we designed a correction method based on atmospheric scattering effects parameterization using three spectral bands of O2-Aband, 1.6 and 2.06 μm CO2 band to retrieve chlorophyll fluorescence, photonpath-length probability density function (PPDF) parameters and CO2 simultaneously. Firstly, atmospheric scattering effects were parameterized using the PPDF model to reduce its spectral similarity with the plant chlorophyll fluorescence. Secondly, the prior information database with 5 km resolution of plant chlorophyll fluorescence was built using plant chlorophyll fluorescence products from the Orbiting Carbon Observatory(OCO-2), which can strength the prior constraints on chlorophyll fluorescence retrievals and improves its retrieval precision. Through disentangling and quantifying the atmospheric scattering and plant chlorophyll fluorescence, CO2 will be retrieved more accurate. Park Falls station covered with dense plant location in 45.945°N and 90.273°W of Total Carbon Column Observing Network (TCCON) was selected for validation. CO2 retrievals of Greenhouse Gases Observing Satellite (GOSAT) without chlorophyll fluorescence correction are about 2 ppm under bias, which was corrected obviously through the method of this paper, as the largest bias reduces from 2.58 ppm to 1.49 ppm. In the same time, the standard deviations are also improved. From the validation results we can see that the effect of plant chlorophyll fluorescence on CO2 retrieval is corrected effectively.
Feb. 01, 2021Vol. 41 Issue 2 368 (2021)

Hui-ping LEI, Bing-liang HU, Tao YU, Jia-cheng LIU, Wei LI, Xue-ji WANG, Yan ZOU, and Qian SHI
Nitrate is an important index of water quality monitoring. The high concentration of nitrate in water results in the decrease of biodiversity and the degradation of the ecosystem. Meanwhile, it will cause irreversible harm to human health. Water quality monitoring technology based on the spectrum is the trend of modern water environment monitoring. Compared with the traditional method, nitrate field sampling and laboratory analysis, it has the advantages of simple operation, no pretreatment, fast detection, good repeatability and no pollution. Due to the complexity and diversity of water components, there is a high degree of nonlinearity between water parameters and absorbance. Traditional linear regression prediction models are not applicable, such as single wavelength method, dual wavelength method and partial least square method. Therefore, this paper proposes a new method for the determination of nitrate in water by fine full spectrum combined with the improved variable step grid search algorithm optimized support vector regression (GS-SVR). In cooperation with the college of chemistry and chemical engineering of Shaanxi University of Science and Technology, 94 groups of solution samples with different concentrations were prepared according to different concentration gradients and the experimental requirements by using standard nitrate solution, platinum cobalt standard solution and formazine standard suspension. Firstly, the transmittance spectrum was converted to absorbance, and 94 solution samples were divided into 80 training sets and 14 test sets by Kennard stone algorithm. Secondly, the improved GS algorithm combined with 5-fold cross validation is used to optimize the parameters of SVR by reducing the search range and changing the search step for many times, and the optimal penalty parameters and kernel function width are used to build model, which is used to predict the test set. Meanwhile, the prediction results are compared with those of BPNN, SVR, GS-SVR, PSO-SVR and GA-SVR. The results show that the coefficient of determination R2=0.993 5, root means square of prediction RMSEP=0.043 5. The optimal parameters are (512, 0.044 2), and the average training time is 13 s. Compared with the above five prediction models, R2 increased by 1.22%, 11.66%, 0.78%, 0.74%, 0.77%, training efficiency increased by 4.15 times (BPNN), 8.30 times (GS-SVR), 21.38 times (PSO-SVR), 10.23 times (GA-SVR). The prediction accuracy and training efficiency of the model has been greatly improved, which provides a novel approach basis for rapid and real-time online monitoring of nitrate concentration in the complex water body. This method is also suitable for the establishment prediction models of other water quality parameters.
Feb. 01, 2021Vol. 41 Issue 2 372 (2021)
Shao-hua LI, Hong-xia ZHAO, Chen WEN, Zhi-qun DING, Jing-rui WANG, and Pei-hong CHENG
High sensitive single particle/molecule detection technique is an important prerequisite for nanoparticle application in biomedicine, chemistry and optoelectronics. Common single particle detection techniques include optical microscopy and spectroscopy based on fluorescence, Raman scattering, Rayleigh scattering, and absorption signals from single particle or molecule. Raman and fluorescence spectra analysis are applicable to fluorescence molecules or molecules with SERS activity. However, even for organic dye and semiconductor nanoparticles with high fluorescence efficiency, inherent photobleaching and blinking is a challenge for single particle detection. Scattering based technique is another solution for single particle detection, but as the scattering signal decreases with the particles size with the sixth power, it is difficult to separate the scattering signal of small size particle from background scattering noise. As we known, the light absorption of medium will induce refractive index change, and a refractive index gradient distribution will be present in the light heating zone. This phenomenon is known as the photothermal effect. Microscopy based on particle or molecule light absorption induced thermal effect has the merit of high sensitivity, freedom from background scattering, in-situ and label-free. It has been demonstrated potential application in single-particle/molecule detection field. In this paper, the application and development of photothermal based microscopy and spectroscopy was summarized. Firstly, the measurement principle was introduced. Then experimental set-ups of several different techniques including photothermal lens, differential interference contrast and photothermal heterodyne were discussed. The signal-noise ratio, sensitivity and resolution of these techniques were compared, and the recent investigations on applications of these techniques to single particle detection were also introduced. And then the recent research progresses in improve photothermal microscopy was elaborated, including signal/noise ratio increasing, dynamic measurement improvement and infrared spectrum expanding. Finally, the challenge for the photothermal technique used in single particle detection was summarized briefly.
Feb. 01, 2021Vol. 41 Issue 2 379 (2021)
Zheng-dong SHEN, Xian-ming KONG, Qian YU, and Zhan-xu YANG
Surface Enhanced Raman spectroscopy (SERS) is a sensitive, instant and nondestructive sensing technique that has been widely used in analytical chemistry, environmental protection and food safety. However, the samples in real-world usually contain many different components, which makes the identification of analytes from mixed samples very difficult for SERS sensing. For their advanced features such as simple operation process, cost-effective and instant separation time, thin layer chromatography (TLC) technology was widely employed in synthetic chemistry, analytical chemistry, medicinal chemistry and food science as a powerful separation strategy. The target system was firstly separated by TLC, and the corresponding spots of analyte are visualized by iodine colorimetry or fluorescence, and then the analytes werequalitative and quantitative identified by mass spectrometry, FTIR, fluorescence spectroscopy and SERS. The in-tandem of SERS with thin layer chromatography (TLC-SERS) is very promising in effectively sensing analytes from mixture samples due to its high throughput and sensitivity and the separation ability. The complicated apparatuses are not necessary during the application process of TLC-SERS. This paper introduced the mechanism of SERS enhancement and the preparation of SERS substrates, and this review highlights recent progress of TLC-SERS in the view from the application, such as in monitoring pollutants in the environment, food safety, identification of herbal medicine and biomedicine. The application example of TLC-SERS method on instant inspection of harmful ingredients was then presented, which provides a reference for future instant inspection method construction and development of rapid detection instruments in the area of food safety, forensic characterization and environmental protection.
Feb. 01, 2021Vol. 41 Issue 2 388 (2021)
Ying MA, Rui-rui DONG, T. Fuller Benjamin, Shu-ya WEI, and [in Chinese]
Palaeodiet is one of the most important topics in modern archaeological research. The bulk isotopic analysis of archaeological human and faunal remains have made great contributions in palaeodietary reconstruction for decades, but gradually it shows the limits of palaeodietary interpretation, of particular, in the way to detect the nutritional quality and food pattern of ancient human. Compound-specific amino acid composition method (CSIA) has shown huge potential to elucidating dietary behaviors in a complex archaeological context and may able to mitigate the influences of many of the limitations inherent to palaeodietary reconstructions. Here we carried out both bulk collagen isotope analysis and the compound-specific amino acid isotope analysis on 10 humans and 4 faunal skeletons which excavated from a Vandalic cemetery at Carthage in Tunisia, North Africa (5th—6th AD). The result reveals that the population from Vandal Cemetery had an overall dietary pattern that was predominately based on terrestrial C3 resources, and the majority of the individuals having a significant amount of terrestrial protein in their diets. Further, this study focuses on determining the difference in the contribution of protein to the human diet and comparing the interpretation variance given by these two different methods. The individual amino acid isotope result shows the great advances in trophic position estimation for both archaeological human and animal’s samples. It may shed new light on the exploring identity dietary difference and the social stratification research in Chinese archaeological research. Our studies indicated that the CSIA has a huge potential for refining human paleodietary reconstruction, and should be widely applied into Chinese Archaeology.
Feb. 01, 2021Vol. 41 Issue 2 395 (2021)
Ling-qiao LI, Yan-hui LI, Lin-lin YIN, Hui-hua YANG, Yan-chun FENG, Li-hui YIN, and Chang-qin HU
The detection method of Raman spectroscopy relies on the chemometrics algorithms, and deep learning is the most popular are at present, which can be applied to the modeling of Raman spectroscopy. However, deep learning requires large samples for training, while Raman spectral collection is limited by equipment and labor cost. Obtaining large quantities of samples requires a higher cost, and also is suffered by fluorescence and other factors, which all restrict the application of deep learning to Raman spectral. In view of the above problems, the paper introduces the deep convolution generation counter network (DCGAN) to extract the characteristics of Raman peaks in the Raman spectrum, and generates a new Raman spectrum to expand the data set. At the same time, the reliability of DCGAN was proved by comparing with the slope-bias adjusting method, another method to expand the data set. In this paper, spectral selection criteria are designed and generated to fill the dataset with highly similar spectra, which is the first step for the application of deep learning in Raman spectra. In order to demonstrate that the generated spectrum has good comformality with the original spectrum, the paper sets up four groups of experiments for comparison: (1) the original Raman spectrum is input to SVM for classification, and the classification accuracy is 51.92%, (2) the original Raman spectrum was input to CNN for classification, and 75.00% classification accuracy was obtained, (3) the slope-bias adjusting method was used to generate the spectrum, which was input into CNN for classification, and the classification accuracy of 91.85% was obtained, (4) DCGAN was used to generate the spectrum, which was input into CNN for classification, and the classification accuracy was 98.52%. The comparison of the four groups of results proves the superiority of the Raman spectrum generated by DCGAN. The experimental results show that DCGAN can generated much alike spectrum through antagonism learning with only a small amount of Raman spectrum, and the generated spectrum is clearer than the original spectrum, reducing some interference factors, and has a preprocessing effect on the spectrum. Taking the advantage of DCGAN, a large number of high-quality data can be generated and filled into the original Raman spectral data set, and the sample size of the data set can be expanded, so that the deep learning model could be better trained, thus improving the accuracy of the classification or other model. This paper proposes a feasible scheme for applying deep learning method to Raman spectroscopy.
Feb. 01, 2021Vol. 41 Issue 2 400 (2021)
Li-chang ZOU, Jun HUANG, Zheng-hui LI, Yao DENG, Guo-dong SHAO, Zhen RUAN, Zhi-min LU, and Shun-chun YAO
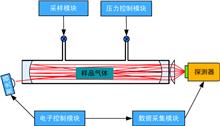
Tunable Diode Laser Absorption Spectroscopy (TDLAS) is widely used in the combustion diagnosis, measuring trace gases and industrial process control and so on due to its high sensitivity, high resolution, non-intrusive and real-time detection. The second-harmonic (2f) detection technology of wavelength modulation spectroscopy (WMS) is one of the main methods for TDLAS gas sensing. The laser is one of the core components of TDLAS-WMS online detection system and its output wavelength and baseline of 2f background signal will drift due to changes of the laser’s operating temperature and other factors during long-term operation, resulting in reduced accuracy of gas concentration inversion and stability of TDLAS-WMS online detection system. Aiming at the above problems, according to the fundamental absorption properties of NO gas molecules in the mid-infrared band of 5.176~5.189 μm, a distributed feedback, continuous-wave quantum cascade laser (DFB-CW QCL) with the peak wavelength of 5.184 μm will be chosen to analyze the drift variation of the laser center output wavelength corresponding to the sampling points and the characteristics of the 2f absorption and background signal drift. Based on the above analysis, the average peak-to-peak value of 2f signal is used to replace the peak value of 2f signal to establish the gas concentration inversion model to correct baseline drift of 2f background signal as well as combining with the signal-to-noise ratio is optimized as the principle of wavelength drift correction, and the 2f background signal drift correction method is finally established to eliminate the adverse effect of the 2f background signal drift on the gas concentration inversion results in the long-term continuous detection of TDLAS-WMS online detection system. The results showed that the average peak-to-peak value of the 2f signal increased with the concentration of NO gas. The average peak-to-peak value of the 2f signal and the concentration of the NO sample showed a good linear relationship and linear fit R2 of the fitted curve reached 0.999 9. In the 60 min continuous monitoring experiment which was conducted by using NO sample with a volume concentration of 20×10-6, the standard deviation, the maximum relative error and the relative error mean square value of the inversion concentration decreased from 0.19×10⁻⁶ to 0.07×10⁻⁶, decreased from 6.30% to 3.85% and decreased from 24.39% to 9.99% after the drift correction, respectively. The method can effectively suppress the influence of 2f background signal drift on the gas concentration inversion result, and significantly improve the sensitivity, accuracy and stability of the TDLAS-WMS online detection system continuous monitoring.
Feb. 01, 2021Vol. 41 Issue 2 408 (2021)
Yun-gang ZHANG, Huang-tao LIU, Qiang GAO, Zhi-feng ZHU, Bo LI, and Yong-da WANG
The occurrence of discharge due to insulation defects in gas insulated switchgear (GIS) can cause decomposition of SF6. The low-fluoride sulfide species produced by the decomposition react with trace amounts of H2O and O2 in the equipment to produce corrosive substances, which affect the normal operation of the equipment. Thus, it is of great significance to study the decomposition mechanism for the safe operation of GIS. Some decomposition products are transformed in the process of sampling. Hence, it is necessary to realize the in-situ detection of SF6 decomposition products to study the mechanism of SF6 decomposition. Femtosecond laser-guided high-voltage discharge technology was proposed to achieve the precise control of the space and time of high-voltage discharge, and the in-situ measurement of SF6 decomposition products was achieved by using space-resolved spectrum generated by femto second laser-guided high-voltage discharge in our work. In this paper, firstly, the decomposition of SF6 is not caused by femtosecond laser. Secondly, the precise control of discharge space and time is achieved by using the plasma channel generated by femtosecond laser. Finally, it is found that the decomposition contains a large number of S and F ions and atoms that are directly or indirectly generated by high-energy electron collisions. The research proves that in-situ detection of SF6 decomposition products can be achieved based on femtosecond laser-guided high-voltage discharge, which provides a new research method for the study of SF6 decomposition mechanism under high-voltage discharge.
Feb. 01, 2021Vol. 41 Issue 2 414 (2021)
Yan-yan LIU, Ning-ping TAO, Xi-chang WANG, Ying LU, and Chang-hua XU
Foodborne pathogens are predominant factors affecting human health. Due to the species diversity of foodborne pathogens and the complicity and time-consuming of traditional techniques, a rapid and accurate foodborne pathogen detecting technology is urgently needed. For the traditional infrared spectroscopic techniques, samples need to be lyophilized (about 2 days) before being pressed into a KBr pellet. Therefore, it is not conducive to fast and high-throughput detection. In this study, a developed ZnSe film transmission method was employed to drop samples on the ZnSe window directly, and an in-situ detection was carried out after low-temperature drying without long lyophilization process. The whole detection process was completed within 50 min. Meanwhile, only small sample volume (10 μL) was needed and the adverse effects of KBr pressed pellet method (e. g., size of abrasive particles, thickness error, easy fragmentation and moisture absorption) were avoided. In the meantime, by comparing the four foodborne pathogens (Escherichia coli DH5α, Salmonella enteritidis CMCC 50041, Vibrio cholerae SH04, Staphylococcus aureus SH10) with the conventional KBr pressed pellet method, the number of peaks in second derivative infrared (SD-IR) spectroscopy obtained by the ZnSe film transmission method (1 500~900 cm-1) significantly increased (ZnSe film transmission method: 81, KBr pressed pellet method: 58) under the same peak threshold detection (transmittance >0.05%) and broad single peaks or inconspicuous double peaks in the KBr pressed pellet method could be split into two or more peaks (Escherichia coli DH5α: 1 441, 1 391, 1 219 cm-1 etc; Salmonella enteritidis CMCC 50041: 1 490, 1 219, 1 025 cm-1; Vibrio cholerae SH04: 1 441, 1 219 cm-1; Staphylococcus aureus SH10: 1 491, 1 397, 1 219 cm-1) with higher peak intensity (1 119, 1 085, 915 cm-1 etc.). Therefore, it had been demonstrated that spectral resolution and the signal to noise ratio in the ZnSe film transmission method were significantly improved. The in-situ infrared spectroscopy based on ZnSe film transmission method has great potential for the rapid and high-throughput detection of common foodborne pathogens in food.
Feb. 01, 2021Vol. 41 Issue 2 419 (2021)
Rong-sheng ZHU, Tao SHEN, Ying-li LIU, Yan ZHU, and Xiang-wei CUI
The terahertz spectrum of the matter is unique. At present, combined with advanced machine learning methods, research on terahertz spectrum recognition technology based on large-scale spectral databases has become the focus of terahertz application technology. It is difficult to collect multi-material equilibrium spectral data, which is the basis for classifying terahertz spectral data. This paper proposes an unbalanced terahertz spectrum recognition method based on WGAN (Wasserstein Generative Adversarial Networks). As a new method of generating data, WGAN uses the generated data under the condition that the model reaches the Nash equilibrium to supplement the data set, and is finally trained by a support vector machine (SVM). The experimental results prove that the generated data can effectively map the distribution of real data, and the accuracy of identifying unbalanced spectral data can be improved by mixing the generated data with the real data. In this paper, three types of maltose compounds with similar characteristics spectra are used for verification. We first use S-G filtering and cubic spline interpolation to normalize the spectral data of the three substances, and then expand the unbalanced terahertz spectral data of the three substances by constructing a WGAN model to bring it to class equilibrium. The experiments are verified under the same test set, and three sets of comparative experiments are used to prove the effectiveness of WGAN in the processing of uneven data sets. First we use WGAN to generate data. As the number of iterations increases, the generated data gradually conforms to the real data distribution. When the model reaches the Nash equilibrium, the generated data basically conforms to the original data distribution. The experimental results prove that training the SVM model using the extended WGAN data set can solve the problem that the model has a small sample data (Maltotriose, Malthexaose) biased toward a large sample data (Maltoheptaose) on the test set. After comparing WGAN with traditional methods for processing unbalanced data sets FWSVM and COPY, we find that the training set accuracy of the three classification algorithms on the dataset-1 dataset can reach more than 90%. However, due to the limitation of the generalization ability of the model, the effect of the traditional method on the test set is not very satisfactory, and the accuracy of the test set after using WGAN can reach 91.54%. In terms of different imbalances, the data sets with imbalances of 16, 81, and 256 were used for verification. The accuracy rates on the three test sets are 92.08%, 91.54%, and 90.27%, which can meet the requirements of dealing with different imbalances in actual work.
Feb. 01, 2021Vol. 41 Issue 2 425 (2021)
Lu-ze YANG, and Miao LIU
As a kind of additive flame retardant, polybrominated biphenyls (PBBs) will be released from the product slowly and enriched in environmental media and organisms to cause harm. Infrared and ultraviolet spectra can detect PBBs, which have the advantages of rapid detection, no secondary pollution and simple operation, etc. In this paper, the efficacy coefficient method was used to synthesize the two spectral effects of infrared vibration and ultraviolet absorption of PBBs and a CoMFA model with dual spectral effects was established. PBB-153 Derivatives with increased infrared and ultraviolet spectral intensity are designed according to the contour maps of the model. The stability, functionality and environmentally friendliness of derivatives were evaluated. The results showed that the main component n of the CoMFA model is 3, and the cross-validation coefficient q2 was 0.532 (>0.5), indicating that the model has a good prediction ability; SEE was 0.013 (F was 38.281, and non-cross-validation coefficient R2 was 0.935 (>0.9), which indicates that the model has the good fitting ability; the scrambling stability test parameters Q2, cSDEP and dq2/dr2yy were 0.51, 0.04, and 0.95 (rpred2was 0.73 (>0.6), indicating that the model has a good external prediction ability, and the steric and electrostatic field’s contribution rates are 44.8% and 55.2%, respectively. According to the contour maps’ information of the model, 7 PBB-153 derivatives were designed, the change rates of comprehensive values of the dual spectral increased ranged 10.15%~29.12%. The Gaussian calculation results showed that the Gibbs free energy value of the derivative was less than 0 and the frequency was greater than 0. The C-Br bond dissociation enthalpy changeds lightly, indicating that the derivatives have good environmental stability and function. In addition, the environmental persistence, long-distance transmission, toxicity and bioenrichment of all derivatives were reduced, and the environmental friendliness was improved. Model validation results showed that the derivatives’ single effects of infrared and ultraviolet were rising, and two spectral intensities changed the ratio of derivative No.4 (4-OCN-5-NO-PBB-153) was 0.79, close to the set proportion of 1∶1, and the contour maps of dual effects basically contained the information of that of the single spectra effects model, indicating that the established CoMFA model has a certain accuracy and reliability. The established CoMFA model can accomplish the modification and comprehensive analysis of two single spectral effects simultaneously, providing the idea for the comprehensive evaluation of the spectral detection of other pollutants.
Feb. 01, 2021Vol. 41 Issue 2 430 (2021)
Meng-ran ZHOU, Hong-ping SONG, Feng HU, Wen-hao LAI, and Jin-guo WANG
Water inrush accidents threaten the lives of people and cause property damage. Therefore, it has great significance in accurately detecting the type of water inrush. Hydrochemical analysis method takes a long time and has a complicated process to detect the type of water inrush. Laser-induced fluorescence (LIF) technique has the advantages of fastness, high sensitivity, and low interference. Water inrush source recognition model building with LIF technique and intelligent algorithms can accurately detect the type of water inrush. At present, such models generally require de-noising, dimension reduction, and band selection on the fluorescence spectra, and this process is complicated. The models are built on the fluorescence spectra of the water inrush source which is evenly grouped. The influence of the uneven grouping on the model is not discussed, and the model is not built for the uneven grouping. In practical engineering applications, the number of samples collected is highly likely to be uneven, so Moth-flame optimization (MFO) algorithm combined with spectral clustering (SC) is proposed to realize the uneven grouping of water inrush fluorescence spectrain this paper. In the experiment, firstly, five kinds of experimental water samples were obtained from Huainan coal mine. Laser-induced fluorescence experimental equipment was used to collect fluorescence spectra of all water samples. The number of groups of five water samples is 75, 80, 80, 30 and 135. Secondly, build MFO-SC water sample recognition model. After comparison, K-Means is selected for the label mapping method, the Gaussian kernel function is selected for the calculation method of the similarity matrix, and the ncut is selected for the partition criterion. The parameters of the Gaussian kernel function were optimized by using MFO to obtain the parameter value of 1.745, and the initial clustering center of the model was fixed. Subsequently, build three water sample recognition models of K-Means, SVM and MFO-SVM, respectively. Comparing the MFO-SC model with the K-Means model, the optimal accuracy of the MFO-SC model is 100%, and the average accuracy is 100%. The optimal accuracy of the K-Means model is 99.75%, and the average accuracy is 79.57%. Then calculate the training set accuracy and test set accuracy of the SVM model and MFO-SVM model respectively. The accuracy of the training set of the SVM model is 80%, and the accuracy of the test set is 80%; the accuracy of the training set of the MFO-SVM model is 100%, and the accuracy of the test set is 95.625%. Finally, four models were used to identify water inrush fluorescence spectra of the other three uneven groups. The research results show that the MFO-SC algorithm is effective in identifying the type of water inrush, and can accurately detect the type of water inrush, which has great significance on the safety of coal mine production.
Feb. 01, 2021Vol. 41 Issue 2 435 (2021)
Da-cheng LI, An-jing WANG, Yang-yu LI, Fang-xiao CUI, Jun WU, Zhi-cheng CAO, Yun-yun WANG, and Yan-li QIAO
Aiming at the problem of explosive powder detection on suspected personnel and clothing surfaces in a wide open space, a remote sensing method of explosive powder surface contamination based on NIR spectroscopy was studied, a NIR imaging spectral data acquisition system was developed, the NIR reflection characteristic spectra of various explosive powder and contamination substrates was measured, numbers of explosive powder surface contamination samples were prepared. In view of the aliasing problem for NIR reflection characteristics of explosive powder and substrate, a NIR spectral unmixing correction model was constructed by using NIR spectral data processing technology to remove the interference of contaminated substrate signal on the identification of explosive powder. Aiming at the interference caused by uneven illumination of the light source(saturation due to strong light reflection and weak signal by shadow), the correction score maps were effectively filtered to avoid misidentification problems. In addition, the problem of false identification caused by excessive spectral pretreatment with large background noise was corrected by using the mean spectral reflectance and score maps. The experiments show that the problem of surface contamination aliasing is solved, the interference of illumination and other noise factors are removed, the misclassification is avoided, AP (ammonium perchlorate), CL-20 (hexanitrohexanithine), NQ (nitroguanidine), RDX (blacksorkin), TATB (triaminotrinitrobenzene), Nidi (industrial explosives), fireworks and other explosive powders and mixtures are successfully identified on the substrates of typical background materials (Cotton and linen cloth, chemical fiber cloth), the feasibility of the system and method is verified, the remote sensing imaging alarm of explosive powder surface contamination is realized first in the laboratory, and the effective distance can reach tens of meters, the system has certain application value and development potential.
Feb. 01, 2021Vol. 41 Issue 2 441 (2021)
Ang-xin TONG, Xiao-jun TANG, Feng ZHANG, and Bin WANG
β-phenylethylamine(PEA) is a very important chemical that intermediates raw materials. During the synthetic process of PEA, the final product usually contains NaCl, NaOH and PEA. Therefore, it is of great significance for the synthesis and qualitative measurement of PEA to identify the species of NaCl, NaOH, PEA and the mixture. A rapid method for the identification of NaCl, NaOH, PEA and mixtures was established by UV spectroscopy. Therefore, the absorption spectra of NaCl, NaOH, PEA and the mixture were measured by UV spectroscopy in the interval 190~400 nm. Firstly, the PLS method was used to extract the principal components of the UV spectrum, and a few principal components were used to replace the original variables to reduce the complexity of the model. PLS was used to extract the distribution of score vector values of NaCl, NaOH and PEA in the space of the first three principal components. The accumulative contribution rates of the first three principal components of NaCl, NaOH and PEA were 96.64%, 99.44% and 99.95%, respectively. Therefore, the first three principal components of NaCl, NaOH and PEA contain most of the spectral information. Secondly, three principal components were used as input variables to identify the species of NaCl, NaOH and PEA by using LDA, Sigmoid SVM, RBF-SVM, RBF-ANN, BP-ANN and Artificial Bee Colony(ABC) combined with BP-ANN(ABC-BP-ANN), and the overall sensitivity were 95.6%, 95.6%, 95.9%, 95.8%, 96.9% and 99.6%, respectively. Since the characteristic absorption peaks of NaCl and NaOH are very similar, the score vectors of the principal component would overlap each other, which led to misjudgment for the species identification of NaCl and NaOH. By comparing the results of six classification methods, it is known that ABC-BP-ANN is the best, BP-ANN is the second, RBF-SVM and RBF-ANN are similar, but slightly worse than BP-ANN, LDA and Sigmoid-SVM are the worst. Finally, the mixtures of seven different mole fractions were prepared which ranged from 0% m·m-1 to 60% m·m-1(The molar fraction of the mixture is the percentage of PEA in the mixture), then RBF-SVM, BP-ANN and ABC-BP-ANN are used to identify the species of the mixture. From the results of sensitivity and specificity, it can be concluded that the classification result of ABC-BP-ANN is the best, BP -ANN is the second, RBF-SVM is the worst, and the results of the mixtures are consistent with those of the single component. The results indicated that UV spectroscopy combined with ABC-BP-ANN pattern recognition technology could successfully identify the species of NaCl, NaOH, PEA and the mixture. This method can be used as a simple, rapid and reliable method for the species identification of NaCl, NaOH, PEA and the mixture, and it can also provide theoretical basis and technical support for the synthesis and quality control of PEA.
Feb. 01, 2021Vol. 41 Issue 2 448 (2021)
Chuan-xiao YANG, Wei-bin GONG, Fan TANG, and Xiang-ying SUN
Under the condition of microwave assisted, formaldehyde functionalized polyethyleneimine (FPEI) was synthesized. The maximum emission of FPEI at 470 nm was obtained when the excitation wavelength was set at 340 nm, and the blue fluorescence was easily observed under an ultraviolet lamp. Under this excitation condition, the fluorescence emission peak of the Eosin Y (EY) was located at 540 nm, and the green fluorescence was observed. In acidic medium, the EY and FPEI form a complex through electrostatic interaction. The formation of the FPEI/EY complex resulted in the quenching of EY fluorescence at 540 nm, while the fluorescence intensity of FPEI was only slightly reduced. In the presence of sodium hexametaphosphate (SHMP), competitive binding occurred between SHMP, EY and FPEI. Because the electrostatic interaction between SHMP and protonated amino groups on FPEI surface is stronger than that of EY, EY was gradually released from the PEI/EY complex, resulting in the recovery of EY fluorescence at 540 nm. The fluorescence change ratio between the fluorescence intensity of Ey at 540 nm and the fluorescence intensity of FPEI at 470 (F540/F470) has a good linear correlated with the concentration of SHMP, and a noticeable blue to green changed under an ultraviolet lamp if SHMP solution was mixed with the FPEI/EY. Based on the phenomena, a novel rapid ratiometric fluorescence method for determination of SHMP was developed. Under the optimized conditions, the linear range is 0.1~4.2 μmol·L-1, and the limit of detection (3σ) was 38 nmol·L-1. The proposed method is of high selectivity, simple and rapid, and is successfully applied to determine the concentration of SHMP in tea drink samples.
Feb. 01, 2021Vol. 41 Issue 2 454 (2021)
Ming-yuan GAO, Lan LUO, Rui GUO, Yu WANG, and Peng-peng ZHANG
(Mg1-x-yBaxSry)1.95SiO4∶0.05Eu phosphor series samples were prepared by high-temperature solid-state method (at 1 150, 1 200 and 1 250 ℃). By XRD, PL and photograph records under UV lights, the composition- phase-emission light color relationship was established, and the ternary color diagram was then derived. The influence of fabricated temperatures, both on phase constitution and on emission color, was investigated too. Phase analysis showed that (Mg1-x-yBaxSry)1.95SiO4∶0.05Eu powder would gradually change in phase constitution. Starting from Ba2SiO4 corner, the powder is a single phase till to the ones with the composition having maximum Mg2+ or Sr2+ solution. For Sr2SiO4 or Mg2SiO4 corner, there are two phases in the powder. Phase constitution is gradually complicated as Mg2+, Sr2+, Ba2+ contents are almost the same to each other. Furthermore, the higher the fabricated temperature, the larger Ba2SiO4-single-phase region is. At 1 150, 1 200, and 1 250 ℃ the solid solubility of Mg2+(Sr2+) were 20at% (30at%), 30at% (35at%) and 35at% (40at%). For the mixed-phase region, the number of phase components for the same composition is reduced. PL spectral analysis shows that the green emission is strong and red emission is weaker for the same sample under the excitation comparing 365 nm with 254 nm. The emission color and intensity under ultraviolet excitation change also gradually. Ba2SiO4-phase powders are green phosphors, and its emission intensity increases as the Sr2+ and Mg2+ solution. For the mixture region, the powder changes from green to red phosphor as Ba2+ content decreases, and red phosphors’ brightness decreases gradually as Mg2+ content decreases. For example, (Mg1-ySry)1.95SiO4∶0.05Eu series changes from bright red to dark red phosphor as y increases. When the fabrication temperature is increased, the overall brightness of the phosphor in the Ba2SiO4 single-phase region is improved with the Mg2+, Sr2+ content increases in brightest phosphor composition. The increasing of fabrication temperature also makes the emission intensity of the phosphors in mixed phase region increase, and the green phosphor region becomes larger (under 254 nm excitation, the red-green transition point of (Mg1-xBax)1.95SiO4∶0.05Eu is x1 150 ℃=0.5, x1 200 ℃=0.4, x1 250℃=0.3, (Ba1-ySry)1.95SiO4∶0.05Eu is y1 150 ℃=0.6, y1 200 ℃=0.7, y1 250 ℃=0.8, (Bax(Mg0.2Sr0.8)1-x)1.95SiO4∶0.05Eu is x1 150 ℃=0.5, x1 200 ℃=0.4, x1 250 ℃=0.3. The work has a systematic search on the relationship among composition-structure (phase constitution)-fabrication (temperature)-property(luminescence) for (Mg1-x-yBaxSry)1.95SiO4∶0.05Eu powder, and screened out a series of good phosphors, for examples as (Mg0.35Ba0.6Sr0.05)1.95SiO4∶0.05Eu/(Mg0.6Sr0.4)1.95SiO4∶0.05Eu. Single-phase green phosphor is brighter than mixed-phase green phosphor. The solubility increasing can improve Ba2SiO4 single-phase green phosphor intensity. The higher fabricated temperature, the larger single-phase green phosphor region, the larger mixed-phase green phosphor region, and higher luminescent intensity for (Mg1-x-yBaxSry)1.95SiO4∶0.05Eu phosphors. (Mg1-x-yBaxSry)1.95SiO4∶0.05Eu emission light color dependence of the composition and temperature would be applied to other phosphor series, and it can also give a guide for new luminescent material discovering.
Feb. 01, 2021Vol. 41 Issue 2 460 (2021)
Hai-ming ZHENG, Xiao-peng ZHU, Shuai-shuai FENG, and Gui-hong JIA
Benzene-toluene-xylene (BTX) is an important component of atmospheric pollutants VOCs(Volatile Organic Compounds). Long term exposure to benzene series will greatly increase the risk of human carcinogenesis. BTX has obvious characteristic absorption characteristics in the ultraviolet band. The 250~275 nm band is selected as the research band. This band can include the characteristic absorption of BTX, and a set of equipment for preparing standard gaseous BTX from standard BTX liquid is designed. The continuous light source and differential absorption spectroscopy are used to monitor the single-component benzene and BTX mixed gas. Wavelet transform filtering and polynomial smoothing filtering method are used to evaluate the denoising effect. The results show that the polynomial smoothing filtering is often used in the traditional method of processing the absorption spectral noise, and the detailed information or high-frequency components on the absorption section will be lost in this method. The wavelet transform has good time-frequency localization characteristics. It can perform multi-resolution analysis on the signal through scaling and translation and can focus on any details of the signal. The wavelet transform denoising method can maintain the characteristic structure of spectral lines better, and the signal-to-noise ratio is better than the polynomial smoothing filtering. The absorption cross-section obtained through experiments is compared with the absorption cross-section in the HITRAN database, and it is found that if the absorption cross-section value in the HITRAN database is directly used, it will cause concentration inversion errors due to temperature and pressure changes. In order to be consistent with the actual monitoring environment, the absorption cross-section obtained in the laboratory is used as the standard absorption cross-section. The integrated area method and the least square method are used to retrieve the concentration of benzene. The results show that the measurement accuracy of the two methods can meet the environmental protection requirements, but the least square method is more stable and accurate. For the measurement of BTX mixed gas, the method of inverting the differential absorbance by the concentration value is used to invert the concentration values of benzene-toluene-xylene one by one. The study found that the measurement error of xylene inversion for the concentration of mixed BTX mixtures is less than 2%, but the measurement error of toluene and benzene gradually increased. The maximum error of benzene inversion reaches 9.07%, and the measurement accuracy of benzene is affected by the measurement accuracy of xylene, toluene and the characteristic absorption band characteristics of benzene.
Feb. 01, 2021Vol. 41 Issue 2 467 (2021)
Yun-fei SHA, Wen HUANG, Liang WANG, Tai-ang LIU, Bao-hua YUE, Min-jie LI, Jing-lin YOU, Jiong GE, and Wen-yan XIE
Tobaccos flavor type’s determination is an important field tobacco industry. In this work, 189 tobacco samples with different flavor were tested by middle infrared (MIR) spectrum and near-infrared (NIR) spectrum. After the test, 21 characteristic absorption value from a certain wavelength in the MIR spectrum and 13 characteristic absorption value from a certain wavelengthin the IR spectrum were selected as main variants. Then the characteristic data extracted from MIR and IR spectrum were submitted to the principal component analysis (PCA), respectively. The PCA pattern showed a poor classification result by using MIR and IR data solely. After that, the MIR and IR variants were submitted to PCA analysis as merged data. The PCA pattern calculated from merged data showed a good classification result. Through the data analysis, there different flavor Style (fen-flavor Style, medium flavor Style and robust flavor Style) can be classified clearly into their category. After PCA analysis, different mathematical algorithms as step-back algorithm and genetic algorithm were applied to select 34 variants that used in PCA model. 24 variants and 19 variants were selected by step-back algorithms and genetic algorithms, respectively. Compared to the projection pattern by using different variant selected by a different algorithm, we found that though the genetic algorithms used the least variants, the classification result is as good as PCA algorithms and step-back algorithms. After that, genetic algorithms were chosen to make projection drawing that separated three different flavors into different planes by using least variants chosen from MIR and IR merged data. Finally, a support vector classification(SVC)model was built to determine different tobacco flavor by using the variants selected by the genetic algorithm. The accuracy of the model was 92.72%, the accuracy in discriminating fen-flavorstyle, medium flavorstyle and robust flavorstyle were 93.75%, 92.11% and 91.84%. The accuracy of predicted outputs was tested by the leave-one-out cross validation (LOOCV). And the accuracy of LOOCV was 88.24%, the accuracy in discriminating fen-flavorstyle, medium flavorstyle and robust flavorstyle were 90.63%, 86.84%, and 87.76%. The accuracy in prediction of the unknown sample was 86.84% and the accuracy in discriminating fen-flavorstyle, medium flavorstyle and robust flavorstyle were 88.24%, 85.71% and 85.71%. The results of accuracy are above 85% in model test, LOOCV teat and the prediction of unknown sample. The result shows that the mixing data from the MIR spectrum and NIR spectrum can provide more information in the mathematical model building and provide an efficient way in fast tobacco flavor discrimination.
Feb. 01, 2021Vol. 41 Issue 2 473 (2021)
Xue LI, Li WANG, Guang-xian LIU, and Zong-cai TU
In this experiment, the effect of urea with different concentrations (0~7 mol·L-1) on the glycosylation of BSA with D-Glucose was investigated at the molecular level by spectral techniques. After urea treatment, the intrinsic fluorescence intensity and the free amino group content of BSA-Glucose glycosylation product were all significantly decreased. Synchronous fluorescence spectra showed that the binding point of BSA and urea was near tryptophan residue. Ultraviolet spectrum analysis showed that the ultraviolet absorption value of glycosylation product was all increased with different the increase of urea concentration. The three-dimensional fluorescence spectra showed that the maximum emission wavelength of BSA firstly shifted red and then blue with the increase of urea concentration, indicating that its structure extended, which promoting the glycosylation reaction of BSA. These results indicated that urea treatment could make the spatial structure of BSA extend to different degrees, and the degree of glycosylation is maximum when urea concentration is 3 mol·L-1.
Feb. 01, 2021Vol. 41 Issue 2 478 (2021)
Shi-xia WANG, Tian-yi HU, and Meng YANG
Zinc oxide (ZnO), a semiconductor material with a wide band gap, has the excellent properties on photoelectric performance, mechanical behavior and chemical characteristic. The structure of ZnO material has a great influence on its properties. Element doping may change the crystal structure and band gap width of ZnO, which is an effective means to improve the performances of ZnO. And Ag doped ZnO is commonly used to improve the photocatalytic efficiency. High pressure is an important method to control the structures and properties of materials besides temperature and composition. It is also an important factor to produce new materials and new regulatory principles. By comparing the high-pressure phase transition behavior of pure ZnO crystal and Ag doped ZnO crystal, the research reveals the effect of element doping on the structures and properties of ZnO nanocrystals. ZnO and Ag-doped ZnO nanomaterials (1∶150Ag/ZnO) are first prepared by hydrothermal synthesis. XRD and SEM results show that the pure ZnO and Ag-doped ZnO nanospheres are hexagonal wurtzite structure, and which morphology are formed by self-assembly of small nanoparticles. With the doping of Ag ions, the lattice constant of ZnO increases and the lattice volume expands. The high-pressure structure phase transition behaviors of pure ZnO nanomaterials Ag/ZnO nanomaterials are investigated using Diamond Anvil Cell combined with in-situ Raman spectroscopy. Compared with the pure ZnO, the Raman characteristic peak width of 1∶150Ag/ZnO (439 cm-1in E2 highvibration mode) becames narrower and moved to lower frequency, which is similar to the Raman spectra of amorphous ZnO. It shows that the replacement of Ag+ to Zn2+ affects the Zn—O bond and the long-range order of ZnO lattice structure. During the process of adding pressure, the Raman peak 439 cm-1 of hexagonal wurtzite structure ZnO shows instantaneous weakening and broadening. With the pressure increased to 9.0 GPa, the Raman peak of wurtzite ZnO 439 cm-1 disappears and a new peak of 585 cm-1 emerges, which indicates that the structure of ZnO crystal changes from hexagonal wurtzite structure to rock salt structure. With the pressure of system adding to 11.5 GPa, which the Raman peak of 585 cm-1 is significantly enhanced and the peak shape becomes narrow, the phase transition is completed. The transformation pressure of 1∶150Ag/ZnO from hexagonal wurtzite structure to cubic rock salt structure is 7.2 GPa, which is lower than that of pure ZnO nanomaterials by 9.0 GPa. The possible reason is that doping makes ZnO lattice expands and crystal structure relaxes, the relative volume change of two phases increases, which lead to the decrease of phase transition barrier and the phase transformation of samples happen at lower pressure. The high-pressure study of nanomaterials reveals the influence of element doping on the structural stability of materials, which is a potential method for the regulation principle of nanomaterials.
Feb. 01, 2021Vol. 41 Issue 2 484 (2021)
Bing-xin LIU, Gang GUO, Dong-lai WU, Cheng-yu LIU, and Feng XIE
Annex V of the Convention on the Prevention of Pollution from Ship (MARPOL) stipulates that dry residues containing substances harmful to the marine environment (HME) must be discharged at port reception facilities. However, many ships discard the waste directly into the ocean. Shipment of iron ore powder scattered on the surface of sea ice will pollute the sea ice and accelerate the melting of it, causing pollution to the marine environment. The research on the spectral reflectance of sea ice contaminated by iron ore powder can provide data basis for sea ice quality monitoring using optical remote sensing images. The purpose of this paper is to provide a reference and basis for the estimation of the range of iron powder pollution by measuring on-site spectral differences between sea ice and that covered iron ore powder particles with different area proportions. The experiment was conducted on natural sea ice in the Bohai Sea. The spectral characteristics of sea ice with iron ore powder were obtained and analyzed, and the correlation between these spectral characteristics and the area fraction of iron ore powder particles was discussed. In order to retrieve the fraction of the area of iron ore powder on the surface of sea ice, the end-member extraction of sea ice and iron ore powder was performed using the spectral vector angle cosine value (Acos) and the spectral absorption index (SAI) threshold. Based on the linear spectral unmixing theory, a feature-based inversion model of iron powder fraction on the surface of sea ice was proposed. The proportion of iron ore powder on the surface of sea ice in this paper is 0 (clean sea ice), 25.8%, 37.2%, 46.1%, 52.1%, 65.1%, 72.5%, 82.3%, 92.3%, 93.1%, and 100% (Pure iron ore powder), etc., the data collection wavelength range is 350~2 500 nm. The results show that the absorption index at 1 460 nm band is the best for extraction of sea ice and iron ore powder. The reflectance in the range of 918~1 400, 1 500~1 780 and 2 250~2 300 nm have a great correlation with the area fraction, which are all greater than 0.90. The correlation coefficients of reflectance and area fraction at more than 86% are above 0.90, and more than 91.75% of bands have a correlation coefficient that above 0.80. The average reflectance of 1 610 to 1 630 nm was selected to estimate the proportion of iron ore powder area. The predicted results of samples with larger area performed better than these of smaller. The average accuracy of area fraction prediction of the iron ore powder on the sea ice is 94.23%.
Feb. 01, 2021Vol. 41 Issue 2 489 (2021)
Zi-yao YIN, Jun-sheng LI, Hai-sheng FAN, Min GAO, and Ya XIE
The concentration of suspended matter and water clarity are basic parameters for water quality investigations and important indexes to evaluate the quality of water environments. Remote sensing technologies can be used to realize the inversion of the main water quality parameters in a large range, quickly, and at low cost; however, those same technologies cannot be applied to inland water bodies that extend over small areas and have complex and variable water qualities. The Zhuhai-1 satellite constellation is composed of new hyperspectral satellites launched by the Zhuhai Orbita Aerospace Technology Company. Such satellites possess high spatial, temporal, and hyperspectral resolutions; moreover, they have considerable potential for the monitoring of inland water quality. The applicability of remote sensing to the monitoring of inland water quality parameters using data from the Zhuhai-1 satellites has not been studied in detail, and satellite ground synchronization experiments need to be carried out to test its effectiveness. In this paper, we considered remote sensing data collected from those hyperspectral satellites to study the Yuqiao reservoir: based on water surface synchronous data, we constructed inversion models of suspended matter and water clarity using the empirical regression method, and subsequently tested their accuracy. The test results showed that the best band combinations for the inversion models, in order to obtain the concentration of suspended matter and the water clarity in the Yuqiao reservoir, were Rrs(684)/Rrs(540) (relative error=8.6%; root mean square error=1.0 mg·L-1) and Rrs(656)/Rrs(556) (relative error=11.7%; root mean square error=18.2 cm), respectively. The distribution map of the water quality parameters in the Yuqiao Reservoir on November 22, 2018 was obtained by using the modeling formula: suspended matter was found to be more abundant in the north than in the south, while water clarity was lower in the north and higher in the south. These spatial distributions mainly depended on the configuration of the Yuqiao reservoir, in which the water depth increases from north to south: in the case of a deeper water column, sediments are less likely to be resuspended. According to the inversion modeling of the water quality parameters and to the test results of the measurements conducted on the Yuqiao Reservoir, we conclude that the hyperspectral remote sensing data of Zhuhai-1 can be used to retrieve the water quality parameters quantitatively. These results have important implications for the monitoring of inland water quality; still, more satellite-ground synchronization experiments are needed to improve further the preprocessing of data and the correspondent inversion models.
Feb. 01, 2021Vol. 41 Issue 2 494 (2021)
Yan-jie CHEN, Yu-qian CUI, Qing-song LI, Bo-qiang LI, Ji-ping WANG, Guo-yuan CHEN, Jie LIAO, and Guo-xin LI
3-DEEM fluorescence spectroscopy and original fluorescence integration (3DEEM-FRI) analysis were adopted to analyze the correlation between the normalized fluorescent integral volumes and the fluorescence characteristics of the dissolved organic matter (DOM) in the raw water from reservoirs in Xiamen and Zhangzhou. The results showed that the components of aromatic protein (Component Ⅰ, C1 and Component Ⅱ, C2) and the fulvic acid (Component Ⅲ, C3) were significantly detected in all water samples. The component of soluble microbial metabolites (Component Ⅳ, C4) were detected in the water sample of Lianhua reservoir, Bantou reservoir and Shidou reservoir, while the component of humic acid (Component Ⅴ, C5) were not found obviously in any of the water samples. The relative contents of the same component are similar in different water samples. The proportion of aromatic protein components (P1, n+P2, n) is larger than 60%. The proportion of fulvic acid components (P3, n) is between 10% and 20%, as well as microbial metabolites components (P4, n), while the proportion of humic acid components (P5, n) is lower than 6%. The fluorescence characteristic parameters (1.28β∶αФT, n) is significant (R2=0.979 34), and NH4+-N showed good correlation with the normalized fluorescent integral volumes of microbial metabolites components (Ф4, n)(R2=0.827 98). The R2 between the (P3, n+P5, n) and SUVA are 0.703 25. This study demonstrated that 3-DEEM-FRI analysis could not only be used to analyze the compositions and pollutant source of the DOM, but also track and indicate the contents of TOC, NH4+-N and the humification degree of raw water effectively.
Feb. 01, 2021Vol. 41 Issue 2 499 (2021)
Hong-ming LIU, Yu-juan LIU, Zhi-cheng ZHONG, Ying SONG, Zhe LI, and Yang XU
As an important strategic resource, petroleum has an important significance in real-time analysis and detection of its components in the petrochemical industry. With the continuous development of petroleum resources, in the production process of long-term oil wells and before the exploitation of new oil wells, it is necessary to analyze and test the components of underground crude oil to determine the necessity of mining. Real-time detection of crude oil components plays a key role in the process of crude oil exploitation, production, storage, transportation and sales. In view of the low accuracy and low efficiency of traditional detection methods, near-infrared spectroscopy, which has been widely and effectively applied in the field of measurement, has been introduced into the research methods of crude oil components detection technology in recent years. In this paper, the underground crude oil was used as the research object, and the experimental samples of 39 components with crude oil ratio of 1%~20% were prepared by using the purified crude oil and water obtained from Daqing Oilfield to simulate the underground crude oil. In this paper, the basic principle of the measurement of crude oil components by near-infrared spectroscopy is studied. The near-infrared spectroscopy data measurement system of crude oil samples is integrated with the halogen source and supporting components by SW2520 near-infrared spectroscopy, and 39 groups are collected by this measurement after system standardization testing. Moving window smoothing Savitzky-Golay convolution smoothing and Savitzky-Golay convolution derivation method of near infrared spectrum data of crude oil near infrared spectral data is used to remove noise, two analysis methods of near-infrared spectra of crude sample partial least squares and support vector machine (SVM) regression method are used for retreatment modeling, crude oil component analysis prediction model is established respectively. The results show that the RMS predicted by partial least square method is 0.003 755 14, and the coefficient of determination R2 was 0.999 999. The prediction effect is very good. In this study, the near infrared spectroscopy (NIRS) technology is used to test and analyze the simulated test samples with different proportions, which provides a new idea for the detection of the components of the downhole crude oil. This method effectively solves the detection problem of the water content of the crude oil and provides technical support for the development of the real-time crude oil detection and analysis equipment in the field.
Feb. 01, 2021Vol. 41 Issue 2 505 (2021)
Xue-mei LIU, Xiao-lin WANG, Zeng-feng QIU, Ya-dong WANG, Bin ZHANG, Chao XU, and Hong-zong YIN
Small biomolecules in the human body have important effects on the health of the living body. Some of them are involved in the blood circulation and immune system of the living body Therefore, the detection of small molecules in living organisms in the study of small molecules in the physiological function of life is of great significance. Fourier Transform Surface Plasmon Resonance (FT-SPR) spectroscopy has been widely used in molecular detection in recent years due to its advantages of simple operation, high sensitivity, few samples required and real-time detection But for different molecules, especially those with very small molecular weight, FT-SPR direct detection has some disadvantages, such as unstable signal and low sensitivity. Therefore, a series of SPR small molecule sensors can be constructed for different detection targets to remedy the above shortcomings. In this paper, the research progress in the detection of small molecules by SPR technology is reviewed from the aspects of immunosensor (direct detection, Sandwich detection, competitive detection and inhibition detection), SPR molecular imprinting sensor and other SPR based sensors. The prospect of its development is also given.
Feb. 01, 2021Vol. 41 Issue 2 511 (2021)
Xue XIA, Yun-xia PAN, and Meng-zhu LI
The discharge of dye wastewater has become a serious threat to human health and the ecosystem. Photocatalytic technology has shown attractive potential in eliminating environmental pollution problems owing to its simple operation and environment-friendly. Graphite-like phase carbon nitride (g-C3N4) was considered to be one of the most promising photocatalysts for its low cost and high chemical stability in the field of photocatalysis. However, poor specific surface area, limited optical absorption and high charge carrier recombination rate restricted its photocatalytic efficiency. Thus, a novel graphitic carbon nitride(g-C3N4-N) photocatalyst was synthesized by thermos-induced copolymerization modification method using urea and o-Aminobenzontrile, and its effect on photocatalytic degradation ability of RhB was evaluated based on solution pH value, g-C3N4-N dosage, and RhB concentration. In addition, both the photocatalytic degradation mechanism of RhB and its degradation path by g-C3N4-N were also analyzed through XRD, BET, UV-Vis in this research. The results showed that g-C3N4-N synthesized using copolymerization modification method was pure graphite-like phase g-C3N4-N, with the stable performance of a photocatalytic activity, large specific surface area and porous structure. Under visible light conditions, the photocatalytic degradation efficiency of RhB was found to be optimal with initial pH of 3, RhB concentration of 10 mg·L-1 and g-C3N4-N dosage of 50 mg, and the adsorption removal rate of RhB was achieved 30% within 30 minutes in dark reaction. Besides, its photocatalytic degradation removal rate of 120 minutes reach 97.7%. Under the catalysis of visible light, RhB molecules adsorbed on the surface of the g-C3N4-N was firstly degraded into macromolecular intermediates such as DER, EER and AR through rapid N-de-ethylation process, then base on redox reaction of holes, ·OH and ·O2-, conjugated structure of these intermediates was cracked and ring-opened to generate some small molecules, such as succinic acid, resorcinol, and propionic acid, and so on. After that, the removed ethyl groups were gradually oxidized to ethylene glycol. And these small molecules were eventually mineralized into CO2 and H2O.
Feb. 01, 2021Vol. 41 Issue 2 517 (2021)
Li-hong TONG, Ling ZHU, Nan ZHAO, Yi-zhong LÜ, Xia-yan LIU, Shan JIANG, and Ying-xin LI
This study explored the effects of different proportions of organic and inorganic fertilizers on soil humus characteristics based on the 16-year long-term localization experiment. The humic acid (HA) and fulvic acid (FA) components in the humus are separated and purified, and studied the changes of HA and FA contents and structure utilized chemical analysis and various spectroscopy techniques under three fertilization of F1 (70% chemical fertilizer +30%organic fertilizer), F2 (50% organic fertilizer+50% chemical fertilizer) and F3 (100% organic fertilizer). The results showed that the effect of F3 on improving HA and FA content was better than that of F1 and F2 treatments, indicating that the higher application rate of organic fertilizer, the higher content of soil humus components. Elemental analysis showed that different ratios of organic and inorganic fertilizers had different effects on the content and atomic ratio of HA and FA. F2 and F3 both increase the degree of HA condensation, reduce the degree of oxidation and polarity, and the effect of F3 is obvious; the application of organic fertilizer can also promote the formation of nitrogen compounds in HA, and the effect is the best in F2; The application of organic fertilizer also increased the degree of condensation of FA, reduced the degree of oxidation and polarity, and promoted the formation of nitrogen-containing compounds, especially in the F2 treatment. Infrared spectroscopy analysis of humus showed that compared with F1, F2 and F3 increased the content of aliphatic compounds and carbohydrates in HA, and the carboxyl group and fat group content of FA also increased, and it was the most significant in F3 treatment. F2 treatment reduced the content of fatty hydrocarbons in HA, and the carbohydrates in FA reached the highest. 13C NMR spectroscopy analysis showed that the application of organic fertilizer increased the degree of aromatization of HA and FA and decreased the degree of aromatization in the three treatments, and the change of HA functional group in F2 treatment was significant, FA changed more obvious in F3 treatment. In summary, organic fertilizer significantly increased the content of soil humus components and increased the degree of aromatization of HA and FA, but the formation mechanism of HA and FA under different amounts of organic fertilizer was different.
Feb. 01, 2021Vol. 41 Issue 2 523 (2021)
Zhi-dan ZHANG, Min-shuang ZHAO, Li-na ZHANG, Hang LIU, Rui LI, Qian-nan SHENG, Dan GUO, Xiao-yi ZHAO, Jin-jing ZHANG, and Shuang-ling ZHONG
X-ray diffraction (XRD) spectrum is an important method to analyze the clay mineral composition of the soil, but conventional XRD analysis has some problems such as complex preprocessing, long time-consuming, low spectral resolution and insufficient scanning. So based on the 4B9A diffraction experiment station of Beijing Synchrotron Radiation Facility (BSRF), 7 zonal forest soils (including brown coniferous forest, dark brown soil, brown soil, yellow brown soil, yellow soil, red soil and red brick soil) in different climate zones (temperate zone, subtropical zone and tropical zone) in the east of China were studied in this study. The characteristics of clay mineral composition in soils were analyzed by using synchrotron radiation X-ray diffraction (SR-XRD) spectra. The results showed that: (1) the texture of temperate soil (i. e. brown coniferous forest, dark brown soil and brown soil) was mainly clay loam, while that of subtropical soil (i.e. yellow brown soil, yellow soil and red soil) was distributed on the boundary line between clay and clay loam; from subtropical to tropical, the texture of soil presented the changing trend of clay loam and sand. (2) Sa of the soil showed the trend of temperate soil (5.22) > tropical soil (4.53) > subtropical soil (4.49); similarly, Saf also showed the trend of temperate soil (4.06) > tropical soil (3.53) > subtropical soil (3.36). (3) From the temperate zone to the tropical zone, the content of kaolinite and crystallinity of clay minerals in the soil increased, while the content of illite decreased gradually. In the temperate zone, the clay minerals were mainly 2∶1 type, while in the tropical zone, the clay minerals were mainly 1∶1 type. The existence of two kinds of clay minerals, i.e. illite mixed layer and feldspar, was identified in the SR-XRD spectrum, while was not identified in the conventional XRD spectrum. (4) Compared with the conventional XRD method, the SR-XRD method had the following advantages in the analysis of soil clay mineral composition: First, the preprocessing work was less, the conventional XRD method needed to determinate clay samples in different types of glass slides, while the SR-XRD method could directly determine clay samples; Second, the optical spectrum resolution was high, and the resolution of SR-XRD method could reach ≤100 nm, so more clay could be detected; Third, the optimized scanning step length of SR-XRD method could be 0.04, which was two times as that of conventional XRD method, thus improving the testing efficiency; Four, the scanning identification degree was increased, and the viewing time of SR-XRD method could be optimized to 4 minutes, which was 2 times of that of conventional XRD method, which made the scanning of samples more full.
Feb. 01, 2021Vol. 41 Issue 2 529 (2021)
Wen-zhi YIN, Ting-yu WANG, Tuo ZHU, Chao-qun MA, Jiao GU, Chun ZHU, Lei LI, and Guo-qing CHEN
Three-dimensional fluorescence spectra of milk of three brands (9 types) were measured by FLS920P fluorescence spectrometer, including pure milk and fresh milk, whole milk and skim milk. The fluorescence peak wavelength of milk is about 349 nm, the full width at half maximum (FWHM) is about 66 nm, the optimal excitation wavelength is about 291 nm, and the average lifetime is about 4.6 ns, the results show that the fluorescence spectrum of 9 kinds of milk is basically the same except the fluorescence intensity. The fluorescence peak wavelength of the casein solution is 344 nm, the FWHM are 66 nm, the optimal excitation wavelength is 295 nm, and the fluorescence lifetime is 4.1 ns. The fluorescence peak wavelength and fluorescence lifetime of casein are similar to that of milk. After comparing other fluorescent substances in milk, it is inferred that casein is the main fluorescent substance in milk. In order to explore the differences in fluorescence intensity of 9 types of milk, the fluorescence emission spectra under the optimal excitation wavelength of 9 types of milk are compared. The fluorescence intensity of the whole milk of the same brand is significantly lower than that of skim milk. By comparing the normalization fluorescence spectra of whole milk, skim milk and centrifuged whole milk, the fluorescence intensity of centrifuged whole milk is between that of whole milk and that of skim milk. Centrifugation of milk results in less fat and less scattering and increase fluorescence intensity. The full fluorescence emission spectrum of milk shows that the Rayleigh scattering intensity of whole milk is significantly higher than that of skim milk, whole milk has a high-fat content and strong scattering, the excitation light is scattered more after it enters the whole milk, resulting in the Rayleigh scattering intensity of the whole milk being higher than that of skim milk. The light transmittance curve shows that the transmittance of whole milk is lower than that of skimmed milk, when incident light passes through whole milk, in addition to the part of it being absorbed by casein, part of it is lost due to fat scattering, and the transmittance is reduced, so that thetransmittance of whole milk is lower than that of skim milk. In this paper, the main fluorescent substances of milk are determined by using fluorescence spectroscopy without pretreatment. Moreover, the reason for the difference in fluorescence intensity between whole milk and skim milk is explained.
Feb. 01, 2021Vol. 41 Issue 2 535 (2021)
Xing-hu FU, Fei ZHAO, Zhen-xing WANG, Xin LU, Guang-wei FU, Wa JIN, and Wei-hong BI
A method based on Raman spectroscopy and improved artificial bee colony algorithm to optimize the support vector machine regression (IABC-SVR) algorithm for rapid quantitative detection of goat serum protein content was proposed. The traditional artificial bee colony algorithm gradually slows down the convergence rate when the data area is large in size, which causes problems such as low efficiency, decreased accuracy, and high optimal local solution probability. The proposed algorithm solves these problems so that the algorithm avoids falling into the local optimal solution in the early stage of evolution, and can maintain the global search ability of the solution in the middle and late stages of evolution. Conventional methods for measuring total serum protein usually use Kjeldahl method, biuret method, etc., which has the disadvantages of slow aging and contaminated samples. This paper uses Raman spectroscopy for detection, which has the advantages of fast and non-destructive. Using goat serum as the analysis object, configure 35 groups of samples to be measured according to a certain volume ratio. Raman spectra were collected using a Raman spectrometer with a spectral collection range of 300~1 300 cm-1. Baseline correction was used to remove the fluorescent background, and Savitzky-Golay spectra were used to smooth this method smoothes the original spectrum, normalizes the spectral data, and assigns the characteristic peaks of the Raman spectrum. The experimental results show that Raman spectroscopy can characterize the information of the main chemical groups in the serum, and due to the difference in functional group concentration, the spectral characteristic peak intensity changes significantly with the concentration, so the total serum protein can be determined based on the characteristic peak information. In the experiment, based on the purchased goat serum protein content, the protein content of each group of serum samples was obtained by configuring the volume ratio of the samples. The volume of a single liquid sample was 3 mL. Eight groups of experimental samples were randomly selected as the model test set. The remaining 27 groups are used as model training sets. The processed spectral characteristic peak intensity and the corresponding serum protein content were used as the input and output values of the model to establish a quantitative model of IABC-SVR, ABC-SVR, and BP algorithms to predict the total serum protein in the test set. Finally, the mean square error (MSE), correlation coefficient (r) was compared with the modeling time, and the results showed that the goat serum protein quantitative correction model established by IABC-SVR had the best effect. The correlation coefficient of the model was 0.990 27, and the mean square error was 0.244 3, the modeling time is 1.9 s, the variance of the predicted values are less than 0.001 g·mL-1, and the prediction accuracy is 99.8%. The experimental results show that the laser Raman spectroscopy technology combined with the IABC-SVR algorithm has high accuracy and stability for the rapid quantitative detection of goat serum protein content.
Feb. 01, 2021Vol. 41 Issue 2 540 (2021)
A Method for Correcting Nitrofurantoin Raman Signal in Honey Based on Internal Standard of Substrate
Shuai YAN, Yong-yu LI, Yan-kun PENG, Ya-chao LIU, and Dong-hai HAN
In order to solve the problem of poor reproducibility of surface-enhanced Raman spectroscopy signals, this paper explored the surface-enhanced Raman spectroscopy correction method based on internal honey standard using the Raman point detection system built by the laboratory. Firstly, the Raman characteristic displacement at 739 cm-1 was determined to be the standard internal peak of honey by surface enhanced Raman spectra of honey samples and Raman spectra of standard products of nitrofurantoin. The ratio method was used to correct the Raman characteristic peak strength of nitrofurantoin at 1 353 and 1 612 cm-1 for quantitative analysis in honey. The surface-enhanced Raman spectra of nitrofurantoin honey samples with a concentration of 20 mg·kg-1 were collected for 30 times under the same conditions, and the peak intensity relative standard deviations of nitrofurantoin at 1 353 and 1 612 cm-1 was 11.515 6% and 11.162 5%, respectively. However, after using the Raman characteristic peak intensity at 739 cm-1 as the internal standard to correct the peak intensity of nitrofurantoin at 1 353 and 1 612 cm-1, the relative standard deviations were reduced to 4.852 6% and 4.733 2%, respectively. The repeatability and stability of the surface-enhanced Raman characteristic peaks are significantly improved. Because the instrument system errors and surface enhanced during uncontrollable factors and errors human-induced surface of the sample enhanced 739 cm-1 honey characteristic peak intensity spectrum and at 1 353 and 1 612 cm-1 nitro nitrofurantoin characteristic peak intensity the effects are the same, it is possible to effectively eliminate the difference between the Raman signals and decrease the stability or poor repeatability problem by internal standard ratio method. Because the error of the instrument system and the artificial error caused by uncontrollable factors in the surface enhancement process have the same effect on the peak strength of 739 cm-1 honey characteristic peak and the peak strength of 1 353 and 1 612 cm-1 nitrofurantoin characteristic peak in the sample surface enhancement spectrum, therefore, the internal label ratio method can effectively eliminate or reduce the problem of Raman signal stability and poor repeatability. Finally, 69 honey samples with a nitrofurantoin concentration range of 0.4~20 mg·kg-1 were collected. Based on Raman characteristic peak intensity at 1 353 and 1 612 cm-1 of nitrofurantoin and Raman characteristics at 739 cm-1 of honey, The linear regression prediction model and the multi-linear regression model were established respectively, in which the unary linear regression model based on the internal standard of honey at 739 cm-1 to correct the Raman characteristic peak intensity at 1 612 cm-1 of nitrofurantoin with higher precision and predictability. In this model, the determination coefficient of the calibration set and validation set is 0.971 2 and 0.969 6 respectively, and the root means square error of calibration set and validation set are 1.115 1 and 1.242 2 respectively, and the relative analysis error is 4.306 0. The results show that the sample of the underlying itself holds the inherent internal criteria without adding additional internal markers, and the simple internal standard ratio method can effectively eliminate the effect of the instrument’s system error and the mixing time between surface enhancers and samples on the Raman signal strength, and significantly improve the repeatability and stability of the Raman characteristic signal. It provides a technical reference for the quantitative analysis of surface-enhanced Raman spectra.
Feb. 01, 2021Vol. 41 Issue 2 546 (2021)
Tao CHANG, Xin XIE, Mei GUAN, Qiu-ping ZHANG, Zhen-qian ZHANG, and Chun-yun GUAN
Rape is the largest domestic plant oil source in China. It is necessary to apply appropriate micro fertilizer in field production to improve yield and quality. It is very important to build a model which can quickly screen the micronutrient fertilizer to improve the yield of rape. In this research, the spectral reflectance of high oleic acid rape “FanMing No.1” in the whole growth period under different micro fertilizer conditions was measured by ground object spectrometer. And chlorophyll content was accurately determined by ethanol extraction method. The correlation between spectral reflectance, chlorophyll content and final yield was analyzed. The yield test showed that the application of micro fertilizer could increase the yield of rape and the content of chlorophyll at the bolting stage. It could increase the yield of a single plant by up to 2%. The correlation analysis of spectral parameters and chlorophyll showed that the correlation between chlorophyll content and spectral parameters was high at 550 and 720 nm, which indicated that the spectral parameters could be used to predict yield and screen out the micro fertilizer which could improve the yield of rape. The correlation analysis of chlorophyll content and yield showed that the correlation between chlorophyll content and yield was high at the bolting stage. The correlation analysis between the spectral parameters and the yield showed that there was a significant negative correlation between the reflectivity of 550 and 720 nm and the yield. The correlation analysis between the spectral parameters and the yield showed that there was a significant negative correlation between the reflectivity of 550 and 720 nm and the yield. Comprehensive analysis of fertilization, spectral parameters, yield and chlorophyll changes showed that the linear equation of the correlation coefficient between the spectral parameters 550 and 720 nm and yield could be used to screen the micro fertilizer, and the linear equation was y=-32.362x+33.097, y=4.069 5x+35.386, y=28.849x+23.735, y=-19.023x+31.005, y=12.447x+24.586, and R2 was greater than 0.6. Comprehensive analysis of fertilization, spectral parameters, yield and chlorophyll changes showed that the yield of rape increased when the linear equation R2≥0.6, which was stimulated by the spectral parameters 550 and 720 nm and the yield correlation coefficient, was applied. The results show that the spectral parameters of bolting stage can be used to predict the yield and then screen out the micronutrient fertilizer that can improve the yield of rape, which will increase the sample size to further detect the correlation and carry out subsequent verification. In view of the high efficiency of the process with no chemical reagents and destructive sampling of the samples and low cost, the establishment of the model is of great significance for the rapid screening of the formulation of high oleic acid rape micronutrient fertilizer, which provides a theoretical basis for screening the micronutrient fertilizer and promoting the yield of rape.
Feb. 01, 2021Vol. 41 Issue 2 552 (2021)
Meng-li LI, Yong YIN, Yun-xia YUAN, Xin LI, and Xue-ru LIU
In order to use three-dimensional (3D) fluorescence technology to realize early warning of banana spoilage based on storage room gas, the storage room gas corresponding to two batches of banana with different storage dates were tested to collect 3D fluorescence data. Firstly, the 3D fluorescence data was pre-processed: to eliminate the overall drift of the scanning data of the 3D fluorescence instrument, the drift of the obtained 3D fluorescence data was processed; the removal and interpolation of Rayleigh and Raman scattering were handled by using the eemscat toolbox in matlab platform, which effectively eliminated the adverse effects of Rayleigh scattering and Raman scattering; and the Savitzky-Golar (SG) method was employed for data smoothing to reduce the influence of noise on the fluorescence signal. Meanwhile, the 3D fluorescence data were preliminarily screened, the emission wavelengths with fluorescence intensity close to 0 were removed, and the more discrete excitation wavelengths were removed by using a third-order Gaussian mixture distribution to fit the emission spectra at different excitation wavelengths. Then, aiming at the feature selection of 3D fluorescence data, a feature wavelength selection strategy based on Wilks Λ statistic combined with interval partial least squares (iPLS) was proposed. The specific steps are: step 1, using Wilks Λ statistics to select feature excitation wavelengths, and five feature excitation wavelengths were preliminarily selected; step 2, based on the initially selected feature excitation wavelengths, the iPLS method was used to select the feature emission bands in combination with pH and relative conductivity, and feature emission band including 14 wavelengths was selected at each feature excitation wavelength; step 3, in order to further reduce the number of analysis variables, according to the selected feature emission band, Wilks Λ statistics was used againto select the feature excitation wavelengths inversely, and 3 feature excitation wavelengths were finally obtained. Combined with 14 emission wavelengths at each feature excitation wavelength, a total of 42 feature emission wavelengths were selected. Finally, considering the time-varying characteristic of banana quality during storage, with the help of the 42 feature emission wavelengths, systematic cluster analysis (SCA) was employed to define the benchmark for banana spoilage, and the cluster results showed that both batches of bananas had abrupt changes in quality on the 5th day of storage. Therefore, the fluorescence information of the storage room gas on the 5th day was used to characterize the banana spoilage. In addition, these feature wavelength variables were computed by principal component analysis (PCA), and the first principal component was preliminary explore to realize early warning of banana spoilage. The research results show that the selection strategy of feature wavelengths of the 3D fluorescence data proposed in this paper can effectively reduce the complexity of the spectral data so as to facilitate subsequent analysis and the early warning method of banana spoilage is also feasible.
Feb. 01, 2021Vol. 41 Issue 2 558 (2021)
Ya-xuan WANG, Feng TAN, Yuan-ming XIN, Huan LI, Xiao-yu ZHAO, and Bao-xin LU
It is difficult for consumers to distinguish regional rice brands formed by geographical factors instead of rice of similar producing areas. Based on Raman spectroscopy, the experiment compared three common pretreatment methods including first derivative+translational smoothing, second derivative+translational smoothing, wavelet transform+baseline removal. In addition, an improved piecewise polynomial fitting+baseline removal was proposed, and a total of four pretreatment methods respectively were combined with partial least square method to identify rice of similar origin, and an optimal pretreatment method for identifying rice of similar origin was proposed. Firstly, 150 rice spectral samples with a Raman displacement of 200~3 100 cm-1 were collected by Raman spectrometer from three similar producing areas in an county, Heilongjiang province. Then, the original Raman spectra were preprocessed by first derivative + translational smoothing, second derivative+translational smoothing, wavelet transform+baseline removal, and piecewise polynomial fitting + baseline removal. A total of 99 samples were selected from 33 samples from each origin for training, and a partial least square analysis model based on partial least square method was established for the unknown 51 samples. In the training set, the preprocessing method of first derivative+translation smoothing had the maximum correlation coefficient value, the minimum mean square error and the minimum root mean square error. Andwavelet transform+baseline removal hadthe minimum correlation coefficient value, the maximum mean square error and the maximum root mean square error. In the test set, the preprocessing method of 3 points and 2 times fitting+baseline removal had the maximum value of correlation coefficient, the minimum mean square error and the minimum root mean square error, and the preprocessing method of the second derivative+translation smoothing was the worst. Finally, the PLS modeling results showed that, in the training set, the correct discrimination rate of rice from three producing areas was 100% by using four kinds and nine pretreatment methods. In the test set, the total recognition rate of rice from three producing areas was 100% by using 3-point 2-time fitting+baseline removal, and 52.9% by using 5-point 2-time fitting + removing baseline. Other piecewise polynomial fitting was between the two. The total recognition rates of the first derivative + translation smoothing, the second derivative + translation smoothing and the wavelet transform were 88.2%, 86.2% and 96.1%, respectively. It is found that the preprocessing method of 3-point 2-time fitting + removing baseline in piecewise polynomial fitting has obvious advantages and is consistent with the results of the correlation coefficient, mean square error and root mean square error, with high overall recognition rate and stable identification effect.
Feb. 01, 2021Vol. 41 Issue 2 565 (2021)
You-fu LIU, De-qin XIAO, and Chun-tao WANG
The size of the egg air-cell is one of the important indicators for monitoring the hatching process of the eggs. According to the thermodynamic structure of the breeding egg, during the hatching process of them, the temperature difference between the part of the shell enclosing the air-cell and the other part of the shell may cause a temperature difference, which can be observed by thermal infrared imaging technology. A thermal-image based monitoring method for egg air-cell change was designed. The algorithm for monitoring the thermal-image of the egg air-cell mainly includes three parts: egg target detection and segment, egg air-cell’s size of segment and egg air-cell’s area calculation. The target detection of the eggs is implemented by the fast-RCNN algorithm. The size of the egg air-cell is implemented by BP neural network. The egg air-cell area is calculated based on the segmented egg thermal-image segment. In this paper, eggs had hatched for 5 days or more were used as research objects, and thermal-images of them were taken for testing. The test results show that the mean average precision(mAP) of the target detection of the thermal-image for the egg is 99.85%, which has a good detection effect. Under optimizing of the BP neural network’s hyperparameters, the result shows that the best structure of layers is 1000-1000-1000, the best initial learning rate is 0.000 1, and the best max-iteration is 500. Using F1-measure as the evaluation index of the segment effect compare with the Otsu algorithm, the BP neural network’s result is much better than the Otsu algorithm. The Otsu algorithm’s segment evaluation is 65.25%, and the BP neural network’s result is 87.02%. In the case of only one egg, the segment result of the BP neural network is 87.17%, and the result of the Otsu algorithm is 68.86%. The segment result of BP neural network is 86.94%, and the result of the Otsu algorithm is 61.64% under the interference of other eggs. BP neural network has a stronger anti-interference ability. At the end of the experiment, the air-cell changes of fertilized eggs from 5 to 19 days were extracted, and the hatching of the eggs was monitored by observing the curve of the egg chamber area. The curve shows that the air-cell tends to become larger with the days increasing. The comparison between the artificial measurement method and the thermal-image measurement method shows that the correlation between the two is 0.934 3, which has a good correlation. The thermal-image of egg air-cell change monitoring algorithm can realize individual identification of egg and rapid monitoring of gas chamber size in actual production, which is of great significance for health monitoring during egg hatching.
Feb. 01, 2021Vol. 41 Issue 2 572 (2021)
Xiang GAO, Yu-ting QI, Bin DONG, Yu-huan CUI, Shuang HAO, Fang ZHAO, and Hong-chang WANG
Shengjin Lake wetland in Anhui Provinceis a typical lake wetland which located in the middle and lower reaches of the Yangtze River in China. It is an ideal wintering place for wintering migratory birds, especially rare cranes. The construction of water conservancy facilities has changed the natural connection of Shengjin Lake, and the lake water level has been affected by changes. Human-made control, which in turn causes changes in the landscape pattern, affects the habitat of over wintering migratory birds. In order to explore the influence of water level fluctuations on overwintering migratory birds, in this paper land use types in Shengjin Lake were classified based on Landsat-8 (OLI) multispectral remotesensing images, water level data were combined and migratory bird population characteristics data were selected, the landscape patch spectral feature index was ranked, the water level change law of the Shengjin Lake wetland in different hydrological periods was analyzed, the spatiotemporal change characteristics of wetland landscape patch spectral characteristics were explored, the natural wetland landscape pattern and the habitat change pattern of overwintering migratory birds were explored. The results showed that spatially the large patches areas were dominant in the wet season, and the medium patches areas have reached the peak in the dry season. The landscape patterns were well distributed in the ebb and dry season. The overall landscape showed that the large patches areaswere dominant, small and complex; the small patches distribution were scattered, huge and regular; and the small and medium patches areas were uniform and different. In terms of time, the landscape patterns were changed with the water level, the total numbers of patches were increased firstly and then decreased with the rising of water level, while the numbers of small patches were changed mostly and their stability was poor, which were easily affected by the fluctuation of water level. The shape indexes of large patches were influenced greatly by the water level, which the shape index of large patches was tended to be complicated when the water level raised. The shape indexes of large patches werethe largest in the flood period, and were tended to be long and narrow. The effects of landscape edge were tended to be obvious, and the heterogeneity of internal structure was decreased; the fragrance diversity index in the four hydrological periods were 1.754 2 (Flood Period), 1.571 7 (Wet Period), 1.762 3 (Ebb Period), and 1.790 1 (Dry Period) respectively. The indexes of fragrance diversity were decreased, and the diversity of landscape types were tended to be single. Winter migratory birds habitat areas were negative correlation with the water level, the areas of three types including grass land, mudflats and reed shoal were tradeoffs and long-term equilibrium. The grass land areas were accounted for the highest in the habitat area which played a leading role (68.01%), the overall habitat areaswere peaked in the late migratory birds wintering (in the dry season), which were benefited by wintering birds for foraging behavior activities. Based on this conclusion, it is suggested that artificially regulating the water level of Shengjin lake by controlling sluice during the dry season of over wintering (August to January of the following year) could increase the area of each habitat type and provide excellent habitat for over wintering migratory birds.
Feb. 01, 2021Vol. 41 Issue 2 579 (2021)
Zhi-wei SUN, Xiao-lin WANG, Qi-ming ZHANG, Ju-min YUAN, Shuang ZHANG, Hui-feng YAN, and Shu-sheng WANG
The feasibility of non-destructive assessment and prediction of tobacco nitrogen nutrition based on visible spectrum diagnostic technology on UAV platform was analyzed by field experiments with different nitrogen dosage, and the optimum color parameters and model of the technology were defined. Field experiments were carried out in Anfu, Jiangxi Province in 2018. Different nitrogen dosages were set at 0, 45, 90, 135, 180 and 300 kg N·ha-1. At 47 days after transplantation (cluster stage), 83 days after transplantation (flourishing late stage) and 116 days after transplantation (mature stage of lower leaves), digital images of canopy RGB color were obtained by UAV. At the same time, plant samples were collected to analyze aboveground biomass and leaf biomass. Digital analysis of canopy images was carried out to obtain the value of color indices. Through correlation analysis between color indices and tobacco nitrogen nutrition indices, appropriate color indices were screened and nitrogen nutrition diagnosis equation was established. The fitting accuracy of the diagnostic equation of nitrogen nutrition was validated by the experiment of nitrogen consumption in different plots. The results showed that the standard color values of canopy images were significantly different between different treatments in the later stage of flourishing growth, and there was no significant difference between the clustering stage and the maturity stage of lower leaves. Among the 15 color indexes, NRI, NGI, G/R, G/(R+B), (G-R)/(R+G+B) and ExG were significantly correlated with nitrogen nutrition indexes of 5 flue-cured tobacco varieties (pY=21.785e1.350 2G/R, Y=4.057 9e1.937 3G/R, Y=5.039 9G/R-3.333 2, Y=4.281 4G/R-3.802 9, Y=40.168G/R-28.188. Therefore, the UVAs platform-based visible spectrum diagnosis technology has application potential in the nitrogen nutrition diagnosis of flue-cured tobacco. The best evaluation period is the flourishing later stage, and the best prediction parameter is G/R value.
Feb. 01, 2021Vol. 41 Issue 2 586 (2021)
Cheng WANG, Hang YU, Wei-rong YAO, Yu-liang CHENG, Ya-hui GUO, He QIAN, Zhi-qiang TAN, and Yun-fei XIE
Diclofenac sodium is a non-steroidal anti-inflammatory drug with good anti-inflammation effect. The addition of diclofenac sodium is prohibited from being added to the dietary as supplements for reducing the inflammation. At present, some literature has reported that diclofenac sodium in water, meat, milk and other Chinese drugs can be quantified by using high performance liquid chromatography, surface enhanced Raman and electrochemical methods; however, all the mentioned techniques normally require a relatively complex pretreatment process, complicated operation steps and time-consuming. It is necessary to develop a rapid and nondestructive method for determing diclofenac sodium in dietary supplements. This article developeda near-infrared hyperspectral imaging techniqueat 1 000~2 524 nm combined with chemometrics analysis method for determing diclofenac sodium concentration in the dietary supplements. In this study, eight spectral pretreatment methods were established by using partial least squares regression (PLSR) and principal component regression models (PCR) based on the full spectral wavelength. Furthermore, β coefficients were used to select the optimal bands in order to improve the accuracy and stability of the model. The multiple linear regression model (MLR) of diclofenac sodium was established at 1 130~1 147, 1 412~1 468, 1 658~1 709, 2 010~2 055, 2 122~2 178, 2 395~2 423 nm as the independent variable. Subsequently, the three models were compared, and results showed that multiple linear regression model established by standard normal variables pretreatment method had the best forecasting ability. The minimum predictive value of the model accuracy was 0.05%; the Pearson coefficient R2 of the predicted values was 0.992 5; the root means square error of prediction was 0.004 9, and the standard deviation of prediction was 0.004 9. Therefore, the study has developed the near-infrared hyperspectral imaging technique for rapid determination of diclofenac sodium as an anti-inflammatory drug inthe dietary supplements provides a theoretical basis. It is expected to further developed and extended to the rapid quantitative application of other prohibited added drugs.
Feb. 01, 2021Vol. 41 Issue 2 592 (2021)
Peng ZHAO, Jin-cheng HAN, and Cheng-kun WANG
To improve the accuracy of wood species classification, a method is proposed based on I-BGLAM (Improved-Basic Gray Level Aura Matrix) texture features and spectral features fusion in this paper. Experimental data are hyper-spectral images in the visible and near-infrared spectral band (i. e., 372.53~1 038.57 nm) obtained by SOC710VP hyper-spectral imaging system. Firstly, the feature band selection method based on OIF (Optimum Index Factor) was used to reduce the dimension of hyper-spectral images and select the band containing a large amount of information. Secondly, NSCT (Nonsubsampled Contourlet Transform) and inverse transformation of NSCT were used to obtain the fusion image for the selected band images, and I-BGLAM was used to extract its texture features for the obtained fusion image. At the same time, the average spectrum of the whole band of hyper-spectral image was obtained, and the spectral characteristics were obtained by S-G (Savitzky-Golay) smoothing. Finally, the obtained texture features and spectral features were fused and sent to ELM (Extreme Learning Machine) for classification. In addition, the method proposed in this paper is compared with the traditional method of wood identification based on GLCM (Gray Level Co-occurrence Matrix) and the mainstreams method proposed in the field of wood species identification in recent years. There are two main innovations in this paper. One is to use the strong texture extractor I-BGLAM to extract its texture features from hyper-spectral images; the other is to propose a new feature fusion model for the classification of hyper-spectral images. The experimental results of 8 tree species show that the accuracy of using I-BGLAM to extract texture features for classification was up to 88.54%, while the accuracy of using GLCM to extract texture features was up to 76.04%. The results show that the use of I-BGLAM in this paper is better than that of GLCM in texture feature extraction, which lays a good foundation for the fusion model established later. The accuracy of classification by using the average spectral features alone can reach 92.71%. The classification accuracy of the proposed feature fusion method can reach up to 100%. This shows that it is better to use the fusion model proposed in this paper for classification than to use the classification model of a single feature. In addition, the classification accuracy obtained by using the method proposed in this paper is higher than the other two mainstream recognition methods in this field. Therefore, the method proposed in this paper based on I-BGLAM texture feature and spectral feature fusion can improve the accuracy of wood species classification, which has certain utilization value in the classification of wood species.
Feb. 01, 2021Vol. 41 Issue 2 599 (2021)
Jie DING, Da-cheng ZHANG, Bo-wen WANG, Zhong-qi FENG, Xu-yang LIU, and Jiang-feng ZHU
Laser induced breakdown spectroscopy (LIBS) is a highly efficient and rapid elemental analysis method. It can be applied to the elemental analysis of various materials. Linear discriminant analysis (LDA) and support vector machine (SVM) are two commonly used supervised algorithms in chemometrics. These two methods both need to build the models with known sample data, and then to classify unknown sample data. In order to achieve high accuracy of recognition for organics by LIBS technology, these two algorithms were used to analyze LIBS spectra. In this experiment, a nanosecond laser with 1 064 nm wavelength was used to ablate three kinds of plant leaves (Ligustrum lucidum, Viburnum odoratissinum, bamboo) to produce plasma. The plasma spectra were acquired by an optical fiber spectrometer in the range of 220 to 432 nm. 100 spectra from each kind of plant leaves were collected. Firstly, the principal component extraction for the original spectral data of 300 samples was carried out. Then the first two principal components (PC1, PC2) were used to make the score plot. The spectra of these three kinds of plant leaves are very similarities so that they could not be identified directly. Then, 70 spectra of each kind of plant sample were set as a train set, and the other 30 spectra were used as the test set to test the classification model. The first 20 principal components extracted by the PCA were used as attribute values for modeling of LDA and SVM. For the LDA, the spectra were processed to obtain the first two discriminant function values. The larger scatter distribution intervals for different types of leaves can be acquired by plotting the discriminant function values. Then combined with the Mahalanobis distance, the average classification accuracy of the test set was up to 96.67%. Similarly, the SVM method was used to learn the characters of the train set to obtain the classification hyperplane. The average classification accuracy rate of SVM for the test set was up to 98.89%, which is better than LDA. This work can be helpful to food traceability, in situ identification of biological tissues and remote analysis of organic explosives by LIBS technology.
Feb. 01, 2021Vol. 41 Issue 2 606 (2021)
Sequential Injection-Continuous Spectroscopy Based Multi-Parameter Method for Water Quality Analysis
Wen LI, Li-min WANG, Li CHENG, and Hai-qi CHEN
Aiming at the low power consumption, miniaturization, integration and intelligence of water quality multi-parameter monitoring instruments, a micro-in-situ water quality multi-parameter detector based on the fusion of sequential injection analysis (SIA) and continuous spectral detection methods has been developed. The core of the system design lies in the structure design of the digestion cell and the digestion cell as the detection cell, and the principle design of the microinjection technology sequential injection platform and the design of the multi-parameter combined digestion measurement process. A multi-parameter sequential injection analysis and detection process based on the national standard for water quality testing was designed. Fusion sequential injection analysis technology was used to detect the content of nitrite nitrogen, nitrate nitrogen, total nitrogen and total phosphorus under the conditions of continuous spectrum scanning measurement. Before digestion, the nitrate nitrogen and nitrite nitrogen were measured by direct spectrum. After digestion, the total nitrogen is detected by spectrum, and after color reaction, the total phosphorus is detected by spectrum. In this system, the in-situ water quality parameters of nitrite nitrogen, nitrate nitrogen, total phosphorus and total nitrogen are used as measurement objects. Based on the continuous spectrum analysis and the least square method, the regression model is established and the concentration absorbance standard working curve of each parameter is drawn, and its goodness of fit (determining coefficient) is ≥0.989 9. Prepare the mixture solution with a known content of nitrite nitrogen, nitrate nitrogen, total nitrogen and total phosphorus. According to the above multi parameter detection process, use the standard working curve drawn by the system to measure four parameters. The experimental results show that the repeatability of experimental parameters (RSD≤3.86%), the system can stably and efficiently analyze the content of nitrite nitrogen, nitrate nitrogen, total nitrogen, and total phosphorus in different water samples. Based on the SIA continuous spectrum fusion method to study the in-situ water quality multi-parameter detection method, it plays an important role in improving the technical performance of on-line water quality monitoring instrument. Technical performance has an important role. The development of a miniature multi-parameter water quality monitor has a good prospect for parameter expansion and is suitable for a variety of water quality online monitoring platforms.
Feb. 01, 2021Vol. 41 Issue 2 612 (2021)
Tan-ping LI, and Ai-yang LI
Based on inductively coupled plasma tandem mass spectrometry (ICP-MS/MS), an analytical method for the accurate determination of ultra-trace metal impurity elements in propylene glycol methyl ether (PGME) was established, and mixed reaction gas was used to eliminate the spectral interference. The challenging ultra-trace metal elements including Na, Mg, Al, Ti, V, Cr, Fe, Ni, Cu, and Zn in diluted PGME were determined directly by ICP-MS/MS. In the MS/MS mode, the mixed gas NH3/He/H2 was selected as the reaction gas. Ti+, Cr+, Fe+, Ni+, Cu+, Zn+ and NH3 undergo mass shift reactions. Among the large number of cluster ions formed, Ti(NH3)6+, Cr(NH3)2+, Fe(NH3)2+, Co(NH3)2+, Ni(NH3)3+, Cu(NH3)2+, Zn(NH3)+ have high abundances and interference-free, Ti+, Cr+, Fe+, Ni+, Cu+, Zn+ can be transferred to the corresponding cluster ions for determination by NH3 mass shift method. H2 can react with the adducts —NH and —NH2 to form —NH3. Increasing the concentration of —NH3 in the collision/reaction cell (CRC) will help to improve the analytical sensitivity of Ti, Cr, Fe, Ni, Cu, Zn. Mg+, Al+, K+, V+ can hardly react with NH3, and the interference ions can react with NH3 to form cluster ions. The NH3 on-mass method can be used to determine the contents of Mg, Al, K, and V. Argide ions react with H2 at a relatively fast rate, while nearly all elemental ions exhibit low reactivity with H2. Therefore, the addition of H2 to the reaction gas can quickly and completely eliminate the spectral interference caused by Argide ions, which is beneficial to the determination of Mg, Al, K, and V. The cluster ions Sc(NH3)5+ generated by the reaction between Sc+ and NH3 were selected as the standard internal ions of Ti(NH3)6+, Cr(NH3)2+, Fe(NH3)2+, Ni(NH3)3+, Cu(NH3)2+, and Zn(NH3)+. The cluster ions Be(NH3)4+ generated by the reaction between Be+ and NH3 were selected as the standard internal ions of Mg+, Al+, K+, and V+. The matrix effect caused by the difference of physical and chemical properties between sample solution, standard solution and the blank solution was corrected to ensure the stability of the analytical signal. The developed method was applied to the spike recovery experiment of real samples, and the accuracy was evaluated by comparing and analyzing with sector field inductively coupled plasma mass spectrometry (SF-ICP-MS). The results show that the limit of detection is 0.52~61.5 ng·L-1, the spiked recovery is 95.6%~104.2%, and the relative standard deviation (RSD) is ≤4.5%. At the 95% confidence level, there is no significant difference between the analysis results of analytes and that of SF-ICP-MS, which verifies the accuracy and precision of this analysis method. The method shows great potential for determining the ultra-trace metal impurity elements in PGME, and has the advantages of rapid, interference-free and high sensitivity.
Feb. 01, 2021Vol. 41 Issue 2 618 (2021)
Chen-yang LI, Xiong-fei CHEN, Yong ZHANG, Ya-wen WANG, Zhong-chao TIAN, Shi-gong WANG, Zhen-yang ZHAO, Ying LIU, and Peng-yu LIU
As an important metal material, aluminum alloy is widely used in various fields, but a large amount of aluminum alloy waste is difficult to sort and recycle. The recycling of aluminum alloy resources is a booster for China’s industrial green and sustainable development. How to quickly and easily identify and classify aluminum alloy waste has become a prerequisite for re-utilization. Laser-induced breakdown spectroscopy (LIBS) is an analytical technique that has developed rapidly in recent years. It has the advantages of fast, full-element analysis, real-time, in-situ, and long-distance detection. It has been widely used in plastics, soil, meat, steel, etc. For recognition research, most of them use the PLS-DA, SIMCA, ANN, SVM, Random Forest and other algorithms to build models. XGBoost algorithm has the advantages of regularization, parallel processing, built-in cross-validation, and high algorithm flexibility. Its model structure is relatively simple; it has a small amount of calculation and superior accuracy. It has become extremely popular in machine learning in recent years. Based on 600 sets of spectral data of six aluminum alloy samples, model extracts spectral features through machine learning to determine the classification. The processed spectral data is randomly divided into a training set, and a test set, and the XGBoost algorithm based on Decision Tree is used for automatic classification and sorting An algorithm model is constructed through the training set and its classification features are extracted; the test set is used to check the stability and usability of the model to qrevent over-fitting. The model obtained by XGBoost under fixed parameters has certain self-adaptability, is less affected by the data set, and the overall accuracy rate can reach 96.67%. Its classification characteristics are consistent with the known element content information, which proves that the characteristic spectral line data based on big data can provide a reference for classification identification; the importance of spectral line features can be ranked according to the feature score generated by XGBoost. Experimental results show that LIBS can be used for rapid identification of different types of aluminum alloys, and provides a new technology for the classification and recovery of waste metals.
Feb. 01, 2021Vol. 41 Issue 2 624 (2021)
Qian-yi ZHAO, Chang XU, and Xian-yu LIU
To analyze spectral characteristics of dark-blue corundum from Fangshan mine, Changle, Shandong, China and Le-shuza-kone mine, Mogok, Burma comparatively, and to find out the valence state of iron and coloring mechanism of corundum from both of the mines, in this paper, we did research with the help of X-ray powder diffraction (XRD), microscopic laser RAMAN spectroscopy, microscopic Fourier infrared spectrum (FTIR), electron microprobe (EPMA), Mossbauer spectroscopy (CEMS) and other methods. The phase, spectral characteristics and composition of dark-blue corundum produced in Fangshan mine and Le-shuza-kone mine were studied. The X-ray diffraction results show that the corundum produced in the two mines is characterized by four diffraction peaks of 3.408 8/3.477 0 ? (012), 2.551 8/2.549 9 ? (104), 2.380 7/2.378 1 ? (110) and 2.085 0/2.089 4 ? (113) between 2θ angles of 25° and 45°. In addition, The corundum from Le-shuza-kone mine has a weak diffraction peak of 3.981 5 ? (110) between 2θ angles of 22° and 23°, and a weak diffraction peak of 2.314 9 ? (111) between 2θ angles of 38° and 40°, which are the characteristics of diaspore and boehmite, respectively. Raman spectral scattering peaks are mainly distributed in the two ranges of 350 to 450 and 550 to 850 cm-1. The 416 and 378 cm-1 are characteristic peaks of corundum. In the RAMAN results, the strong peaks of 415 and 377 cm-1 are displacements caused by internal structural deformation, and the Raman scattering peak at 749 cm-1 is attributed to Al—O stretching vibration. The 793, 811 cm-1 Raman peaks of corundum from Fangshan mine and the 707, 793, 1 239, 1 247 cm-1 Raman peaks of corundum from Le-shuza-kone mine can be used as the basis for distinguishing the origins. The infrared spectrum shows that the absorption peaks of 451, 603, 640, 779 and 1 088 cm-1 in the fingerprint region are common of the samples from the two mines, and in the functional group region, the absorption peaks of corundum of Le-shuza-kone mine has constitution water (—OH) peaks of 1 981, 2 110 and 3 311 cm-1, which can be distinguished from the characteristic peaks of corundum from Fangshan mine, Changle, Shandong, China. The dark-blue corundum from Le-shuza-kone mine, Mogok, Burma contains constitution water (—OH), which was involved in its formation, while the corundum from Fangshan mine, Changle, Shandong has no constitution water (—OH). According to the electron probe results and the electrovalence difference method, the iron element in the main crystal of corundum from Fangshan mine is Fe2+, and the Fe3+content of is zero. In the sample from Le-shuza-kone mine, Fe2+ accounts for 91.9% while Fe3+ accounts for 8.1% of the total amount of iron. Furthermore, the Mossbauer spectra were creatively applied in the research of Fe valence state in Fangshan-mine corundum, and the results show that the occurrence form of iron in corundum from Fangshan mine is Fe2+, and the dark-blue body color is caused by Fe2+, which is neither Fe2++Fe3+ nor Fe2++Ti4+ inter-valence charge transfer reported before.
Feb. 01, 2021Vol. 41 Issue 2 629 (2021)
Ya-lun KU, and Ming-xing YANG
“Water ripple” turquoise is a kind of natural turquoise with water ripple pattern on its appearance, which is rare in production but popular among consumers. Previous studies on turquoise are rich, but less on “water ripple”. In this paper, a turquoise sample with the light blue-white substrate and blue-green “water ripple” stripe was tested by micro laser Raman spectrometer, micro infrared spectrometer, micro X-ray diffraction, laser ablation system inductively coupled plasma mass spectrometer (LA-ICP-MS), scanning electron microscope and micro ultraviolet-visible near-infrared spectrometer. The results show that the main minerals in the stripe and non-stripeboth are turquoise, and show the infrared spectra and Raman spectra of turquoise; The chemical composition of the stripe is different from that of the non-stripe. The content of Al2O3, SiO2, MgO, V, Co, Ni, U, Y, Mo and Cd in the stripe is higher than that of non-stripe, while the content of P2O5, CuO, K2O and Na2O in non-stripe is higher than that of the stripe; The results of SEM microtopography show that most of the crystals in the stripe area are thick plate, large crystal particles, closely arrangement and almost invisible pores, while the crystals in the non-stripe area are mostly columnar with different sizes, fragmentary, disorderly arrangement and visible pores; The results of X-ray diffraction show that the crystallinity in the stripe is higher than that in the non-stripe; The results of micro UV-vis-NIR show that the absorption peaks are at 426 and 660 nm, and the chromogenic ions are Fe3+ and Cu2+. The spectral characteristics of “water ripples” turquoise sample show that the color difference between the stripes and the non-stripes is not related to the chromogenic ions, while the color and transparency difference is mainly related to the crystallinity and density of turquoise. The change of the crystallinity in “water ripple” turquoise indicates the instability of the formation environment of turquoise, and the periodic change of crystallinity indicates that the surrounding environment of turquoise formation has the regularity. It provides data support for the study of color origin and the metallogenic environment of turquoise.
Feb. 01, 2021Vol. 41 Issue 2 636 (2021)
Jin-yu ZHENG, Yun-gui LIU, Tao CHEN, Qian CHEN, Meng-yang LI, and [in Chinese]
Recently, a new species of serpentine, which color is blue, named “Tian Qing Dong” appeared in jade market. Structure characteristics, chemical and mineral compositions have been investigated with a polarizing microscope, Scanning Electron Microscope, Laser Ablation Inductively Coupled Plasma Mass Spectrometry and X-ray powder diffraction spectrometer. Based on these measurements, spectroscopic characteristics are studied by using Fourier Transform Infrared Spectrometer, Raman spectrometer and Ultraviolet-Visible spectrometer. Results show that serpentine is scaly and interlocked into the felt structure. Besides, serpentine contains impurity mineral that is rhombohedron dolomite. Meanwhile, XRD results show characteristics diffraction peaks that are 2.53 ?(d202), 1.56 ?(d062), 1.54 ?(d060) and FTIR spectrum present characteristics absorb peaks which are 3 673, 997, 641 cm-1, they are confirmed that antigorite is the main mineral. There are 1 098 and 1 086 cm-1 of characteristics Raman shift exist which are belong to dolomite and calcite, these clues have indicated blue serpentine may be formed after the metasomatism which happened between dolomite and hydrothermal solution which contains SiO2. Chemical analysis shows that the concentration of Fe of blue serpentine is far lower than familiar species. UV-Vis results show that Fe2+→Fe3+ intervalence charge transfer (IVCT) transition generates a strong and broad absorption band which center is about 630 nm induce blue color, while Fe2+→Fe3+ IVCT transition also generate a weak absorption band which is 724 nm present green color. The spin-forbidden transition of Fe2+ and Fe3+ have generated 537 and 488 nm, and both are weak absorption that has not to contribute to present color.
Feb. 01, 2021Vol. 41 Issue 2 643 (2021)
S. Refat Moamen, M. Alsuhaibani Amnah, and Nagaty Mohamed
The prickly pear fruit helps in combating viral based infections. It is used to treat diabetes and declared to possess hypoglycemic effects. There is also record of the usage of the fruit in the olden days as a remedy for diabetes, lipid disorders, inflammation, ulcers, and pharmacologic side effects. The chemical composition and nutritional values of skin, flesh and seed of prickly pear fruit were investigated and discussed on a dry weight situation. The infrared spectra as well as scanning electron microscopy (SEM) techniques were used to identify the functional groups of carbohydrates, amino acids, and protein. The infrared spectral data of all three (skin, flesh, and seeds) species were recorded and assigned to the presence of distinguish peaks that referred to the three different sugars (glucose, fructose and saccharose) and cyclic aliphatic hydrocarbons moieties. On the other hand, the SEM is a powerful tool to investigate the morphological features of the components. SEM assays were examined on the surfaces of skin, flesh and seed branches showing a small particle that tends to form clusters with different shapes compared to each other. The Energy-dispersive X-ray spectroscopy (EDX) is an analytical technique used for the elemental analysis or chemical characterization of a sample. The EDX spectral technique of the skin, flesh and seeds were confirmed the presence of different essential and useful elements such as carbon, oxygen, magnesium, calcium, potassium, sulfur, aluminum, silicon, chloride, and phosphorus.
Feb. 01, 2021Vol. 41 Issue 2 648 (2021)
D V Petrov, and E A Zhuzhulina
Solid particles in Earth’s atmosphere, such as polystyrene beads, are an important factor affecting the processes of absorption and scattering of light in the atmosphere. These processes affect on the solar energy transfer in the Earth’s atmosphere, consequently they have influence on the regional and global climate changes and atmospheric visibility. In particular, great interest to study the scattering properties of small particles compared with wavelength, because of such particles experience low gravitational settlement and may have long time of life in the atmosphere. When scattering particle is much smaller than the wavelength of the scattered or absorbed light, this is the case of Rayleigh scattering. Scattering properties of these particles (such as intensity and the degree of linear polarization) at the Rayleigh scattering are simply derived from electromagnetic Maxwell’s equations. But when the particles are large enough to be comparable with the wavelength, the deviations from Rayleigh scattering law are observed. One of the clear manifestations of such deviations is the recently discovered quasi-Rayleigh polarization leap of monodisperse spherical particles. This quasi-Rayleigh polarization leap allows remote sensing of the sizes of distant particles, based on the spectral position of quasi-Rayleigh polarization leap at different phase angles of observation. In this paper, we studied the effect of the non-sphericity of a scattering polystyrene particle on the magnitude and position of the quasi-Rayleigh polarization leap. It is established that the non-sphericity shifts the position of the quasi-Rayleigh polarization leap shorter wavelengths. It is shown that for non-sphericity of particles makes the quasi-Rayleigh polarization leap becomes less pronounced. Moreover, it was found, that increasing of the phase angle and degree of non-sphericity shift the quasi-Rayleigh polarization leap position to shorter wavelength. However, in the case of not very elongated particles, the quasi-Rayleigh polarization leap is quite well manifested. Therefore, this method is suitable for remote sensing not only the size, but also the degree of non-sphericity of the scattering particles. A simple formula has been obtained for polystyrene beads that relates the degree of non-sphericity of a particle with the wavelength and phase angles at which the quasi-Rayleigh polarization leap is observed.
Feb. 01, 2021Vol. 41 Issue 2 654 (2021)
Y. Al-Humaidi Jehan, A. Al-Saif Foziah, N. Binjawhar Dalal, A. Bakhsh Hanan, and S. Refat Moamen
Te(Ⅳ), Se(Ⅳ), V(Ⅲ), Nb(Ⅴ) and Ta(Ⅴ) complexes of indole-3-acetic acid (IAAH) ligand were synthesized, characterized by elemental analysis and various spectroscopic techniques like, IR, 1H-NMR, X-ray powder diffraction, UV-Visible, thermogravimetry analysis, magnetic measurements, molar conductance and surface morphology using SEM. All the synthesized complexes of IAAH ligand have 1∶2 stoichiometry of the types [Te(IAA)2(NH3)2]·2Cl (Ⅰ), [Se(IAA)2(NH3)2]·2Cl (Ⅱ), [V(IAA)2(NH3)(Cl)] (Ⅲ), [Nb(IAA)2(Cl)3] (Ⅳ), and [Ta(IAA)2(Cl)3] (Ⅴ). Spectral analysis indicates octahedral geometry for the Te(Ⅳ), Se(Ⅳ) and V(Ⅲ) complexes, whereas both Nb(Ⅴ) and Ta(Ⅴ) have a seven-coordination. The bonding sites are the oxygen atoms of carboxylate group for the deprotonated indole-3-acetic acid (IAA) ligand. The thermogravimetry analysis studies gave evidence for the presence of other coordinated molecules (Cl or NH3) in the composition of IAA complexes, which were further supported by IR and micro analytical measurements. The higher molar conductance data of tellurium and selenium (Ⅳ) complexes reveal that these chelates are electrolytes, while low conductivity values for the vanadium(Ⅲ), niobium and tantalum(Ⅴ) chelates indicated a non-electrolytes. To test the antibacterial property of the five complexes in this study, four bacterial strains Klebsiella (G-), Escherichia coli (G-), Staphylococcus aureus (G+) and Staphylococcus epidermidis (G+) were used in the investigation. The effects of the five complexes in the cytotoxicity of Caco-2 and Mcf-7 human cancer cell lines were studied Neutral red uptake assay for the estimation of cell viability/cytotoxicity protocol.
Feb. 01, 2021Vol. 41 Issue 2 658 (2021)
© Copyright 2018-2021 | Chinese Laser Press.
All Rights Reserved 沪ICP备15018463号-20