


 View fulltext
Zhi-gao ZHU, Ya LIU, Jie YANG, and Guo-qing HU
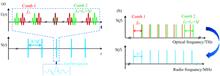
Optical frequency comb is widely used in high precision measurement and metrology because of its characteristics such as constant frequency interval, wavelength stability, narrow spectral line width and wide spectral band width. Among them, the fast dual-comb measurement, including spectroscopy, absolute ranging, 3D imaging and ultra fast asynchronous optical sampling, has become one of the research hotspots. The dual-comb spectroscopy system based on free-running single-cavity dual-comb laser has attracted much attention due to its advantages of simple structure, large measurement range and high accuracy. This article first introduces the features of the optical frequency comb in the time domain and frequency domain andits application, especially the advantages of the dual-comb measurement. Compared with the current mainstream dual-comb source schemes, such as frequency-stabilized and phase-locked mode-locked laser, electro-optic modulation and so on, the single-cavity dual-comb laser scheme is expected to avoid the use of complex electronic control system and simplify the structure and decrease the volume and the cost of the dual-comb source. Therefore, this paper mainly introduces single-cavity dual-comb fiber laser technology with wavelength-multiplexing, polarization-multiplexing, space-multiplexing and pulse-shape-multiplexing, and analyzes the basic principles, performance parameters and current research progress, as well as the existing problems in the current development of these technologies. Moreover, the researches and performances of polarization-maintaining fiber dual-comb lasers with higher stability are summarized. Then, this paper introduces the principle of dual-comb spectroscopy, reviews the current spectral extension technology, and introduces some application cases of dual-comb spectroscopy based on the free-running single-cavity dual-comb laser in detail, including the near infrared band of the erbium-doped fiber laser and the detection extended to mid-infrared and terahertz bands. Finally, we summarize the development trends of single-cavity dual-comb lasers, including further improving frequency stability of single-cavity dual-comb lasers, decreasing the common-mode noise of single-cavity lasers, exploring the application of single-cavity dual-comb system in mid-infrared and terahertz band, and making single-cavity dual-comb mode-locked fiber laser to be practical.
Nov. 01, 2021Vol. 41 Issue 11 3321 (2021)
Yan-kun LI, Ru-nan DONG, Jin ZHANG, Ke-nan HUANG, and Zhi-yi MAO
How to extract useful information from massive or high-dimensional data is a huge challenge for current data analysis and a hot spot of current research. Variable selection technology can extract feature information variables from numerous and complex measurement data, and achieve the purpose of simplifying multivariate model and even improving the model’s prediction performance. In spectral analysis, the measurement data will inevitably contain interference and irrelevant information variables and the multicollin earity among variables, which will affect the robustness and prediction ability of the model. Therefore, the variable(wavelength) selection methods have progressed greatly in the research and application of spectral analysis. Based on the related pieces of literature and the author’s research experiences, this paper summarizes the proposals, characteristics, developments, categories, comparisons and applications in recent five yearsof methods for selecting variables not only in near-infrared spectra area but also in fields of mid-infrared spectra, Raman spectra and other spectra. The parameters as their criteria or thresholds for evaluating the importance of variables and the strategies or tracks of selecting variables are vital. Moreover, each method has its advantages and limitations. In practice, it is necessary to select the appropriate method according to the characteristics of boththe method and the object. Key contents: (1) Compared the wavelength selection, and wavelength interval selection methods; (2) Summarized the different variable selection methods based on PLS model parameters; (3) Classified and overviewed the variable selection methods according to the strategiesof searching and selection of variables. Finally, we discuss the problems of variable selection methods (such as overfitting and instability etc.) appearing in the actual system and the corresponding solutions. Meantime, there look forward to the research trend, development prospect and application direction of the variable selection methods. Among them, new criteria for evaluating the importance and new selection strategy of variables still require further research. It is expected that this paper will play a positive role in promoting the follow-up researches and applications of variable selection technology.
Nov. 01, 2021Vol. 41 Issue 11 3331 (2021)
Meng-qing QIU, Qing-shan XU, Shou-guo ZHENG, and Shi-zhuang WENG
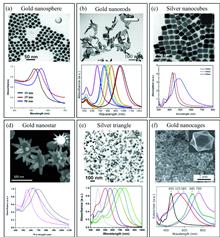
Pesticides directly pollute the environment and contaminate foods, ultimately being absorbed by the human body. Its residues are highly toxic, which have serious effects on human health. Some methods such as chromatography and gas/liquid chromatography-mass spectrometry have been widely used to detect pesticide residues. However, these methods also have some disadvantages, such as complicated pre-processing steps, time-consuming and labor-intensive. Surface-enhanced Raman spectroscopy (SERS) technology is regarded as a new pesticide residue detection method due to its high sensitivity, good specificity, comprehensive fingerprint information and no damage to the sample. It can realize trace pesticides in liquid or solid samples through simple extraction. In this review, to provide new references in the detection of pesticide residues, we mainly summarized the research progress of SERS detection technology and methods for pesticide residues from the three aspects of the preparation of SERS active substrates, detection methods, and intelligent analysis of spectra. In preparing SERS active substrates, single noble metal sol nanoparticles have poor stability and sensitivity due to random and uncontrollable “hot spots”, which can no longer satisfy trace pesticide residue detection. In order to improve the adsorption capacity of the SERS substrate more target analytes are enriched on the surface of the SERS substrate and the signal does not change significantly. The single noble metal sol nanoparticles are assembled, or its surface is modified by adding chemicals, inert materials, etc., to prepare uniform SERS composite substrate, thereby effectively and specifically capturing the analyte, ensuring good reproducibility and sensitivity of SERS signal. On this basis, in order to achieve the specificity and high sensitivity detection, the detection method of SERS for pesticide residues has gradually evolved from the use of simple nanoparticles such as gold and silver nanoparticles as an enhanced substrate to the optimization of sample pretreatment techniques, the preparation of specific SERS probes by chemical modification, breakthroughs in the physical structure of enhanced substrates, and dynamic SERS(D-SERS) detection. After obtaining the Raman spectrum of the substance, the effective Raman characteristic region is usually within a short wavenumber range, and the spectral data is as high as thousands of dimensions. There is more redundancy, which leads to an increase in the complexity of subsequent analysis. SERS spectrum intelligence analysis often uses chemometrics methods to pre-process the original spectrum, extract features and modeling, realize data dimensionality reduction and main information extraction, and then achieve qualitative and quantitative for pesticide residues. In order to obtain global features and large-scale process data, deep learning methods have also been introduced into SERS spectral intelligent analysis in recent years, which has achieved good analysis results. In summary, SERS has an excellent development prospect for rapid detection of pesticide residues and can provide new ideas for future analysis and testing field.
Nov. 01, 2021Vol. 41 Issue 11 3339 (2021)
Jian-kui GAO, Yi-jie LI, Qin-nan ZHANG, Bing-wei LIU, Jing-bo LIU, Dong-xiong LING, Run-hua LI, and Dong-shan WEI
Poly-ether-ether-ketone (PEEK) can replace traditional materials such as metals and ceramics in many fields and is widely used due to its excellent properties such as heat resistance, corrosion resistance, radiation resistance, fatigue resistance, and electrical insulation. Especially with the development and application of 5G technology, PEEK has become a popular material for 5G. Temperature is an important and key factor to affect the application of PEEK materials. This work studied the Terahertz (THz) spectroscopic characteristics of PEEK and their dependences on the temperature. It is using terahertz transmission spectroscopy, combined with a temperature control device, THz time-domain spectral signals of the PEEK flake sample were measured every 5 ℃ in the temperature range from 25 to 300 ℃ with a constant temperature increasing speed. THz absorption coefficient, dielectric constant and other optical constants of the PEEK flake can be obtained with the optical constant extraction algorithm. The temperature dependence of these THz spectroscopic parameters on the temperature was analyzed. In the effective spectral range of 0.5~4 THz, the experimental results show that at room temperature (25 ℃), PEEK has a distinct characteristic absorption peak at 3.5 THz. At the temperature range of 25~300 ℃, at 1 THz frequency, the absorption coefficient and the dielectric constant of PEEK have a fluctuation of 4.38% and 5.0%, respectively, relatively to room temperature. At room temperature, the PEEK at 1 THz has a dielectric loss tangent value of 2.5×10⁻³. Compared to PMMA, PE and other polymers, the dielectric loss tangent value of PEEK is much lower; At the temperature range of 25~300 ℃, it remains relatively stable with a small fluctuation during heating, indicating excellent thermal stability and low dielectric loss of PEEK. The results in this work show that terahertz spectroscopy can be combined with a temperature-controlled device to study and characterize the thermal stability of polymer materials through the optical constants of the materials and obtain the dielectric properties of the materials at different temperatures. Terahertz spectroscopy is fast, efficient, label-free and non-destructive, and it can be used to study the internal defects, stability, and identification of materials. Simultaneously, the test data in this work can provide a reference for PEEK material applied in 5G, 6G, and other high-frequency communications at different temperatures.
Nov. 01, 2021Vol. 41 Issue 11 3347 (2021)

Hong-mei LIN, Qiu-hong CAO, Tong-jun ZHANG, Zhao-xin LI, Hai-qing HUANG, Xue-min LI, Bin WU, Qing-jian ZHANG, Xin-min LÜ, and De-hua LI
Jade is a rare mineral that people have favored. The identification of jade authenticity has always been a thorny problem in the jewelry identification industry. Traditional identification methods are difficult to identify the nephrite and their imitations.Terahertz standoff detection technology can realize quick non-destructive testing and has a variety of applications in the classification and identification of mixtures. In this paper, Terahertz Time-domain Spectroscopy (TDS) and pattern recognition are applied to identify nephrite and imitations. The terahertz spectrum of several nephrite jade samples from Afghanistan, China’s Qinghai, Pakistan and China’s Xinjiang and imitations, like glass, marble, and raw gemstone is measured with TDS in the frequency range 0.1~1.5 THz. Due to the complexity and diversity of the sample’s chemical composition, the nephrite jade and the imitation cannot be distinguished correctly withtheir characteristic spectrum. In order to distinguish Jade with their imitations, a classification model is established.Principal Component Analysis (PCA) performs dimension reduction and feature extraction on the refractive index. The scores of the first and second principal components of the sample were obtained. It can be found that nephrite and imitations can be clearly distinguished from each other. Based on the extracted data,third quarters of them are randomly selected as the training set, the rest as the test set, a Support Vector Machine (SVM) model is established, and the parameters of the Support Vector Machine is optimized by GridSearch, genetic algorithm (GA) and particle swarm algorithm (PSO). The optimal parameters of SVM based on grid search are c=2.828 4 and g=2 while that based on GA are c=1.740 1, g=4.544 6 and based on PSO c=11.287 2, g=1.833 1. The recognition rates of the three optimization algorithms are 97.7%, 98.3% and 98.6%, and the running time is 1.39, 3.6, 6.13 s respectively. Although the optimal parameters obtained by the three optimization algorithms are different from each other, all of them can achieve a correct classification. The results show that the Terahertz spectrum combined with the pattern recognition method is a promising technique for identifying nephrite with their imitations.
Nov. 01, 2021Vol. 41 Issue 11 3352 (2021)
Yan-de LIU, Zhen XU, Jun HU, Mao-peng LI, and Hui-zhen CUI
Fritillary is widely used in clinical practice of Chinese medicinal materials, especially Fritillaria cirrhosa Don. There are adulteration and fake phenomenon, fake fritillary will have a negative impact on the health of the drug users. Terahertz Time-Domain spectroscopy has many advantages of transient, broadband, safety, penetration, etc. In recent years, Terahertz Time-Domain spectroscopy is very active in drug and food non-destructive detection. In this experiment, four common fritillaria species (Fritillaria cirrhosa Don, Fritillaria ussuriensis Maxim, Fritillaria pallidiflora Schrenk, and Fritillaria thunbergii) were taken as the research objects to explore the feasibility of using terahertz time-domain spectroscopy to identify fritillaria species. In this experiment, the TAS7500TS Terahertz spectrum system was used to collect the spectra of fritillate samples in the range of 0.6~3.0 THz, and the stoichiometric method was combined for pretreatment and classification model establishment. When the number of categories is 2, it is called Binary classification; when the number of categories exceeds 2, it is called Multiple classifications. Four kinds of fritillary were established by Partial Least Squares Discriminant Analysis (PLS-DA). Initial spectra are treated with Savitzky-Golay (S-G) smoothing, Multiplicative Scatter (MSC) Correction, Standard Normal Variable Transformations, moving averages, or Baseline. Principal Component Analysis is performed.PCA can reduce the dimensionality of the preprocessed data to reduce the amount of data computation and simplify the operation. Finally, a multi-classification model of Random Forest (RF), Support Vector Machine (SVM) and Back Propagation Neural Network (BPNN) can be established. The discriminant accuracy rate of the model was 93.333% for Fritillaria cirrhosa Don-Fritillaria pallidiflora Schrenk, 98.333% for Fritillaria cirrhosa Don-Fritillaria thunbergii, and 100% for all the other four biocalcification models. The accuracy of the other four dichotomies was 100%. By comparing and analyzing the established multi-classification models, it was found that the SVM combining SNV modeling effect is best, the Fritillaria cirrhosa Don accuracy is 95.349%, the Fritillaria pallidiflora Schrenk accuracy is 96.552%, the accuracy rate of Fritillaria ussuriensis Maxim and Fritillaria thunbergii was 100%. The overall accuracy rate was up to 97.490%. This research shows that it is feasible to use Terahertz Time-Domain spectroscopy to identify different fritillaria varieties, and a SNV-SVM multi-classification model with good classification effect is established, which provides a new means to control the quality of traditional Chinese medicine and is of great significance to maintain the normal operation of the traditional Chinese medicine market.
Nov. 01, 2021Vol. 41 Issue 11 3357 (2021)

Ting-gui JIA, Xun LI, Guo-na QU, Wei LI, Hai-fei YAO, and Ting-fang LIU
In order to study the evolution of the chemical structural characteristics of coal samples with the increase of the degree of metamorphism, the distribution of functional groups of five coal samples with different degrees of metamorphism was studied by Fourier transform infrared spectroscopy and split-peak fitting technique, and the structural parameters were calculated based on the results. The results showed that the chemical structure of the coal samples with different degrees of metamorphism differed significantly, but the overall trend of the evolution of the samples was similar as the degree of metamorphism increased, i. e., the relatively more active functional groups gradually decreased, the more stable functional groups gradually increased, and the chemical structure of the coal samples as a whole developed towards stability and order. With the deepening of coal sample metamorphism, in terms of hydroxyl functional groups, the free hydroxyl group gradually decreased. At the same time, the hydroxyl-π hydrogen bond gradually increased, and the relative content of hydroxyl self-conjugated hydrogen bond fluctuated within 40% to 55%, which was the main type of hydroxyl hydrogen bond in coal. The overall trend of hydroxyl ether-oxygen bond and ring-conjugated hydrogen bond decreased. In terms of aliphatic hydrocarbon structure, the relative content of methylene in the experimental coal samples was higher than that of methyl and hypomethyl, indicating that the lipid ring structure and lipid chain structure were more developed in coal. At the same time, the structural parameter A(CH2)/A(CH3) increased and then decreased, indicating that the fatty chains composed of methyl, methylene and hypomethyl tended to develop in the coal samples with low degree of metamorphism, and started to break in the coal samples with medium and high degree of metamorphism. The overall length of fatty chains tended to increase and then shorten, but the number of branched chains as a whole tended to decrease and then increase. The relative content of C—O in phenols tended to increase and then decrease, and the relative content of aryl ethers and alkyl ethers gradually increased and became the main oxygen-containing groups in anthracite coals. Functional groups in anthracite. In the aromatic hydrocarbon structure, the benzene ring substitution is mainly trisubstituted, and the structural parameters $f^{C}_{ar}$ and DOC gradually become larger, which indicates that the aromatic system in coal increases and the degree of aromatic structure condensation gradually increases, and the degree of aromatic structure condensation in anthracite coal is much stronger than other coal samples.
Nov. 01, 2021Vol. 41 Issue 11 3363 (2021)
Su-hui WANG, Xu ZHANG, Zhi-shen SUN, Jie YANG, Teng-xiao GUO, and Xue-quan DING
Infrared detection technology is widely used in the field of chemical engineering, bio-medicine, food safety, among the many chemical substance detection techniques due to its characteristics such as non-destructiveness, high sensitivity, fast detection speed, and good accuracy. Quantum dot (QD) spectrometer is a new type of micro spectrometer that uses QD instead of grating as a light splitting device and combines array detector with spectral reconstruction algorithm to realize spectrum detection. It has the advantages of small size and low cost. In order to improve the universality of existing QD spectrometers, QD devices for detecting chemical substances, and ultimately provide an effective technical approach for the development of micro-near infrared (NIR) spectroscopy devices. This article used hazardous chemicals Ethanol, simulants of chemical warfare agent sarin, mustard gas, including Dimethyl Methylphosphonate and Dichloromethane as the targets. A NIR colloidal quantum dot (CQD) array with an emission spectrum of 900~1 600 nm was prepared by mixing a variety of QD materials with UV curing glue and deposited on the RGB dot matrix. Extracted the high-frequency signal of the input spectrum and reduced the random noise interference with empirical mode decomposition method, established the corresponding spectrum reconstruction algorithm based on the least square method. The experimental results show that the preparation method of the NIR CQD array is simple, low-cost, and stable. The reconstructed spectral resolution achieved by the NIR CQD array with 144 spectral channels can reach 4.861nm. Compared with the standard absorption spectrum, the minimum deviation of its characteristic peak is only 0.043%. Therefore, detecting and identifying gas and liquid targets can be achieved by combing the NIR CQD arrays with spectral reconstruction algorithms. In the future, the spectral resolution of the reconstructed spectrum can be effectively improved by increasing the number of arrays; Spectral detection from UV to IR can also be achieved by increasing the QD materials selected; Target detection signal-to-noise ratio can be improved by optimizing the optical detection path and the reconstruction algorithm parameters.
Nov. 01, 2021Vol. 41 Issue 11 3370 (2021)
Xu ZHANG, Xue-bing BAI, Xue-pei WANG, Xin-wu LI, Zhi-gang LI, and Xiao-shuan ZHANG
In order to improve the stability and accuracy of near-infrared spectroscopy (NIR) detection of total volatile basic nitrogen (TVB-N) in fresh mutton during storage (at 4 ℃, 8 ℃, 20 ℃), the selection of characteristic spectra and prediction models is the key step of NIR spectroscopy research. The 121 mutton samples were taken as experimental objects, the NIR spectra between 680 and 2 600 nm of fresh mutton samples were collected. The scattering correction methods, including multi scattering correction (MSC), standard normal transformation (SNV), and smoothing methods including Savitzky Golay convolution smoothing (SGS), moving average smoothing (MAS), and scaling methods including normalization, centring and auto scaling, were adopted to pretreat NIR spectra, and then PLS prediction models were built, by comparison, it is found that the spectra treated with SGS got the best modeling effect. Monte Carlo sampling (MCS) method and Mahalanobis distance method (MD) were used to eliminate 5 abnormal data of mutton spectra. The sample-set partitioning based on joint x-y distance (SPXY) algorithm was used to split 75% (87 samples) of the total samples as calibration set samples and the remaining 29 were validation set samples. The competitive adaptive reweighted sampling (CARS) algorithm, uninformative variable elimination (UVE) algorithm, improved uninformative variable elimination (IUVE) algorithm, successive projections algorithm (SPA) were employed to select characteristic wavelengths, and wavelength numbers were 14, 703, 144 and 15, respectively. The full spectra and the characteristic wavelengths selected by the four methods were taken as input variables to build prediction models, the results show that the performance of the model built with the wavelengths selected by CARS is better than the model built with the wavelengths selected by UVE, IUVE and SPA, and it shows that CARS method can effectively simplify the input variables and improve the performance of the prediction model. Compared with the UVE algorithm, the IUVE algorithm can select fewer wavelengths and improve the model’s performance. The PLS models, support vector machine (SVM) models and least squares support vector machine (LS-SVM) models were established with the selected characteristic wavelengths. The optimal prediction results of the calibration set are obtained by SVM models, in which the calibration determination coefficient ($R_{C}^{2}$) and root mean square error of calibration (RMSEC) of the CARS-SVM prediction model were 0.939 1 and 1.426 7, respectively. LS-SVM prediction model achieves the optimal prediction results of validation set, and the validation determination coefficient ($R_{V}^{2}$) and the root mean square error of validation (RMSEV) of IUVE-LS-SVM prediction model were 0.856 8 and 1.886 2, respectively. The simplified and optimized TVB-N prediction models for fresh mutton during the storage period are established based on NIR characteristic spectra, which provides reference and technical support for rapid and non-destructive detection of TVB-N concentration in fresh mutton.
Nov. 01, 2021Vol. 41 Issue 11 3377 (2021)
Yong HAO, Jiao-jun DU, Shu-min ZHANG, and Qi-ming WANG
The quality of jujube is susceptible to factors such as the environment, causing changes in its post-harvest redness index, leading to large differences in fruit color, which affects the analysis accuracy of its soluble solids content (SSC) detection model. Visible-near infrared spectroscopy (Vis-NIRs) combined with spectral preprocessing methods including Norris-Williams smoothing (NWS), continuous wavelet derivative (CWD), multiplicative scattering correction (MSC), standard normal variate (SNV) and NWS-MSC were used to build the partial least squares (PLS), quantitative analysis models of the SSC of jujube, with different colors (red and green-MJ, green-GJ and red-RJ). Five independent sample sets, including MJ, GJ, RJ, MJ-GJ and MJ-GJ-RJ, were used to establish the quantitative analysis models of SSC for jujube, and test set samples MJ-GJ-RJ were used for model evaluation. The correlation coefficient of calibration set (Rc) and the root mean square error of cross-validation (RMSECV) were used to evaluate model accuracy. The correlation coefficients of prediction (Rp) and the root mean square error for prediction (RMSEP) were used to evaluate model prediction accuracy. The research results showed that when the independent sample sets of MJ, GJ and RJ were used for modeling, the models only achieved a better prediction for the SSC of jujube samples with the same color, respectively. When adding GJ and GJ-RJ samples to the MJ samples to construct the quantitative model of the two mixed sample sets, including MJ-GJ and MJ-GJ-RJ. The MJ-GJ model had better prediction results of SSC for MJ and GJ jujube samples, the model’s RMSECV, Rc, RMSEP, and Rp were 1.108, 0.698, 0.980, 0.724 and 1.108, 0.698, 0.983, 0.822, respectively, but the effect of RJ samples was relatively larger, the model’s RMSECV, Rc, RMSEP, Rp were 1.108, 0.698, 1.928, 0.597. The MJ-GJ-RJ model obtained good prediction results of SSC for the three colors jujube: for the SSC model of MJ, the RMSECV, Rc, RMSEP, Rp of the MJ-GJ-RJ model were 1.158, 0.796, 1.077, 0.668; for the SSC model of GJ, the model’s RMSECV, Rc, RMSEP, Rp were 1.158, 0.796, 0.881, 0.861; for the SSC model of RJ, the model’s RMSECV, Rc, RMSEP, Rp were 1.158, 0.796, 1.140, 0.841. After using the Monte Carlo uninformative variable elimination (MCUVE) method to optimize the variables of the MJ-GJ-RJ model further, the Rc and Rp were increased from 0.796 and 0.864 to 0.884 and 0.922, respectively. The RMSECV and RMSEP were reduced from 1.158 and 0.946 to 0.886 and 0.721, respectively. The model has better analysis accuracy. When the SSC of different color jujube was analyzed using near-infrared spectroscopy, similar sample set properties for calibration and prediction or modeling variables are required to construct universality models.
Nov. 01, 2021Vol. 41 Issue 11 3385 (2021)
Wei-fang ZHANG, Ke-feng FAN, Jing-wei LEI, and Liang JI
The place of origin of Chinese medicine is an important factor affecting the quality of medicinal materials. The growth environment of different places of production directly impacts the growth of Chinese medicine and the accumulation of metabolites. Chinese medicinal materials are known for the difference between authentic and non-dao regions, and they have a long history in China. The change of its production area and the increase of modern main production areas have resulted in slight discrepancies between the main production areas of current medicinal materials and historical records. Fourier transform infrared spectroscopy technology has the advantages of being fast and non-destructive. Fourier Transform Infrared spectroscopy is characterized for its high speed and non-destruction. Infrared spectroscopy can completely express the information on different origins of Rehmannia glutinosa. Combined with chemometrics, FTIS can also express the digitization of information embodied in infrared spectroscopy. It can collect different Infrared spectroscopy of Rehmannia glutinosa by using Fourier transform infrared spectrometer. The original spectral data can be preprocessed like baseline correction of the original spectrum, 6 smoothing points, selection of 900~1 200 cm-1 band for highest peak normalization and so on. Moreover, FTIS can calculate the relative peak height of the main characteristic peaks of the infrared spectrum of each origin. FTIS is trying to put up quality differences with normal distribution, clustering (CA) and principal component analysis (PCA). In addition, the identification of the origin of Rehmannia glutinosa has scientific significance for the rational application of Chinese medicine. The results showed that the infrared spectra of 73 batches of Rehmannia glutinosa from different origins were collected by Fourier transform infrared spectroscopy. The peak shape, peak position and height of the fingerprints of 73 batches of Rehmannia glutinosa from different origins were basically similar, and the same chemical components were contained in different origins. The characteristic peaks and shapes are basically the same. Rehmannia glutinosa produced in Henan has prominent heights of individual characteristic peaks, and there are certain differences in fingerprint areas. The main contribution bands for the differences are: 1 639, 1 424, 1 354 and 1 260 cm-1. Four bands, a total of 13 common peaks are calibrated. Cluster analysis can divide 73 batches of Rehmannia glutinosa samples into two types, namely Huai Rehmannia glutinosa produced in Henan and other Rehmannia glutinosa, which indicates that there are internal quality differences in different origins of Rehmannia glutinosa. The normal distribution is consistent with the cluster analysis results. It showed that at the peak of 1 639 cm-1, the normal distribution curves of Huai Rehmannia glutinosa produced in Henan and other provinces are in order as follows: Shandong, Shanxi, Hebei. Therefore, this method can distinguish authentic medicinal materials from non-authentic medicinal materials well. It can reduce the dimension of the relative peak height of the resulting common peaks. And it can calculate the principal component composite scores of different origins of Rehmannia glutinosa. The results showed that the comprehensive scores of Rehmannia glutinosa produced in Henan were higher than those of other origins, indicating that the quality of Rehmannia glutinosa produced in Henan was the best. Fourier transform infrared spectroscopy combined with multivariate statistical analysis methods can non-destructively, effectively and quickly identify different origins of Rehmannia glutinosa.
Nov. 01, 2021Vol. 41 Issue 11 3392 (2021)
Chu-biao WANG, Yan YANG, Wei-guo BAI, Yan LIN, Yao-jian XIE, Wan-hong LU, and Jian-zhong LUO
Clarifying the pedigree on Eucalyptus pellita populations is of great significance for studying rules of interspecific hybridization of eucalypt and the development of excellent new eucalypt genotypes. The purpose of the present study was to assess the accuracy and reliability of near infrared spectroscopy (NIRs) used in the analysis of the pedigree of E. pellita populations by comparing the relationship between genetic variations and NIRs differences that. The genetic materials involved natural provenances from the E. Pellita population, fresh leaves of 8~12 families were collected from each provenance. The DNA information of materials was obtained through whole-genome resequencing. Firstly, the genetic distances among provenances were evaluated with the DNA nucleotide sequence differences between samples. Meanwhile, four to six healthy leaves of each sample were placed in a drying ovenuntil completely dry. The dried leaves were milled and then put into a transparent self-sealing plastic bag. A portable NIR device, phazir RX (1 624), was used to take the NIRs information of samples. The NIRs spectral distance between validating provenance and calibrating provenance was estimated with the soft independent modeling of class analogy (SIMCA). Hierarchical clustering was performed for all provenances with NIRs Euclidean distance. PCA scores plots of provenances NIRs demonstrated the pedigree and the genetic variations of provenances. The results showed that the total mean of the genetic distance of provenances from New Guinea Island and Queensland were 0.186 and 0.157 respectively, the total mean of genetic distance between New Guinea Island and Queensland was 0.295, which was higher than that within each separate district significantly. There was a positive correlation between NIRs spectral distance and genetic distance between provenances in two separate districts, but a negative correlation was also found between some provenances of E. pellita. The correlation between genetic distance and NIRs spectral distance was also proved by the NIRs Hierarchical clustering of all provenances. However, the clustering did not completely correspond with their geographical distance of provenances, suggesting that gene flow of some forms greatly affects the genetic relationship among separate districts of E. pellita populations. The PCA score plots demonstrated that PCs plots of some provenances with large genetic distance or NIRs spectral distance would overlap seriously, and PCs plots of some provenances with close genetic distance or NIRs spectral distance would be clustered, which verified the sensitivity of NIRs in the distinguishing of heterogeneous samples, also showed the genetic variation among families inprovenance of E. pellita. All the current study results proposed that NIRs could genuinely reflect the genetic differences among provenances of E. pellita, and could be used to analyze the genetic relationship and genetic variation within eucalypt populations, and could be used to assist the improvement of eucalypts breeding populations in a generation.
Nov. 01, 2021Vol. 41 Issue 11 3399 (2021)
Kai QIN, Gang CHEN, Jian-yi ZHANG, and Xia-ping FU
Moldy core of apples is a fungal disease that affects many commercially popular cultivars of apples.It is difficult to distinguish moldy core of the fruit from its appearance until the fruit is cut open. The objective of this study was to detect moldy core of apples by visible near-infrared spectroscopy (NIRS). The discrimination effects of four kinds of apple on-line transportation postures were compared: the apple stem upward, the apple stem downward, the apple stem towards the transportation direction, and the apple stem perpendicular to the transportation direction. Principal component analysis (PCA) was used to extract the principal components from the transmission spectra of 600~900 nm, and then linear discriminant analysis (LDA), Mahalanobis distance (MD) and k-nearest neighbor (KNN) models were established for comparison. The partial least squares discriminant analysis (PLS-DA) model was established after the central pretreatment of 600~900 nm. Two machine learning algorithms, extreme learning machine (ELM) and support vector machine (SVM)were also used to predict moldy core of apples. The best modeling method is PLS-DA. The accuracy rate of stem upward and stem downward was 93.75%, and the accuracy of the other two postures were more than 85%. Then according to VIP (variable importance in projection) scores, the characteristic band 690~720 nm was extracted, and the model was rebuilt. The best result of the four postures was apple stem upward. The accuracy rate of the prediction set was 93.75%.The results showed that PLS-DA could be used as an effective method to distinguish moldy core of apples, and the stem upward can be used as an effective posture for on-line detection of moldy core of apples.
Nov. 01, 2021Vol. 41 Issue 11 3405 (2021)
Yu-hui ZHAO, Xiao-dong LIU, Lei ZHANG, and Yong-hong LIU
Near-infrared spectroscopy analysis technology has the advantages of low cost, high efficiency, and pollution-free. In recent years, it has been widely used in qualitative and quantitative analysis in various fields. Multivariate calibration technology is the most advanced technology in the field of spectroscopy. Changes in conditions, instruments, or substances may cause the multivariate calibration model to no longer be suitable for the prediction purposes of newly measured samples. Re-calibration and re-modeling will inevitably waste a lot of time and resources; another option is calibration transfer, which extends the existing calibration model in the source domain to the target domain to avoid the cost of repeated modeling. In the related chemometrics literature, most transfer methods need to measure a set of transfer standard samples under the same conditions of two instruments. However, in the near-infrared spectroscopy measurement technology, due to the characteristics of volatilization of the standard samples, It is not easy to obtain and save the standard samples for constructing the transfer method for instrument calibration. This paper proposes a joint feature subspace distribution alignment (JSDA) calibration transfer method in response to these problems. This method can establish a calibration transfer model without a standard sample from the instrument. JSDA first establishes the joint PCA subspace (Principal component analysis) of the data features of the source and target domains; then corrects the calibration model by aligning the source domain feature distribution and target domain feature distribution mapped in the joint feature subspace; Finally, the least squares model is used to build a calibration model on the corrected source domain, which can be directly used for the calibration of the target domain. The experimental results show that compared with the existing mature calibration transfer methods, JSDA has more advantages in predicting performance on public real data sets, which verifies the effectiveness and superiority of the model in practical applications.
Nov. 01, 2021Vol. 41 Issue 11 3411 (2021)
Na YAO, Zi-fan CHEN, Xiong ZHAO, and Shu-ya WEI
The ink unearthed from the Warring States tomb M56 of Jiudian village, Jiangling County in Hubei province provides important material objects for researching the early ink materials and technologies in China. However, the types of ink, additives and binding media in ancient ink are still unknown. In this paper, Infrared Spectrometer (FTIR), Transmission Electron Microscopy (TEM), and Pyrolysis-Gas Chromatography/Mass Spectrometry (Py-GC/MS) were used to analyze the morphology and chemical composition of the Warring States ink. The results show: (1) the FTIR analysis reveals that there are the vibration absorption peaks of soot C=C skeleton near 1 595 cm-1, carboxylic acid carbonyl C=O (1 716 cm-1), alcohol C—O (1 031 and 1 092 cm-1) bonds, and O—H (3 421 cm-1) in OH and COOH, which indicates that there are carboxylic acids and alcohol in the Warring States ink; (2) the TEM results show that the characteristic of Warring States ink is similar to pine wood soot ink; (3) the results of Py-GC/MS show that there are a series of polycyclic aromatic hydrocarbons (PAHs), pyrolysis compounds of pine wood (retene and methyl dehydroabietate), camphor and cedar oil-related aromatic compounds (cedr-8-ene, beta-cedrene, cuparene and cedrol). Among these, the content of PAHs and the characteristic compounds of pine wood indicates that the Warring States ink is pine wood soot ink. Besides, camphor and cedar oil are used as additives in Warring States ink. This study shows that camphor and cedar oil existed in pine wood soot ink as additives during the Warring States period in China.
Nov. 01, 2021Vol. 41 Issue 11 3418 (2021)
Yang TAN, Qi-gang JIANG, Hua-xin LIU, Bin LIU, Xin GAO, and Bo ZHANG
Soil composition is complex and varied. Predicting the contents of soil propertiesfast and efficiently is important for precision agriculture. Spectra are usually measured on dried soil samples. However, soil moisture is an important indicator for the guidance of agriculture activities. In order to predict the soil organic matter (SOM), soil moisture content (SMC), total iron (Fe) and pH value, we propose to measurement VIS-NIR spectra directly on wet samples and use Standard normal variable (SNV)-Continuous wavelet transform (CWT) method on spectra. CWT method uses Mexh as wavelet filter and 10 scales after SNV on each spectrum. Seven common methods, including Gauss filter (GS), First derivative (FD), Continuous removal (CR), and Mathematical transform (Log(1/R)) et al were used as comparisons. All of 74 samples were divided into 50 and 24, for calibrated and validation datasets. On the coefficients of each scale after SNV-CWT, wavebands that passed 0.05 significance level were selected as RF input variables. The optimal scale for each property was confirmed based on the statistical indicators of validation models. Then the Pearson correlation coefficients (PCC), Model based coefficients (MBC) and Grey relation degree (GRD) between each property and wavelet coefficients were calculated on the optimal scales. Models were estimated by the filter screening method based on the correlation coefficients calculated by the three methods. Results showed that, accuracies of all properties were improved after SNV-CWT comparing to the 7 commonly methods. The optimal transformation scales were 7, 8, 1 and 10, corresponding to SOM, SMC, Fe and pH respectively. When taking high dimension features as input variables, the Coefficient of Determination (R2) was reached to 0.90 and 0.93. The best analysis method was MBC. Because the models performed best when wavebands for the models were selected using MBC as a screening method, the R2 of SOM and SMC was 0.94 and the accuracies of Fe (R2=0.67, Mse=0.01%, RPD=1.76) and pH (R2=0.80, Mse=0.1, RPD=2.24) were greatly improved, methods can be used for extracting and monitoring multi soil properties.
Nov. 01, 2021Vol. 41 Issue 11 3424 (2021)
Jun-fan NING, Yu-bao GUO, Rui SONG, Shi-min ZHU, and Peng DONG
Rice aging during storage leads to a decline in eating quality, and protein changes are the underlying reasons. Glutelin is the main protein in rice. Raman and infrared spectroscopy were used to characterize the changes in glutelin during aging, and the differences in functional properties were compared, which was helpful to clarify the mechanism of rice aging. Raman spectroscopy showed that the normalized Raman intensities of aged rice glutelin at 1 665 and 1 218 cm-1 were 1.01 and 0.25, significantly lower than fresh rice glutelin, indicating a decreased α-helix in glutelin after rice aging. The disulfide bonds (the peak intensities at 516 and 527 cm-1 were 0.45 and 0.42 respectively), sulfoxides (the peak intensity at 1 035 cm-1 was 0.48) and sulfones (the peak intensities at 1 124, 1 152, 1 159, 1 316 and 1 334 cm-1 were 0.47, 0.22, 0.26, 0.50 and 0.63, respectively) of the aged rice glutelin were significantly higher than those of the fresh rice glutelin, indicating the obvious oxidation of sulfur-containing amino acid residues. The intensity ratio of Fermi resonance at 857/830 cm-1 of tyrosine in aged rice glutelin was 1.68, which was larger than fresh rice glutelin, indicating more exposed tyrosine residues in glutelin after aging. The Raman intensity of the tryptophan indole ring near 751 cm-1 of aged rice glutelin was 0.20, which was significantly higher than the intensity of 0.14 for the tryptophan indole ring of fresh rice glutelin, indicating more buried tryptophan residues after aging. The O—H stretching strength of the aged rice glutelin at 3 423 cm-1 was 0.05, which was significantly higher than that of the fresh rice glutelin of 0.02, indicating that the degree of intermolecular bonding was increased association between glutelin and starch strengthened. Except for the peak intensities of tyrosine Fermi resonance and sulfone at 1 333 and 1 152 cm-1 were not higher, the Raman intensities of fresh rice glutelin-aged at other peaks were higher than those of aged rice glutelin, which indicates that the oxidation degree of fresh rice glutelin-aged is high. Infrared spectroscopy showed that the absorption peaks of sulfur oxides at 1 153, 1 078 and 1 026 cm-1 in aged rice glutelin and fresh rice glutelin-aged increased, further supporting the oxidation of glutelin after aging. Compared with the functional properties of fresh rice glutelin, the solubility, water holding capacity, emulsifying properties and emulsifying stability of aged rice glutelin were significantly reduced, while oil holding capacity increased, which supported the obvious oxidation of aged rice glutelin. The solubility (except for pH 9), water holding capacity and emulsifying properties of fresh rice glutelin-aged were lower than those of aged rice glutelin, and its oil holding capacity was higher, which indicated that glutelin had a higher degree of oxidation when it was extracted from fresh rice and aged alone. The changes in the functional properties of glutelin after aging supported the oxidative changes shown by Raman and infrared spectroscopies, which provides new evidence for clarifying the roles of protein in aging deterioration of rice quality, and provides a basis for controlling the deterioration of rice aging and reducing post-harvest losses.
Nov. 01, 2021Vol. 41 Issue 11 3431 (2021)
Shuang-zan REN, Jing-wei WANG, Liang-liang GAO, Hong-mei ZHU, Hao WU, Jing LIU, Xiao-jun TANG, and Bin WANG
Aiming at the interference caused by the gas in the air gap between the gas cell and the spectrometer, as well as the baseline drift and distortion in the application of Fourier infrared spectroscopy on-line analysis of dissolved gas in transformer oil, a new method of gas absorption spectrum compensation based on time-sharing scanning with two gas cell, was proposed. Based on the traditional single-gas cell measurement, a background gas cell is added that is the same as the structure, size, and other parameters of the measurement gas cell. The background gas cell is filled with nitrogen, and the measurement gas cell is filled with the sample gas to be measured. Besides, the controller is used to realize the switching control of the background gas cell and the measurement gas cell. However, the spectrum processed by the conventional absorbance calculation formula has unknown absorption peaks in the wavenumber range of 1 100 to 1 200 cm-1. There is a severe baseline drift phenomenon, which indicates that the calculation method is no longer suitable for double gas cells. Therefore, in order to eliminate the adverse effect of the inconsistency of the parameters between the two gas cells, especially the difference in the filter characteristics of the window, a new method for calculating the gas absorption absorbance spectrum based on the double gas cell time-division scanning is further proposed, which was proved to eliminate unknown absorption peak and baseline drift, and the drift value decrease from 0.3 to 0.005. Finally, a transformer oil sample was obtained at a substation in Shaanxi, and the corresponding gas samples were obtained after degassing treatment. Conventional single-cell scanning method (group 1), two-gas cell compensation method (group 2), and gas chromatography (group 3) were used for experiments. The results show that methane concentration in group 1 is always more significant than that in group 2. At the same time, the carbon dioxide concentration in group 1 is always greater than the carbon dioxide concentration in group 2. The obvious difference in such analysis results is most likely due to the influence of the air gap between the spectrometer and the gas cell. On the whole, compared with group 1, the analysis results of group 2 are closer to those of gas chromatography. In summary, the new gas absorption spectrum compensation method based on double gas cell switching time-sharing scanning proposed in this paper can effectively solve the problem of spectral baseline drift and distortion. In gas analysis, this method can eliminate the influence of interfereing gas between the gas cell and the spectrometer, and obtain more accurate analysis results.
Nov. 01, 2021Vol. 41 Issue 11 3438 (2021)
Qiong LI, Shuai-shuai MA, Shu-feng PANG, and Yun-hong ZHANG
The hygroscopicity of aerosol particles determines their size, concentration, chemical compositions and phase states, and thus affects the global climate, heterogeneous atmospheric chemistry and human health. In this study, an on-line and in-situ rapid scan attenuated total reflection Fourier transform infrared (ATR-FTIR) technique coupled with a linear relative humidity (RH) controlling system was utilized to obtain the IR spectra of aerosols under different RH. The mass growth factors (MGFs), deliquescence relative humidity (DRH) and efflorescence relative humidity (ERH) of (NH4)2SO4, NH4NO3, and mixed (NH4)2SO4/NH4NO3 aerosols were determined rapidly by measuring the peak areas of the bending vibration band of liquid water (~1 640 cm-1). Comparisons between the measurements and the predictions from the E-AIM model showed good consistency, which verifies the rapid scan ATR-FTIR as a powerful tool for investigating hygroscopic behaviors and phase transitions of atmospheric aerosols. Furthermore, pure (NH4)2SO4 and NH4NO3 particles were found to effloresce at 49% and 25% RH, respectively, while mixed (NH4)2SO4/NH4NO3 aerosols with a mole ratio of 1∶1 and 1∶2 exhibited one-stage efflorescence transition beginning at 44% and 38% RH, respectively, upon dehydration. These results indicate that the presence of NH4NO3 can inhibit the crystallization of (NH4)2SO4, and formed (NH4)2SO4 seeds will act as heterogeneous nuclei to promote the efflorescence of NH4NO3 at higher RH. In addition, the double salt (NH4)2SO4·2NH4NO3 was formed upon efflorescence of mixed particles. These findings are critical for understanding complex phase transitions of mixed inorganic aerosols and interpretation for RH dependency of heterogeneous reaction rates of atmospheric reactive species.
Nov. 01, 2021Vol. 41 Issue 11 3444 (2021)
Yan-li LI, Yue WU, Xin-yue ZHANG, Xiang-dong KONG, Zhao-shun GAO, and Li HAN
MgB2 superconducting film, as the alloy superconductor with the highest superconducting transition temperature so far, has a broad application prospect in the field of electronics because of its simple structure, long coherent length, no weak connection between grain boundaries, high upper critical field, short electron-phonon scattering time and so on. Raman spectroscopy is an effective method to study the electron-phonon interaction and superconducting band. Moreover, Raman spectroscopy has been used to study the electron-phonon characteristics and superconducting band structure of MgB2. Research shows that sample quality, grain size and test conditions greatly influence the peak position and shape of the Raman peak of MgB2. The change of Raman spectrum with temperature is also a research priority. However, the temperature range of MgB2 variable temperature Raman spectrum is relatively small, which is limited to 83 K to room temperature or the region near the transition temperature. In this work, the Raman spectra of MgB2 film in a large temperature range are studied. The polycrystalline MgB2 film was prepared on (0001) SiC substrate via hybrid physical-chemical vapor deposition with grain size ~300 nm and superconducting transition temperature 39.3 K. The Raman spectra of MgB2, from 20 to 1 200 cm-1, were measured and studied in the temperature region from 10 to 293 K. The Raman spectra show that Raman peaks related to MgB2 appear at ~620 cm-1 in high-frequency region and at ~80 and ~110 cm-1 in low-frequency region. The frequency of the two Raman peaks in the low-frequency region corresponds to the width of the superconducting energy gap, indicating the dual-gap characteristics of MgB2. Considering the Raman activity of the four phonon modes in MgB2, the Raman peak at ~620 cm-1 in high-frequency region is contributed by the E2g vibration mode. And as temperature decreases, no obvious peak position shift is observed. Nevertheless, the FWHM of the Raman peak decreases with temperature. Furthermore, the FWHM is 380.7 cm-1 at 293 K, and 155.7 cm-1 at 10 K. Analysis shows that the non-harmonic effect caused by the nonlinear coupling between E2g phonon and electronic system may be the main reason for the linear decrease of the FWHM.
Nov. 01, 2021Vol. 41 Issue 11 3451 (2021)
Fan YU, He-ping LI, Tian-yu ZHAO, Zhuo-wen LIANG, Hang ZHAO, and Shuang WANG
Spatially offset Raman spectroscopy (SORS) can accurately, fast, and non-destructively obtain the characteristic spectral information from multi-layer turbid media samples. In this work, we developed and introduced a modular inverse SORS device realizing two different spectral detection modes of inverses SORS and conventional backscattering Raman spectroscopy. The deep-layer Raman spectral information from the two/ three-layer tissue model was detected and analyzed with different spatial offset value (Δs). Meanwhile, by the geometrical optics theory and the principle of projection measurement, the quantitative relationship between Δs and the axicon lens position is addressed, which supports precise controlling of the spectral detection conditions. In order to verify the system performance, a two-layer model composed of sheep scapula/paracetamol and a three-layer model composed of pig skin/silicone rubber/paracetamol were used to obtain the mixed spectra containing the constitution information of samples surface and deep layers under different spatial offsets. By performing area-under-curve normalization on the mixed spectra, it was observed that the Raman contribution of the sample surface decreases with the increase Δs value, while the Raman contribution of the second or third layers gradually increases. Moreover, for better understanding the dependence of the relative Raman intensity on the spatial offset and thickness, the relative Raman intensity is calculated by selecting the characteristic peaks of each layer in the model. The relative Raman intensity ratio increases with the increase of Δs, which exhibits an enhanced pattern of the Raman intensity. However, with the same spatial offset condition, the relative Raman intensity induces as the thickness of the first layer increases. The above experimental results testified that our developed modular inverse SORS device could obtain spectral information from a biological model with a depth of 8 mm, and manifest the application potentialities of our inverse SORS system in transcutaneous non-destructive detection.
Nov. 01, 2021Vol. 41 Issue 11 3456 (2021)
Detection of Chlorpyrifos Based on Surface-Enhanced Raman Spectroscopy and Density Functional Theory
Ai-ling TAN, Rong ZHAO, Jia-lin SUN, Xin-rui WANG, and Yong ZHAO
Chlorpyrifos, a broad-spectrum and highly effective organophosphorus pesticide, is widely used in agriculture and other fields. However, environmental toxicology studies have found that chlorpyrifos can be directly applied to the soil, firmly binds to soil particles, hardly migrate or volatilize, and has low water solubility, which is likely to cause drug residues, thus affects the safety of agricultural and sideline products. Many countries have strict regulations on the residual amount of chlorpyrifos in agricultural products. Therefore, detecting the ecological risk of chlorpyrifos residues is a top priority. Surface-enhanced Raman spectroscopy has the advantages of fast, high efficiency and high sensitivity, and has become a hot technology in the spectroscopy research field. Density functional theory is widely used in theoretical simulation calculations and spectral analysis of molecular structure and properties. This paper, based on the surface-enhanced Raman spectroscopy technology and density functional theory, the theoretical study of chlorpyrifos Raman and surface-enhanced Raman spectroscopy is carried out. First, GaussView5.0 was used to configure the insecticide chlorpyrifos molecule and the molecular structure added to the silver cluster base. Second, the 6-31G basis set was used for the chlorpyrifos molecule, and the structure was optimized based on density functional theory, and then the Raman and surface-enhanced Raman spectra were calculated by Gaussian09 simulation. The Raman spectrum peak attributions were determined. Finally, the enhancement effect of silver clusters Ag2 and Ag3 on the Raman spectrum of chlorpyrifos was analysed from the frequency shift perspective, and the frequency shift was compared. The study found that the peak intensity of Raman spectrum at 326, 463, 741, 781, 1 068, 1 294, 1 435, and 1 602 cm-1 wavenumber has a significant increase with the action of the silver clusters, and with the increase of the size of the silver cluster structure, the enhancement was more effective. Besides, the position of some characteristic peaks shifted and the frequency shift was related to the structure of silver cluster Correlatively. Raman spectrum of 463, 741 to 781 cm-1 wavenumber produced a large frequency shift and the frequency shifts at other characteristic peak wavenumbers were all smaller than 20 cm-1. The frequency shifts of the surface enhanced spectra of Ag2 invasion with the chlorpyrifos molecule were in agreement with the shifts of Ag3 invasion with the chlorpyrifos molecule. The results of this article provide a theoretical basis for applying surface-enhanced Raman spectroscopy for pesticide residue detection.
Nov. 01, 2021Vol. 41 Issue 11 3462 (2021)
Zhen RUAN, Peng-fei ZHU, Lei ZHANG, Rong-ze CHEN, Xun-rong LI, Xiao-ting FU, Zheng-gu HUANG, Gang ZHOU, Yue-tong JI, and Pu LIAO
Non-tuberculosis mycobacteria (NTM) are the collection of mycobacteria other than Mycobacterium tuberculosis complex (MTC) and Mycobacterium leprosy. The clinical symptoms of NTM are very similar to MTC infection, yet their treatments are different, thus rapid and accurate identification methods of NTM are urgently needed. Single-cell Raman Spectroscopy (SCRS) is label-free, and independent of cultivation, thus it is deemed a rapid and efficient technology with low cost. Here we propose an SCRS based method to identify NTM based on confocal SCRS. We selected six common NTM species in the clinic, Mycobacterium abscessus, Mycobacterium gordonae, Mycobacterium fortuitum, Mycobacterium fortuitum, Mycobacterium avium and Mycobacterium kansasii. The unsupervised low-dimensional visualization t-distribution random neighborhood embedding method for the data structures proved the separability of data in the low-dimensional space. Performance of six commonly classifiers, including Support Vector Machine (SVM), K-Nearest Neighbor method (KNN), Partial Least Square-Discriminate Analysis (PLS-DA), Random Forests (RF), Linear Discriminant Analysis (LDA) and XG Boost was compared, with SVM and LDA achieving an accuracy of 99.4% and 98.8% respectively in NTMs classification. SVM offers 100% classification accuracy for every species, except Mycobacterium kansasii which is slightly lower (97.96%, 48/49), while LDA offers 100% accuracy for each species except Mycobacterium abscessus (95.65%; 22/23) and Mycobacterium gordonae(96.30%, 26/27). Therefore, SCRS combined with SVM can accurately classify NTMs and thus provide a new tool for the rapid diagnosis of NTM.
Nov. 01, 2021Vol. 41 Issue 11 3468 (2021)
De-ming KONG, Hong-jie CHEN, Xiao-yu CHEN, Rui DONG, and Shu-tao WANG
The emergence of oil pollution has destroyed the ecological environment. Therefore, the study of oil identification methods is of great significance to the protection of the environment. Petroleum spectrum data can be obtained by fluorescence spectroscopy. At the same time, the spectrum data is preprocessed, and feature information is extracted by dimensionality reduction. Then the pattern recognition algorithm is used for classification, it can realize the qualitative analysis of oil. However, it is vital to study a more efficient way of data dimensionality reduction and recognition algorithms. Based on the three-dimensional fluorescence spectroscopy technology, this paper uses sparse principal component analysis (SPCA) to extract the features of the fluorescence spectrum data measured by the FS920 spectrometer, and the support vector machine (SVM) algorithm applies for classification and recognition, thereby a more efficient oil identification method is obtained. First, seawater and sodium dodecyl sulfate (SDS) was prepared into a micelle solution with a concentration of 0.1 mol·L-1. It was used as a solvent to prepare solutions of 20 different concentrations of 4 kinds of oil: Diesel oil, Jet fuel, Gasoline and Lubricating oil. Then, the three-dimensional fluorescence spectrum was measured by the FS920 spectrometer, and the data schould be preprocessed. Finally, the pre-processed data is extracted using SPCA, and principal component analysis (PCA), and the feature vectors are classified by SVM and K-nearest neighbor (KNN) two pattern recognition algorithms, the classification results of four models PCA-KNN, SPCA-KNN, PCA-SVM and SPCA-SVM are obtained. The research results show that the classification accuracy rates obtained by the four models are 85%, 90%, 90% and 95% respectively. In the same classification algorithm, the classification accuracy obtained by using SPCA is 5% higher than that of PCA. Therefore, SPCA can better highlight the main components in its sparsity, and the sparsity of the load matrix can remove redundant information between variables, achieve the optimization of dimensionality reduction, and provide a better classification for subsequent classification. Effective data feature information; Under the same feature extraction algorithm, the classification accuracy rate obtained by using the SVM algorithm for classification is 5% higher than the accuracy rate obtained by the KNN algorithm, it shows that the SVM algorithm has more advantages in classification. Therefore, this paper uses three-dimensional fluorescence spectroscopy technology combined with SPCA and SVM algorithms to accurately identify petroleum, which provides a new idea for the efficient detection of petroleum pollutants in the future.
Nov. 01, 2021Vol. 41 Issue 11 3474 (2021)
Si-yuan WANG, Bao-jun ZHANG, Hao WANG, Si-yu GOU, Yu LI, Xin-yu LI, Ai-ling TAN, Tian-jiu JIANG, and Wei-hong BI
The frequency and area of red tide in China’s coastal areas continue to increase, resulting in serious economic losses. According to the toxic characteristics of red tide, it is usually classified into three categories: non-toxic red tide, ichthyotoxic red tide and toxic red tide. Among them, paralytic shellfish poison is the main toxin produced by toxic red tide. Because of its wide distribution and strong toxicity have become one of the most harmful biological toxins. According to the different intake of paralytic shellfish poisoning, people will feel tingling or burning in various parts of the body after eating shellfish poisoning, and then they will be paralyzed or even die in a short time. Many people have died after eating shellfish. The intake of paralytic shellfish poisoning mainly depends on the concentration of paralytic shellfish poisoning algae. Therefore, it is particularly important to monitor the concentration of paralytic shellfish poison producing algae. In this paper, a quantitative analysis model of paralytic shellfish poison producing algae was established by three-dimensional fluorescence spectroscopy combined with chemometrics. Firstly, The three-dimensional fluorescence spectrum contour map of algae samples were analyzed by f-4600 fluorophotometer, including Alexandrium minimum, Gymnodinium catenatum and Alexandrium. Then, the new features of the three-dimensional fluorescence spectrum of paralytic shellfish poisoning algae were established using the emission spectrum data under different excitation wavelengths. Finally, the new feature was the input of particle swarm optimization least squares support vector machine and partial least squares regression respectively, and the quantitative analysis model of paralytic shellfish poisoning algae was made. The results showed that the quantitative analysis model established by Particle Swarm Optimization- Least Squares Support Vector Machine algorithm was generally better than the partial least squares regression algorithm when using the emission wavelength of 650~750 nm under an excitation wavelength of 460 and 530 nm. The results show that RC=0.999 9, RMSEC=0.017 1, RP=0.949 2, RMSEP=0.291 0. It shows that the three-dimensional fluorescence spectrum combined with the quantitative analysis model of Particle Swarm Optimization- Least Squares Support Vector Machine can effectively monitor the concentration value of paralytic shellfish poison producing algae in vivo, which provides a new online detection method for the concentration detection of paralytic shellfish poison producing algae.
Nov. 01, 2021Vol. 41 Issue 11 3480 (2021)
Ling-mei NIE, Tao ZHA, Bin-biao XIA, Kai ZHANG, Zhi-qiang GUAN, You-quan ZHAO, Da YUAN, Xuan CAO, and Yan LIU
Fluorescence quenching technology is one of the advanced technologies for rapid measurement of oxygen content in sewage, surface water and aquaculture water. Oxygen sensitive membrane is the core of fluorescence quenching detection technology. Oxygen sensitive membrane with high fluorescence emission efficiency owns high sensitivity, strong specificity and high signal-to-noise ratio,which makes the detection results more accurate. High efficiency is not the basis of selecting oxygen sensitive film and the key to the optimization design of dissolved oxygen detection components, detection circuit and detection optical path. There is no standard method for evaluating the quality of oxygen-sensitive membranes in existing dissolved oxygen fluorescence detection devices. Based on the research on the optical path and circuit of existing sensor probes, this paper proposes a method to evaluate the quality of oxygen-sensitive membranes using the fluorescence emission efficiency of the whole wavelength range. In this method, the high-power xenon lamp was selected as the excitation light source, and the monochromatic spectroscopy was performed based on the continuous single-wavelength scanning method. Then of oxygen-sensitive membranes were determined by scanning the excitation light spectrum and fluorescence spectrum, and the fluorescence emission efficiency calculation method was put forward and established. The method could objectively evaluate the fluorescence emission ability and find the optimum excitation wavelength accurately. In order to verify the feasibility of this method, this article conducted experimental measurement on a number of oxygen-sensitive film samples from home and abroad. The test results showed that: the fluorescence emission efficiency of a single oxygen-sensitive film varied with wavelength and exhibits a multimodal distribution. The fluorescence efficiency curves of the samples of the same type were similar, but there were significant differences in the fluorescence emission efficiency. The fluorescence emission efficiency of the samples with the largest excitation wavelength was 14.5% higher than that of the ones with the smallest excitation wavelength. The wavelength of the highest peak of the given three films were located differently, respectively lying at 401, 543 and 435 nm, meanwhile, all emission peaks were at 650 nm. it is great different of magnitude from 10 to 100 times of the maximum fluorescence emission efficiency for every oxygen sensor membrane. In practice, the observed fluorescence efficiency is only half of the highest, because the exit light wavelength used is not the best one with highest fluorescence, which indicates that it is necessary to optimize the wavelength selection of exit light in order to obtain the highest efficiency. In conclusion, this paper established a dissolved oxygen-sensitive membrane fluorescence emission efficiency detection system, proposed a method to effectively evaluate the quality of oxygen-sensitive membranes based on fluorescence emission efficiency, and carried out the experimental determination of oxygen-sensitive membrane samples. The work in this paper is expected to be used in the research of new oxygen-sensitive membrane materials and processes and the optimal design and manufacture of sensors.
Nov. 01, 2021Vol. 41 Issue 11 3486 (2021)
Xue-peng SUN, Xiao-yun ZHANG, Shang-kun SHAO, Ya-bing WANG, Hui-quan LI, and Tian-xi SUN
Confocal X-ray fluorescence is a directly non-destructive analysis technique with spatial resolution, widely used in materials, biology, mineral sample analysis, archaeology, evidence traceability and other fields. The confocal X-ray fluorescence spectrometer work is based on a polycapillary X-ray lens. A polycapillary focusing X-ray lens (PFXRL) attached to the X-ray tube is used to focus the divergent X-ray from the X-ray tube to the output focal spot with dozens of micron diameter and high power density gain. A polycapillary parallel X-ray lens (PPXRL) with an input focal spot placed on the front of the silicon drift detector is used to receive the fluorescence signal from the specific region. The overlap region of the output focal spot of the PFXRL and the input focal spot of the PPXRL in the confocal X-ray fluorescence spectrometer is called probe volume. Only the sample in the probe volume can be detected. The spatial information of the sample can be obtained by the relative movement of the probe volume and sample point by point. The size of the probe volume determines the spatial resolution of the confocal X-ray fluorescence spectrometer. Thus, it is significant to measure the size of the probe volume. The shape of the probe volume is similar to an ellipsoid. The size of the probe volume can be expressed as the horizontal resolution X, Y and the depth resolution Z, as showni n Fig.1. The detail size of the probe volume of the confocal X-ray instrument is commonly measured by the metal wire ormetal film using the knife scanning method. To precisely measure the probe volume size, the diameter of the metal wire prefer small than the probe volume size. It is difficult to place the metal wire close to the probe volume because the probe volume size and mental wire diameter are dozens of microns. According to obtain the changing curve of the probe volume size and the energy of the incident X-ray beam, various metal wires were used, which is a waste of time. The metal film is suitable for measuring the depth resolution of the probe volume (Z). However, it is difficult for the metal film to measure the horizontal resolution of the probe volume (X, Y). To solve the problem mentioned above, a special sample of series metal wires stick on paper was used to measure the size of the confocal volume of the confocal X-ray instrument. To adjusting the special sample close to the probe volume, the probe volume can be placed in the plane of the paper. With the assistance of the digital camera, the metal wire can be rapidly placed close to the probe volume. After putting the metal wire close to the probe volume, two-dimensional scanning is performed along with two directions of the probe volume with the help of the motorized translation stage. The changing curve of the probe volume and incident X-ray energy was obtained by processing the data obtained from the two-dimensional scanning. In this study, the probe volume size of the confocal X-ray instrument in our laboratory was measured by the method proposed above.
Nov. 01, 2021Vol. 41 Issue 11 3493 (2021)
Ya PENG, Dong-ling LI, Wei-hao WAN, Qing-qing ZHOU, Wen-yi CAI, Fu-lin LI, Qing-bin LIU, and Hai-zhou WANG
Cast-forging GH4096 superalloy turbine disk is a key hot end component of aero-engine because of its excellent properties such as high temperature bearing capacity, high strength, low crack growth rate, high fatigue resistance and so on. However, due to its high alloying degree, large part size and complex preparation process, it is inevitable that the composition and microstructure distribution will be uneven, which will affect the service performance of the turbine disk to a certain extent. Micro-area X-ray fluorescence spectroscopy (μ-XRF) has the advantages of high micro-resolution, fast analysis speed, simultaneous analysis of multi-elements, non-destructive and so on, so it is widely used in archaeology, geology, biology and other fields. However, there is little research on the composition distribution of large-size superalloy components, and there is no report on the quantitative distribution of composition at the original location of the material. In this experiment, by selecting suitable measuring conditions and optimizing instrument quantitative method, a new quantitative analysis method of composition distribution of cast-forging GH4096 alloy turbine disk based on microbeam X-ray fluorescence spectroscopy was established, and the in-situ statistical analysis method was introduced to analyze the quantitative statistical distribution of Cr, Co, Mo, W, Ti, Al, Nb and Ni in turbine disk. It is found that Co, Mo and Ti have obvious arc negative segregation zone from hub to flange in the central region of turbine disk thickness, while Ni and Cr have arc positive segregation zone. In addition, there is also a certain composition gradient distribution in the radial direction of the turbine disk. The contents of Co, Cr and W gradually decrease from the hub to the flange, while the contents of Mo, Ti and Nb show a gradual upward trend. After the calculation and analysis of the maximum segregation degree, statistical segregation degree and statistical fitting degree of each element, it is known that the overall segregation degree of Cr, Co, Mo, W, Ti, Nb and Ni elements in the measurement area is small, the statistical coincidence degree is large, and they have better composition uniformity within the allowable range of material element design values. The linear distribution of elements in the same test area was analyzed by spark source metal in-situ analyzer (OPA-200). The analysis results agree with those obtained by microbeam fluorescence spectra, indicating that there is temperature field distribution in large-size turbine disks during heat treatment, which leads to differences in element diffusion behavior and microstructure distribution, so there is some segregation in different parts. Through the quantitative statistical analysis of the composition distribution of the large size turbine disk, it is of great significance to evaluate the uniformity of the composition distribution of the new cast-forging deformed GH4096 superalloy turbine disk and to analyze the correlation between the preparation process and the composition and structure distribution of the significant size components.
Nov. 01, 2021Vol. 41 Issue 11 3498 (2021)
Xiao-yu CHEN, kun ZHANG, and De-ming KONG
The component detection of petroleum mixed oil is an important research content in the field of three-dimensional fluorescence spectroscopy. The actual obtained three-dimensional fluorescence spectrum data of mixed oil has problems such as the serious overlap of different component spectra and poor trilinearity of the data. When analyzing the three-dimensional fluorescence spectrum by the parallel factor algorithm (parafac), the difference between the analytical spectrum and the standard spectrum is too large, or the type of oil cannot be judged correctly. The paper verifies that the parallel factor algorithm can be applied to three-dimensional fluorescence partial derivative spectroscopy. This paper combines the three-dimensional fluorescence partial derivative spectroscopy with the parafac, improving the degree of fitting between the analytical spectrum and the standard spectrum. Therefore, this paper realizes the accurate detection of the components of petroleum mixed oil. First, the paper use sodium dodecyl sulfate solution (SDS) as the solvent to prepare 15 parts of pure oil solutions of different concentrations of jet fuel and lubricating oil. 9 parts of mixed oil solution are prepared by jet fuel and lubricating oil according to different concentration ratios. The FS920 fluorescence spectrometer obtains the three-dimensional fluorescence spectrum data of 39 samples. They were using the following methods to preprocess the three-dimensional fluorescence spectrum data. Raman scattering is removed by the subtraction standard method. The Rayleigh scattering area is subtracted, and then the subtracted area is interpolated by the segmented cubic Hermite interpolation method to perfect the data. The wavelet transform threshold denoising method is used to remove the high-frequency noise in the spectrum data. Finally, the Savitzky-Golay fitting derivative method is used to obtain the first-order partial derivative spectrum of the three-dimensional fluorescence spectrum. The parafac is used to analyze the three-dimensional fluorescence spectrum and the three-dimensional fluorescence partial derivative spectrum. The experimental results show that when the parafac is used to analyze the three-dimensional fluorescence spectrum of the mixed oil, the lubricating oil analytical results are better, but the analytical results of jet fuel have big problems. When the parafac used to analyze the three-dimensional fluorescence partial derivative spectrum of the mixed oil, the analysis results of jet fuel are significantly improved while ensuring the analysis results of lubricating oil. The correlation coefficient between the analytical spectrum and the standard spectrum of jet fuel has increased by 12.0% (emission spectrum) and 6.7% (excitation spectrum), and the root means square error has reduced by 70.4% (emission spectrum) and 20.6% (excitation spectrum). In view of the poor trilinearity of three-dimensional fluorescence spectrum data, three-dimensional fluorescence partial derivative spectroscopy combined with parafac analysis method is better than three-dimensional fluorescence spectroscopy combined with the pafarac analysis method, which achieves accurate detection of mixed oil components.
Nov. 01, 2021Vol. 41 Issue 11 3506 (2021)
Zheng-jiang LIU, Qian-cheng ZHANG, Hui-yan MA, and Ju-ming LIU
Hangjin2# clay is a layered iron-bearing natural mineral found in Ordos, Inner Mongolia. In succession, X-ray diffraction, pyridine adsorption Fourier transform infrared spectroscopy and X-ray photoelectron spectroscopy were used to characterize Hangjin2# clay. X-ray photoelectron spectroscopy results indicated that Fe in Hangjin2# clay skeleton structure mainly exists as Fe(Ⅲ) and Fe(Ⅱ). Moreover, the binding energy of Si and Al in Hangjin2# clay has increased significantly compared with the standard binding energy of Si and Al in silicon-oxygen tetrahedron and octahedron aluminum oxygen, which indicated the presence of Lewis and Brönsted acid sites. In heterogeneous Fenton reaction, structural iron in Hangjin2# clay could react with H2O2 to produce?OH to degrade methyl orange, but the rate is slow and difficult to cycle. After acid activation, Si and Al’s increased binding energy in activated Hangjin2# clay has been confirmed, and iron in activated Hangjin2# clay has transformed into non-structural iron which coexists in the form of Fe2+ and Fe3+. Whatsmore, the increase Lewis acid and Brönsted acid sites on activated Hangjin2# clay surface have been confirmed by the characterization of X-ray photoelectron spectroscopy, pyridine infrared, and ammonia temperature-programmed desorption. After activation, Fe3+ and Fe2+ could circularly react with H2O2 to continuously generate ·OH to degrade methyl orange. Furthermore, Brönsted acid sites on the activated Hangjin2# clay surface could provide protons to surround H2O2, and the formation reaction of $HO_{2}^{-}$ will be inhibited. Lewis acid sites on activated Hangjin2# clay surface could increase adsorption oxygen content. Moreover, Fe2+ can be oxidized by adsorption oxygen to form Fe3+, promoting the circulation between Fe2+/Fe3+. Furthermore, in the oxidation process, the electron could transfer to adsorption oxygen to form $O_{2}^{·-}$ which can be reacted with protons provided by Brönsted acid sites to form ·OH. These ·OH and $O_{2}^{·-}$ are oxidizing radicals, which could improve the reaction activity of Hangjin2# clay in heterogeneous Fenton reactions. In addition, X-ray diffraction analysis indicated that acid activation could convert $CO_{3}^{2-}$ to $SO_{4}^{2-}$, while $SO_{4}^{2-}$ has a less negative effect on Fenton reaction compared with $CO_{3}^{2-}$.
Nov. 01, 2021Vol. 41 Issue 11 3512 (2021)
Yan LI, Yang BAI, Dan WEI, Wei WANG, Yu-mei LI, Hong XUE, Yu HU, and Shan-shan CAI
Fulvic acid (FA) is an important component of soil humus. As an intermediate substance in soil humification, the structural characteristics of FA play an important role in indicating the improvement of soil organic matter. The combined organic and inorganic fertilizers are an effective measure for soil fertility improvement, straw resource utilization and inorganic fertilizer reduction. In order to explore the effect of straw organic fertilizer instead of inorganic fertilizer (nitrogenous fertilizer) on soil FA in the black soil region of Heilongjiang Province, six treatments were set up, including no fertilization (CK), a single application of inorganic fertilizer (NPK), 25% of organic nitrogen fertilizer (NPKM1), 50% (NPKM2), 75% (NPKM3), and 100% (NPKM4). The contents of soil organic carbon (SOC) and FA were determined. The source of soil FA was characterized by fluorescence index (FI) and biological index (BIX), and the degree of soil humification was analyzed by humification index (HIX). Three-dimensional fluorescence spectrum parallel factor analysis method was used to analyze the fluorescence components and maximum fluorescence intensity (Fmax) of soil FA, and redundancy analysis (RDA) was used to explore the response relationships among fluorescence intensity, soil organic carbon and different treatments. The results showed that compared with NPK treatment, the contents of SOC and soil FA increased significantly in the treatments of combined application of organic and inorganic fertilizers, the greatest impact on NPKM2 treatment, SOC and soil FA content increased by 8.06% and 13.84%. Soil FA was affected by both autochthonous and terrestrial sources (FI>1.4, 0.8Fmax values of fulvic-acid-like and humic-acid-like first increased and then decreased, and the Fmax value of protein-like gradually decreased. The Fmax values of fulvic-acid-like and humic-acid-like were the highest, and the relative percentage of humic-acid-like was the highest. The results of RDA showed that NPKM2 treatment had the greatest effect on the content of SOC and soil FA. Therefore, based on the analysis of soil FA fluorescence spectrum characteristics, in order to improve the content of soil organic matter, increase straw utilization rate and reduce the application of inorganic fertilizer, the treatment of straw organic fertilizer replacing inorganic nitrogen fertilizer by 50% was the best organic-inorganic fertilizer ratio.
Nov. 01, 2021Vol. 41 Issue 11 3518 (2021)
Yun-peng LI, Xue-jing DAI, Meng WANG, Dan WANG, Yi GAO, Ming-jiu WANG, Xin-lin SHI, and Ming-ze LI
Rapid and non-destructive detection of invisible handwriting, such as erasure, steganography and covering, is a research difficulty in the field of forensic scientific document inspection. In the current research, the method of switching multi-band light source and filter is mostly used to visualise the invisible handwriting, but the spectroscopy mechanism of invisible handwriting is less analyzed. Therefore, the efficiency of invisible handwriting and the success rate of testing are both not high. In order to improve the efficiency and accuracy of erasure, steganography and covering in document examination, the mechanism and rapid visualization method of the three kinds of invisible handwriting were studied by measuring the excitation and fluorescence spectra, reflection and transmission spectra, and micro-topography. Based on the hyperspectral imaging technology of liquid crystal tunable filter (LCTF) and support vector machine (SVM) classification algorithm, a rapid test method for simultaneous display and classification of invisible handwriting is proposed. Chenguang and Pilot erasable pen, fluorescent writing pen and lemon juice emit strong fluorescence under the excitation of 365 nm long-wave ultraviolet light. The fluorescence wavelength of erasable pen and lemon juice is about 716 nm, and the fluorescence wavelength of fluorescent writing pen is 447 nm. Besides the lemon juice invisible writing can also be effectively visualized by using 254 or 365 nm ultraviolet reflection imaging. In the study of covering handwriting, it is found that the transmittance of a ballpoint pen, marker pen and erasable pen is more than 60% in the infrared band of 700~2 500 nm, and the transmittance of a gel pen is less than 20%. Therefore, the near-infrared band of 850 nm imaging is used to effectively visualize the Chenguang gel pen covered by a Pilot ballpoint pen. The LCTF hyperspectral camera was used to image the three kinds of invisible handwriting in the range of 400~720 nm with a step of 5 nm, and the different handwriting in the image were visualized classified simultaneously by SVM classification algorithm, the total classification accuracy was 99.284 4%, and the Kappa coefficient was 0.959 1. Photoluminescence imaging using a 365 nm light source as an excitation light can effectively visualize erasure and steganography handwriting. Because the reflectivity of different inks in the near-infrared band is quite different, near-infrared imaging can effectively visualize the covering handwriting. SVM classification technology based on LCTF hyperspectral imaging can realize the simultaneous display and classification of different types of invisible handwriting and has high visualization efficiency and classification accuracy.
Nov. 01, 2021Vol. 41 Issue 11 3524 (2021)
Jing JIANG, Zi-wei ZHAO, Chang CAI, Jin-song ZHANG, and Zhi-qing CHENG
In order to reduce the influence of dust retention on the extraction of effective spectral information of tea leaf and to establish a more robust water content estimation model of tea leaf by spectrum. We took “Shu Chazao” as the research object and collected samples of tea leaves by random sampling. Then the hyperspectral information, leaf water content and dust retention rate of leaves were measured. The correlation coefficient method was used to extract feature information. Newly-built vegetation indexes were constructed by the normalization calculation method and ratio calculation method, The relative variability analysis was used to screen the candidate indexes that reduce the impact of dust retention on the accuracy of the leaf water content estimation model. By comparing the response relationship between newly-built vegetation indexes and existing water indexes under the different conditions of dust retention, the optimal vegetation index estimation model of tea leaf water content which less affected by dust retention, was selected. Finally, the high-precision estimation models of the tea leaf water content with the optimal vegetation index were established and verified. The results show that, dust leaves’ spectral reflectance is higher than clean leaves in 711~1 378 nm bands. The correlation between the water content of the tea leaves and vegetation index is affected by dust retention, but its correlation direction is not. Dust retention also makes the accuracy value of tea leaf water content estimation model decreased. The newly-built ratio index (RVI(1 298, 1 325)) with 1 298 and 1 325 nm as the center band is least affected by leaf dust retention under complex environmental conditions. Therefore, it is the optimal vegetation index, and the hyperspectral estimation model of tea leaf water content constructed by RVI(1 298, 1 325) has higher estimation accuracy, better sensitivity and stability (y=0.245x-0.241, R2=0.854, RMSE=0.001). In conclusion, this study provides a basis for the refined water management of tea trees and provides new ideas that high-precision models of water content estimation is constructed by hyperspectral information under complex environmental conditions.
Nov. 01, 2021Vol. 41 Issue 11 3532 (2021)
Li-jie LI, Yan-bin YUE, Yan-cang WANG, Ze-ying ZHAO, Rui-jun LI, Ke-yan NIE, and Ling YUAN
Pitaya is a new kind of fruit with high nutritional value and good economic benefit which was introduced into China for a short time. Its stems are the most important photosynthetic organs, which is quite different from the common green leaf fruit trees. In order to explore the spectral characteristics and the estimation method of biochemical components of vegetation using stems for photosynthesis, the field experiments were carried out at four nitrogen application levels in Luodian Guizhou, the chlorophyll content of Hylocereus polyrhizus stems were taken as the research object. Firstly, hyperspectral reflection data and chlorophyll content data of Hylocereus polyrhizus stems under different nitrogen nutrient were measured simultaneously; Secondly, the hyperspectral data were analyzed by mathematical transform, continuous wavelet transform(CWT)and correlation analysis algorithm to extract and screen the characteristic bands; Finally, the chlorophyll content estimation model of stem was established by partial least squares regression(PLSA). The results showed that: (1)The overall trend of the original spectral curve of Hylocereus polyrhizus stems is similar to common green leafed plants, the bands sensitive to chlorophyll content of branches are mostly located in the red edge and near-infrared region. In the near-infrared region, the variation of stems spectrum with nitrogen application is different from that of green leaves. The absorption peak (valley) of Hylocereus polyrhizus branches spectrum increased (deepened) with the increase of nitrogen application. (2)First derivative(FD)and CWT in the scale of L1—L5 can effectively improve the sensitivity of the spectrum to chlorophyll content. The sensitive region of the original spectrum and chlorophyll content of Hylocereus polyrhizus stems is located in 730~1 400 nm. Both the mathematical transform and CWTcan significantly improve the sensitivity of the spectrum to chlorophyll content, but the distribution of sensitive bands is relatively scattered, and there are more sensitive bands in the red edge (730 nm) and near infrared region(1 100~1 600 nm), which is different from the distribution of chlorophyll content sensitive bands in leaves. (3)Both the mathematical transformation and CWT can significantly improve the spectral estimation ability of chlorophyll contentin Hylocereus polyrhizus stems. The estimation model based on FD the optimal models of mathematical transformation, the verification accuracy is $R_{verification}^{2}$=0.625, RMSE=0.048, RPD=1.238(FD). The model based on L1 and L4 has relatively high modeling accuracy and estimation accuracy, which is the best model with $R_{verification}^{2}$=0.678, RMSE=0.037, RPD=1.652(CWT). Hyperspectral technology can be used as a non-destructive monitoring method for chlorophyll content and nutrition diagnosis of Pitaya. This study provides a supplement for improving the retrieval of chlorophyll content of different vegetation types based on hyperspectral index.
Nov. 01, 2021Vol. 41 Issue 11 3538 (2021)
Mei-chen CHEN, Hai-ye YU, Xiao-kai LI, Hong-jian WANG, Shuang LIU, Li-juan KONG, Lei ZHANG, Jing-min DANG, and Yuan-yuan SUI
Environmental stress of light and temperature is a major restricting factor that affects the quality and yield of crops. Traditional crop stress monitoring is insufficiently sensitive, time-consuming and laborious, and mostly destructive testing. In recent years, with the rapid development of information technology, hyperspectral technology can quickly and non-destructively obtain crop physiological information, and dynamically monitor the response to adversity, providing digital support for the precision production and intelligent decision-making of modern agriculture, and is of great significance for realizing the transformation of traditional agriculture to precision and modern digital agriculture. This paper takes the corn seedling stage as the research object, obtains the hyperspectral data and physiological parameters of leaves under different light and temperature environments, explores the response law of corn leaves to different light and temperature environments, conducts hyperspectral difference analysis, and construct physiological parameters Hyperspectral inversion model. The correlation analysis method is used to screen the spectral sensitive band. The preprocessing method combining Multivariate Scattering Correction (MSC), Standard Normal Variable transformation (SNV), and Savitzky-Golay (SG) smoothing is used, respectively. Partial Least Square regression (PLS), Principal Component Regression (PCR), Stepwise Multiple Linear Regression (SMLR) three modeling methods combination, the model correlation coefficient and root mean square error are used as model effect evaluation indicators to explore the optimal method of hyperspectral inversion of leaf physiological parameter models. The results show that the hyperspectral characteristics of corn under different light and temperature environments have the same changing trend as a whole, but there are still differences. The reflectance of the spectrum in the 500~700 nm band gradually increases with the increase of light intensity, the reflectivity of the spectrum in the 760~900 nm band gradually increases with the increase of temperature, and the changes of the light and temperature stress environment can be reflected in the hyperspectral characteristics. The spectral reflectance in the 760~900 nm band is relatively high in a high temperature stress environment, the spectral reflectance is low in a low light stress environment, and the reflectance is significantly reduced in a low temperature stress environment. The optimal combination of SPAD and Fv/Fm inversion model is PLS-MSC-SG, the correlation coefficients of the model validation set are 0.958 and 0.976, and the correlation coefficients of the training set are 0.979 and 0.995, respectively. The model’s predictive accuracy is high, which indicates that the use of hyperspectral technology can realize quantitative monitoring of maize plants under light and temperature environmental stresses, improve the level of refined management in the field, and provide a reference for the intelligent management of high-quality and high-yield maize.
Nov. 01, 2021Vol. 41 Issue 11 3545 (2021)
Jin-qiang CHANG, Ruo-yu ZHANG, Yu-jie PANG, Meng-yun ZHANG, and Ya ZHA
The classification and detection of impurities in machine-harvested seed cotton provides a reference for adjusting cotton cleaning mechanical processing parameters and has important significance for improving lint quality. However, the uneven distribution of seed cotton makes image detection more difficult, and traditional detection methods cannot effectively detect various impurities. The hyperspectral imaging method was used to discriminate the five impurities (cotton leaf, cotton stem, plastic film, hull inner, and hull outer) in the machine-harvested seed cotton. The hyperspectral images of 120 machine-harvested seed cotton samples were collected, and the region of interest was selected to obtain the average spectral curve. Due to the difference in the composition of materials, various impurities showed different spectral absorption and reflection characteristics, and the spectral difference of the characteristics of different materials was greater than that of similar materials. Principal component analysis (PCA) of the extracted average spectral curve showed that cotton, plastic film and hull outer were better separable than the other three types. However, the spectral distributions of cotton leaf, hull inner, and cotton stem overlapped seriously. Based on the extracted average spectral curve as the training sample, three discrimination algorithms of linear discriminant analysis (LDA), support vector machine (SVM) and neural network (ANN) were used to optimize the algorithm parameters and finally established the impurity detection model. Among them, the sample space after dimensionality reduction of the LDA model shows better separability than PCA. Regularization was used to prevent overfitting in LDA, and the accuracy rate of the training set was 86.4%, and the accuracy of the test set was 86.2%. The parameter optimization result of the SVM model was C=105, g=0.1. The accuracy of the training set was 83.42%, and the accuracy of the test set was 83.40%. The parameter optimization result of the ANN model was that the number of hidden layers and neurons were 1 and 10, respectively. The accuracy rate of the training set was 82.9%, and the accuracy rate of the test set was 81.8%. Comparing the classification accuracy and detection time of the three models, the results of the LDA model were all the best. Through the pixel level discrimination of hyperspectral images, the results show that both cotton and botanical impurities were effectively detected. However, there were misidentifications between plastic film and cotton, which was consistent with the results of the impurity spectrum classification discrimination model. Therefore, hyperspectral imaging technology can detect and identify seed cotton impurities quickly and non-destructively and provide feedback parameters for cotton processing equipment, which is of great significance to the mechanization and intelligence of cotton processing.
Nov. 01, 2021Vol. 41 Issue 11 3552 (2021)
Bao-hua YANG, Zhi-wei GAO, Lin QI, Yue ZHU, and Yuan GAO
Soluble solid content (SSC) is a key factor to evaluate the flavor and quality of fruits. The feature extraction of hyperspectral images provides the data basis and method path for the non-destructive estimation of the solid soluble content. Previous studies have shown that fruit internal quality evaluation based on multi-spectrum, fluorescence spectrum, near-infrared spectrum, and electronic nose has achieved good results. However, the lack of multi-feature fusion limits the accurate estimation of fruit quality. Therefore, this study proposed a model based on stacked autoencoder-particle swarm optimization-support vector regression (SAE-PSO-SVR) to predict the solid soluble content of fresh peaches. Firstly, hyperspectral images extracted spectral information, image pixel information corresponding to different bands, and fusion information. Secondly, a universal stacked autoencoder (SAE) was set up to extract the deep features of spectral information, spatial information, and space-spectrum fusion information. Finally, the deep features were used as the input data of the particle swarm optimization-support vector regression (PSO-SVR) model to predict the solid soluble content of fresh peaches.Among them, three hidden layer network structures were designed for the SAE model with spectral information as input data, including 453-300-200-100-40, 453-350-250-150-50 and 453-350-250-100-60. Three network structures of hidden layer nodes were designed forthe SAE model with image information as input data, including 894-700-500-300-50, 894-650-350-200-80 and 894-800-700-500-100. Three hidden layer network structures were designed forthe SAE model with fusion information as input data, including 1347-800-400-200-40, 1347-750-550-400-100 and 1347-700-500-360-150.The experimental results show that the models with SAE structures of 453-300-200-100-40, 894-800-700-500-100 and 1347-750-550-400-100 have the better estimation effect for spectral information, image information and fusion information as input data of the SAE model, and the prediction accuracy of the model based on the deep features of the fusion information was significantly better than that of the model based on spectral features or image features. The SAE model with the structure of 1347-750-550-400-100 was used to extract the deep features of the fusion information to estimate and visualize the solid soluble content of different varieties of fresh peaches. The results show that the prediction performance based on the SAE-PSO-SVR model was the best (R2=0.873 3, RMSE=0.645 1). Therefore, the SAE-PSO-SVR model proposed can improve the estimation accuracy of solid soluble content of fresh peaches, which provide technical support for detecting other components of fresh peaches.
Nov. 01, 2021Vol. 41 Issue 11 3559 (2021)
Hui SHENG, Hai-xu CHI, Ming-ming XU, Shan-wei LIU, Jian-hua WAN, and Jin-jin WANG
Hyperspectral data can capture the spectral changes caused by different concentrations of chemical oxygen demand (COD) in inland water bodies, and it is important to study the relationship between spectrum and COD concentrations for COD estimation. Support Vector Regression (SVR) model has the advantages of being suitable for small samples and good generalization ability, but it is difficult to select a parameter and prone to fall into the local extremum. In order to solve this problem, this study introduced Simulated Annealing-Particle Swarm Optimization (SA-PSO) into the parameter optimization process of SVR and proposed an improved SVR (SA-PSO-SVR) method to estimate the inland waters COD. This paper takes the Weihe River Basin as the research area, obtained the COD concentrations and spectral curves through field measurement. The sensitive band was determined by analyzing the response of spectral reflectance to COD at first in this paper, and the Simulated Annealing-Particle Swarm Optimization (SA-PSO) was introduced into the parameter optimization process of Support Vector Regression (SVR) to established an inversion model between the cod concentration and the sensitivity factor. The Orbita Hyper Spectral (OHS) hyperspectral data was used to verify the accuracy, and the distribution of COD concentration was obtained at last. Through spectral analysis, it can be seen that the measured above-surface spectra in this area demonstrated typical spectral signatures of second-class water, and the shape of the spectrum curve shows obvious double-peak characteristics. When the concentration increases, the reflection peak tends to move to the short wavelength direction and the reflection valley to the long wavelength direction. The Pearson’s correlation coefficient was used to analyze COD concentration and the spectral, the result showed that the best inversion factors are four band combinations of 518 nm/940.4 nm, 623.6 nm/636.8 nm, 729.2 nm/890.9 nm and 752.3 nm/857.9 nm. The model established by the SA-PSO-SVR method is accurate compared with models established by SVR, Back Propagation neural network, and linear regression method. The Mean-Relative-Error (MRE) and Root-Mean-Square-Error (RMSE) of the COD estimation model established by the SA-PSO-SVR method are 1.62% and 2.99 mg·L-1 (R2=0.86), respectively. The optimal model established by the measured water surface spectra was applied to the hyperspectral satellite image. The RMSE and MRE are 4.47 mg·L-1 and 11.87% respectively. The obtained COD inversion results of the Weihe-Xiashan reservoir area show: the overall concentration of COD is between 17 and 42 mg·L-1, and COD concentration in the Hanxinba, the northeast region of XiaShan Reservoir, the confluence of the Qu River into the Wei River are higher than other waters. The experimental results show that SA-PSO-SVR is a feasible approach for the COD inversion of hyperspectral data, providing a reference for water resources management in the Weihe River Basin.
Nov. 01, 2021Vol. 41 Issue 11 3565 (2021)
Yu-ting XU, Hao-ran SUN, Xun GAO, Kai-min GUO, and Jing-quan LIN
In recent years, laser-induced breakdown spectroscopy (LIBS) is gradually emerging to classify and identify biological organizations by combining them with algorithms. Due to each part of the pork similar spectral characteristics, it is difficult to achieve accurate identifications only through the analysis of the effect of spectral information, so in this paper studied pork from four different parts of the same individual and sliced and planished them, then applied LIBS technology on four parts, i.e., the organization, fillet, plum flower, and front legs. 100 specimens of each sample were collected and the spectrum analysis was conducted. A preliminary analysis of the spectrum was performed on Ca, Na, K and 6 lines. It was found that other tissues were difficult to distinguish except for the C—N tissue of plum flower with more fat content and higher C content than other tissues, so the Principal Component Analysis (PCA) on these 6 principal components was carried out. The cumulative contribution rate of PC1, PC2 and PC3 reached 95%. The Support Vector Machines (SVM) classification model was established by employing feature scores as the input source of SVM model, and the confusion matrix diagram of these samples got obtained. Through observation of the confusion matrix, the classification accuracy of each type of samples could be clearly distinguished. The results showed that the accuracy of the four samples was 96%, 98%, 97% and 100%, respectively, with an average accuracy surpassing 97%. The study proved that LIBS combined with PCA-SVM can be used as a fast identification method for different parts of pork tissues.
Nov. 01, 2021Vol. 41 Issue 11 3572 (2021)
Xu-dong CHEN, Jing-ge WANG, Di FENG, Jia-wei WEI, Li-ping WANG, and Hong WANG
Spectral enhancement is one of the key methods to improve Laser-Induced Breakdown Spectroscopy (LIBS) analysis performance. Spatial confinement of plasma is often used due to its simple device and better confinement effect. The characteristics of plasma will directly affect the spatial confinement. The properties of the plasma are closely related to the focusing of the laser in the experimental system. In order to study the effect of the laser focusing on the spectral enhancement of the plasma confined by a hemispherical cavity, the condition of the laser focusing was changed by adjusting the distance between the lens and the sample (Lens to Sample Distance, LTSD). Under the experimental configurations without and with confinement, the alloy steel sample was ablated to produce plasma, and the time evolution spectra at 15 different LTSD positions were collected. The two-dimensional spatial distributions of the spectral line intensity and enhancement factor with LTSD and acquisition delay were obtained. The results had shown that the spectral line intensity of the plasma without confinement peaks when the LTSD was 94 and 102 mm, respectively. When the acquisition delay was less than 8 μs, the maximum value of the spectral line intensity was at the LTSD of 94 mm. The maximum intensity appeared at the LTSD of 102 mm when the delay time was greater than 8 μs. Moreover, the line intensity has two sequential enhancements when the hemispherical cavity confined the plasma. The delay time ranges corresponding to these two enhancements were 4~10 and 12~15 μs. The main reason for the second enhancement is that the shockwave reflected by the inner wall of the hemispherical cavity will continue to propagate after interacting with the plasma and it will encounter the other side of the cavity wall and be reflected again secondary compress the plasma. The two-dimensional distribution of the enhancement factor with LTSD and delay time was analyzed. It is found that the maximum enhancement factor of the first enhancement has no obvious trend with the change of LTSD and the enhancement factor fluctuates from 2 to 6. The maximum enhancement factor of the second enhancement first increases and decreases as the LTSD changes and decreases after a small increase. The enhancement factor is relatively high. It reaches the maximum when the LTSD is 96 mm, and the maximum enhancement factor is about 6. The delay time corresponding to the maximum enhancement factor was defined as the optimal delay time. It is found that the optimal delay time for the first enhancement varies from 6 to 9 μs. When the LTSD is in the range of 85~93 mm, the optimal delay time remains unchanged. When the LTSD varies from 94 to 104 mm, the optimal delay time of the first enhancement first decreases and then increases. However, the optimal delay time of the second enhancement maintains at a range from 14 to 15 μs, and there is no obvious change with the change of LTSD.
Nov. 01, 2021Vol. 41 Issue 11 3577 (2021)
Xiao-mei LIN, Xiao-meng WANG, Yu-tao HUANG, and Jing-jun LIN
Aiming at the problem that the quantitative analysis of soil is greatly affected by the matrix effect and the accuracy of the quantitative analysis of LIBS is not good. The particle swarm algorithm is used to optimize the LSSVM to improve the accuracy of the model. Pb Ⅰ 405.78 nm and Cr Ⅰ 425.44 nm was selected as the analysis lines for analysis. Collect the characteristic spectra of twelve samples with different concentrations. The LSSVM calibration model has a low degree of fitting and cannot meet the experimental requirements. The performance of the model needs to be improved. Use particle swarm optimization to optimize the model parameter penalty coefficient γ and kernel function parameter g of LSSVM to obtain the best combination of γ and g. The Pb element is (8 096.8, 138.865 7), and the Cr element is (4 908.6, 393.563 5). Compared with LSSVM, the accuracy of the PSO-LSSVM calibration model is higher. The R2 of Pb and Cr elements is increased to 0.982 8 and 0.985 0, and the fitting effect is significantly improved. The root means square error of the training set of Pb and Cr elements decreased from 0.026 0 Wt% and 0.027 2 Wt% to 0.022 4 Wt% and 0.019 1 Wt%, and the root means square error of the prediction set was reduced from 0.101 8 Wt% and 0.078 8 Wt% to 0.045 8 Wt% and 0.042 0 Wt%, the stability of the model is further improved. It shows that the PSO-LSSVM algorithm can better reduce the influence of the soil matrix effect and self-absorption effect, and improve the accuracy and stability of the analysis results.
Nov. 01, 2021Vol. 41 Issue 11 3583 (2021)
Yuan-jie WU, Hui-qi YE, Jian HAN, and Dong XIAO
Photonic crystal fibers have been widely used in the supercontinuum generation of femtosecond pulse laser sources. When the repetition rate of a laser source is low, the evolution of supercontinuum over time is slow, which is usually not noticed. In applications such as calibrations of astronomical spectrometers, high repetition rate laser sources of the order of gigahertz to tens of gigahertz are required. In this case, the supercontinuum degradation is significant within a limited time period. Using 1040nm femtosecond laser as the pump source, by testing the evolutions of supercontinua of three photonic crystal fibers with different air-filling fractions, it is found that the degradation process accelerates with the increase of the air-filling fraction. Accompanying the degradation of supercontinuum, multiple bright spots of different colors appear in the section where the supercontinuum is generated on the fiber. It implies a directional light leakage phenomenon. Observing the spectral absorption of the spectrally degraded fiber confirmed that the main reason for the degradation is not the generation of massive non-bridged oxygen color centers in the fused silica material. Based on the directional characteristic of the light leakage, a theory that a long-period grating formation in the fiber core by multiphoton absorption is proposed. In order to search for the factors that affect the supercontinuum generations of the photonic crystal fibers, so that the goal of suppressing the degradation can be achieved, firstly, parameters of the fiber tapering are changed. It is expected that the photon tolerance of the fused silica material of the fibers can be enhanced. The experimental results show that the effectiveness is scant. Then, experiments are carried out with maintaining the average power of the laser source, reducing the peak power of the laser pulse and maintaining the peak power of the laser pulse, reducing the average power of the laser source. It is shown that the total amount of high peak power pulses coupled into the optical fiber in a certain time period is the most important factor affecting the supercontinuum degradation. In the application of astronomical spectrometer calibration, the demand for optical power of supercontinuum is not high. Using a chopper to reduce the average power of the incident light of the photonic crystal fiber is an effective, simple and feasible method to slow down the supercontinuum degradation.
Nov. 01, 2021Vol. 41 Issue 11 3588 (2021)
Yao WANG, Shi-xin WANG, Yi ZHOU, Fu-tao WANG, and Zhen-qing WANG
GF-4 can provide stable data for disaster prevention and mitigation, and its mid-infrared sensor can be well applied in rapid-fire monitoring. Because of lacking far-infrared, the spectral information that GF-4 provided is supplementary data as usual. Affected by a single band, the commission error and omission error of the adaptive threshold method is high. Therefore, to probe the potential of GF-4 data and improve the accuracy of fire point recognition, this study analyzed the characteristics of GF-4 data and proposed a fire point detection method with brightness temperature difference correction based on dual temporal image. The method mainly includes three parts: brightness temperature compensation acquisition based on Kriging interpolation on temporal scale, adaptive threshold segmentation on a spatial scale based on contextual information, and fire point detection, with two images-before and during the fire event. Firstly, the difference between the two images is processed. Moreover, we use this difference of non-polluted pixels in the dynamic neighborhood around the potential fire point as the sampling data for spatial interpolation and then substitute the result of the previous step into the first image. Finally, using discrimination conditions for fire point discrimination and false alarm elimination get the final results. The study also compares three spatial interpolation acquisitions: Inverse Distance Weigh, Simple Kriging and Ordinary Kriging. From the fitting results, the Ordinary Kriging can reflect the volatility of the pixel area and has a certain smoothing effect to avoid peaks of background brightness temperature, which is the better method. The study area contains two fires in Qinyuan, Shanxi Province and New Barhu Right Bannerin, Inner Mongolia. Results show that compared with the traditional single time phase algorithm, introducing brightness temperature difference correction data can better fit the background brightness temperature, reducing the commission error to 3% and obtaining comprehensive evaluation index Fβ above 0.9. This developed method could be used to support automatic fire point detection and extraction in future studies.
Nov. 01, 2021Vol. 41 Issue 11 3595 (2021)
Xue LI, Jing-song LIN, Yi-tong GUO, Wei-gang HUO, Yu-xin WANG, and Yang XIA
The polyethylene terephthalate (PET) was used for dielectric to produce the atmospheric pressure helium-argon mixture discharge plasma. The electrical and luminescence properties of PET dielectric barrier discharge were studied using a voltage probe, a current probe, a digital oscilloscope and a digital camera. It found that one or more current pulses appear in every half voltage cycle, and the discharge transits from uniform to pattern discharge with the increase of argon content. Argon atomic spectra intensities (696.54, 763.13, 772.09, 811.17 and 911.81 nm) were measured using a spectral system composed of the diffraction grating and a CCD detector. The influences of argon content and peak voltage (Vp) on the spectra intensity were researched. The results show that: at lower Vp, the above five argon spectra intensities enhance slowly, then weaken sharply, and enhance rapidly again with the increase of argon content; at higher Vp, the intensities of spectral line 696.54, 763.13 and 772.09 nm enhance and the intensities of argon spectral line 811.17 and 911.81 nm weaken. The discharge mode plays an important role in the spectra intensity variation at lower Vp, but the ionization mechanism makes a dominant contribution to the spectra intensity at higher Vp. At argon content ≤30% or ≥80%, the above argon spectra intensities almost remain unchanged, then increase to the stable value with the increasing Vp; at 30%≤argon content≤80%, the above five argon spectra intensities enhance slowly, then weaken sharply, and enhance rapidly again. The electron excitation temperature (Texc) was calculated using the Boltzmann graph method, and the variation of Texc with the ratio of helium to argon was obtained under different Vp. The results show that: the Texc at high Vp is higher than that at low Vp, and the Texc decreases with the increasing argon content. The reason is to maintain the balance between the ionization process and ion escape loss because the electron-helium collision section is much smaller than the electron-argon collision section, but helium has a larger diffusion coefficient than argon.
Nov. 01, 2021Vol. 41 Issue 11 3602 (2021)
Yu ZHANG, Zheng-ye GU, Hong-yao XU, and Shan-yi GUANG
L-Arginine (L-Arg) is an important component of protein and one of the important diagnostic criteria for certain diseases in humans. The concentration change of L-Arg may cause many health problems. Therefore, it is very important to detect L-Arg efficiently and sensitively. At present, most research work based on L-Arg is used as the precursor of NO (Nitric Oxide) to prevent or alleviate some diseases. It are rarely reported for qualitative tests of L-Arg, and the detection of L-Arg by proton transfer to form complex/adduct is even less. In this paper, a colorimetric probe ISO-CN-OH based on isophorone, malononitrile and 2,4-dihydroxybenzaldehyde was designed and synthesized. The method based on proton transfer forming complex/adduct for detection of L-Arg rapidly were found. The UV-Vis spectra showed that absorption peak of the probe at 669 nm increased sharply when L-Arg was added into the ISO-CN-OH and the color of the solution changed from orange yellow to dark green. However, no color and absorption peak change was observed while other amino acids were added. Besides, ISO-CN-OH could detect L-Arg specifically without any interference by competition experiments. What’s more, the titration experiment of L-Arg, showed There is A good linear relationship (R2=0.997) between the relative absorption intensity (A-A0) and the concentration of L-Arg within the concentration range of 1.0~10.0×10⁻⁶ mol·L-1. And the linear regression model wasy=0.020x+0.073. According toDL=3σ/K, the detection limit of ISO-CN-OH was 8.5×10⁻⁸ mol·L-1, which indicated that the probe had very high detection sensitivity. Fixing the total concentration of ISO-CN-OH and L-Arg was 100 μmol·L-1, and the ratio of L-Arg to the total concentration is changed to get the job’s plot titration curve. According to the job’s plot titration curve analysis, it is found that the UV absorption intensity of ISO-CN-OH reached the maximum at 669 nm when the ratio of L-Arg to the total concentration was 0.67, which indicated that ISO-CN-OH coordinated with L-Arg in the ratio of 1∶2. In order to further understand the coordination mechanism of ISO-CN-OH and L-Arg, 1H-NMR titration experiment was carried out. 0, 0.5, 1.0 and 2.0 equivalent of L-Arg (d2O) were added into the DMSO-d6 solution of ISO-CN-OH respectively. It was found that the hydroxyl peak of ISO-CN-OH disappeared and the hydrogen around the hydroxyl group shifted after adding L-Arg. The results showed that ISO-CN-OH causes the formation of negative charges near the —OH group by transferring acidic phenolic hydroxyl protons to l-ArG alkaline guanidine NH group. The forming negative charge complexed with the guanidine part of arginine to form a complex/admixture, which result in a new peak at 669 nm, and the color solution change. The study based on proton transfer forming complex/adduct for detection of L-Arg will provise certain guidelines for the design of L-Arg probe molecules in the future.
Nov. 01, 2021Vol. 41 Issue 11 3607 (2021)
Hui-hua KONG, Xiang-yuan LIAN, Ping CHEN, and Jin-xiao PAN
Photon-counting detector based X-ray spectral computed tomography (CT), realizes the transformation of CT image from gray to color by increasing energy resolution, which increases material identification capability. However, with increasing the number of energy channels, the channel’s noise increases significantly, which decreases the accuracy of material identification. In order to make full use of the sparsity of spectral CT images and the correlation between spectral CT images, a multi constraint narrow-spectral CT iterative reconstruction algorithm is proposed, which can effectively preserve the edges and details of the image while reducing the noise. Furthermore, principal component analysis (PCA) is used to estimate the spectrum information in narrow spectrum CT images, and the mapping relationship between principal component image and color components R, G, B are established. Finally, the color CT image is obtained. This method can effectively identify materials through the color representation of material components and reduce the background noise in the images. The results of simulation and practical experiments show the proposed reconstruction algorithm is effective, and it is feasible to use PCA for the color characterization of material components.
Nov. 01, 2021Vol. 41 Issue 11 3612 (2021)
Qin-rong LIU, Zi-wei DU, Jia-zhen LI, Yi-shuo WANG, Xuan GU, and Xiu-mei CUI
Inorganic elements are essential substances in the growth process of plants in nature and are also the basic components of Chinese medicinal materials. Their composition and content determine the efficacy and properties of Chinese medicine and are an indispensable parameter in the quality control and evaluation of Chinese medicine. The rhizosphere is the node of material and energy exchange between plants and soil. The nutrient elements of the rhizosphere soil are closely related to the intrinsic quality of Chinese medicinal materials. The changes in the composition of medicinal materials and the law of action due to differences in soil, production areas and other ecological factors are issues worthy of study. As an important element determination method, atomic absorption spectrophotometry plays an important role in analysing Chinese herbal medicines and finished medicines. The study used samples of Salvia miltiorrhiza and rhizosphere soil from 9 main producing areas in 5 provinces were used. The atomic absorption spectrophotometry was used to detect the contents of eight inorganic elements of Na, Mg, K, Ca, Mn, Fe, Cu and Zn in the samples. Use cluster analysis, principal component analysis, orthogonal partial least square discriminant analysis and other chemical pattern recognition methods to discuss and summarize. The results show that the established atomic absorption spectrophotometric method has a good linear relationship and has high accuracy and precision. The content of Mn in the Salvia miltiorrhiza from the Shan-dong area is higher than that in other producing areas. Salvia miltiorrhiza from the Si-chuan area have higher Fe and K elements, while the content of Ca in the rhizosphere soil of Salvia miltiorrhiza from Shan-xi province is slightly higher. Cluster analysis showed that there were significant differences between different origins of Salvia miltiorrhiza. The K, Na, Mn and Zn elements in the in root soil showed correlations with several elements in the herbs. The results of the principal component analysis showed that the elements in the soil influenced the variation of the constituent elements of the herbs. If these eight elements were used as evaluation indexes, the quality of Salvia miltiorrhiza in the Shan-dong area would be better. The results of partial least squares discriminant analysis results revealed that four elements, Na, K, Fe and Mg, might be the main influencing factors for the difference in quality of Salvia miltiorrhiza from different production areas. In this study, methods and evaluation systems for the accurate and efficient analysis of inorganic element content in Salvia miltiorrhiza from different producing areas and rhizosphere soil and the evaluation system were to explore the relationship between the quality of authentic medicinal materials and the growth environment. It provides a scientific basis for the quality control and standard establishment of Salvia miltiorrhiza and a reference for other studies.
Nov. 01, 2021Vol. 41 Issue 11 3618 (2021)
Fan MENG, Yang LIU, Huan WANG, and Qi-cai YAN
As an essential tool in science and technology, wavelength detection plays a vital role in analytical chemistry, bio-sensing and optical communication. The traditional spectrometers based on dispersing components or resonant cavities greatly suffer from bulky size, high power consumption and fabrication imperfection. With the rapid development of micro processing, novel types of high-performance and portable spectrometers emerged, and the pursuit of pushing the performance to limit remains unsettled. Based on the signal transmission theory in multimode fiber, the intensity interference patterns are resulting from the mode interference effect were established in adiabatic and collimated model. In the experimental measurement, the tapered region with a slowly varying slope (about 0.01) was introduced near the end of the fiber to ensure that the side radiation signal could be collected. To estimate the number of modes supported in different structures, both the theoretical and numerical simulations are consistent with the experimental tendency. Using the confocal microscope system we made, the interference patterns are stored by continuous scanning a narrow-band laser. The calibration matrix corresponding to the device’s unique characteristics is obtained by region selection, vector splicing and singular value decomposition. The following wavelength detection process can be divided into two steps: the rough calibration matrix within the working bandwidth is obtained after the rough scanning of the wavelength in 1nm scale, and the wavelength units with the non-zero value are selected as the target after inner product correlation operation with the degraded one-dimensional signal intensity vector. This initial procedure provides the criterion of optimizing the structural parameters. On this basis, fine scanning is performed to obtain the refine calibration matrix. The three largest principal components are selected and defined as the final detected wavelength based on the minimum Euclidean distance. The inner product correlation operation combined with the principal component analysis can improve the wavelength detection resolution to 20 pm with the accuracy rate of 96.7%. The detection efficiency is fifty times higher than other nonlinear spectral reconstruction algorithms reported. The experimental results show that the working bandwidth is at least from 400 to 700 nm, and the device size is only π×(20 μm)2×0.5 mm. The practical feasibility and photon detection are also investigated, considering its further application. Compared with its counterparts, this device has a significant improvement in high performance, portability and low cost, it also integrates with an efficient algorithm in wavelength detection procedures. Both device and theory could be widely used in real-time wavelength detection of optical fiber transmission systems.
Nov. 01, 2021Vol. 41 Issue 11 3625 (2021)
Li MA, Xin-li FAN, Shuo ZHANG, Wei-feng WANG, and Gao-ming WEI
Accurate detection of CH4 is essential to prevent gas explosion and ensure safe production. However, the gas detection technology based on tunable diode laser absorption spectroscopy (TDLAS) has a large error due to temperature change. This paper explored the CH4 detection based on TDLAS technology and the temperature compensation method, analyzed the impact of temperature on CH4 absorption line, and finally eliminated the impact of environmental temperature on the CH4 detection through algorithm compensation model. This study used TDLAS technology’s principle and theory to design the transmitter unit, absorption cell, signal receiver unit and data processing unit. A CH4 detection system based on TDLAS technology was established, the concentration of CH4 at different ambient temperatures (10~50 ℃) was measured, and the effect of temperature change on the intensity and half width at half-maximum of CH4 absorption line at 1.653 μm was analyzed. In order to eliminate the influence of temperature on CH4 detection and improve the compensation effect, the particle swarm optimization (PSO) was employed to optimize the optimal weight and the threshold of back propagation neural network (BPNN). The PSO-BP temperature compensation model of CH4 was established, which overcame the characteristics of slow convergence rate and easy to fall into local optimum of the BPNN The result indicated that: (1) Based on TDLAS technology, the CH4 detection concentration dropped with the increasement of ambient temperature, the relative error range within the whole experimental temperature was 4.25%~12.13%. The relationship between CH4 detection concentration and temperature under different ambient temperatures can be expressed as a cubic polynomial; (2) The absorption intensity and half width at half-maximum of CH4 gas decrease with the increase of temperature relationship between it and temperature was a monotonous decreasing function. The relative change rate of temperature on the absorption line intensity of CH4 gas was greater than the half width. The absorption line intensity of CH4 gas was more susceptible to the temperature change; (3) The absolute mean error (MAE) of the BPNN and PSO-BP model test samples were 12.88% and 1.81%, the mean absolute percentage error (MAPE) were 2.3% and 0.3%, the root mean square (RMSE) were 15.96% and 2.69%, and the correlation coefficient R2 were 0.980 6 and 0.999 6, respectively. By establishing the PSO-BP temperature compensation model, the compensation effect was mostly distributed within the error range of ±1.0%, and MAE, MAPE, RMSE, R2 and another evaluation indexes were greatly improved. It has a certain reference significance to improve the accurate detection of CH4 in the mine with TDLAS technology.
Nov. 01, 2021Vol. 41 Issue 11 3632 (2021)
Li PING, Rong ZHAO, Bin YANG, Yang YANG, Xiao-long CHEN, and Ying WANG
Spectral extinction method is widely used in the field of Particle Size Distribution (PSD) measurement. During the inversion process of particle size by spectral extinction method, the speed and accuracy of the whole inversion process are greatly affected due to the problems of complex theory, complicated calculation, slow convergence speed and unstable solution of particle extinction coefficient. Moreover, in the extinction data of many wavelengths, there is more repeated redundant information, which also greatly increases the time of the inversion algorithm. Aiming at the problems of complicated calculation and low inversion efficiency of spectral extinction PSD inversion algorithm, a spectral PSD analysis method based on Principal Component Analysis (PCA) and Back Propagation (BP) neural network was proposed. Based on Mie scattering theory, the spectral extinction values under different particle sizes and wavelengths were simulated and calculated. Through the PCA of the spectral extinction data set and the calculation of the comprehensive load coefficient of each wavelength, the optimal characteristic wavelength was selected. The PCA-BP neural network model was trained by using the reduced spectral extinction data, and the PSD was calculated by using the network model. Through simulation calculation, the prediction accuracy of PCA-BP neural network model was compared with the traditional BP neural network model, and the influence of wavelengths number on the prediction results of the two neural network models was analyzed. Based on the trained PCA-BP neural network model, the verification experiment of spectral extinction inversion algorithm of PSD was carried out, and an experimental system for PSD measurement by spectral extinction method is established. Six types of standard polystyrene particles with different particle size parameters ranging from 0.5 to 9.7 μm were measured. Simulation and experimental results show that the correlation between each wavelength vector can be determined based on the PCA method, and the extinction value corresponding to the optimal characteristic wavelength can be selected by using the comprehensive load coefficient, which has good representativeness of the overall spectral data and can realize the dimensionality reduction of spectral data. Compared with the traditional BP neural network model, the analysis method of PSD based on the PCA-BP neural network model has higher prediction accuracy and has more obvious advantages for predicting distribution parameters of more dispersed particle systems. Moreover, when the number of selected wavelengths is small, the PCA-BP neural network model still has high prediction accuracy. The trained PCA-BP neural network model is used to verify the particle size parameters experimentally. The PSD prediction results can be output instantaneously, and the error is within 5%, which verifies the algorithm’s feasibility.
Nov. 01, 2021Vol. 41 Issue 11 3639 (2021)
Xiang-zhao LI, Guo-hui HOU, Zhi-fan HUANG, and Jun-jun XIAO
This paper investigates coherent conditions for smaller anti-Stokes Raman scattering imaging sample size than the system point spread function size and the reasons for depth around coherent anti-Stokes Raman scattering images using experimental design and analysis models. The axial transmission dynamic displacement light method, which subtracts axial light from the coherent volume element, is introduced to model and analyse lateral and axial dimensions for spherical or cylindrical samples with a smaller diameter than the system point spread function. The Gouy phase shift effect was approximately zero for small sample size and large refractive index. The main reason was the interaction between sample refractive index and the surrounding environment, and the system coherent tomographic volume element effective length. The obtained results apply only to CARS image analysis, where the sample size is smaller than the system point spread function, but it is also the first paper that clarifies the underlying reason for depth around CARS images using design experiments and quantitative model analysis. Successful nano-imaging analysis using axial transmission dynamic displacement light verified that the nano-action mechanism is similar to coherent action length, effective action length and its travel path.
Nov. 01, 2021Vol. 41 Issue 11 3648 (2021)
© Copyright 2018-2021 | Chinese Laser Press.
All Rights Reserved 沪ICP备15018463号-20