


 View fulltext
Fan DENG, Zhen-lin HU, Hao-hao CUI, Deng ZHANG, Yun TANG, Zhi-fang ZHAO, Qing-dong ZENG, and Lian-bo GUO
Laser-induced breakdown spectroscopy (LIBS), as a new material composition detection technology, has lots of advantages such as rapid, real-time, micro-damage, in-situ, multi-element analysis and so on. At present, it has been widely used in environmental monitoring, food safety, mineral processing and metallurgy, biomedicine, space exploration and other fields. However, due to the self-absorption, the spectral intensity is reduced. In severe cases, the line profile is even sunken in the centrum (“self-reversal”). The linear coefficient of calibration curve decreases, resulting in the deterioration of the accuracy of element detection, so that large-scale commercial applications cannot be realized. Therefore, the exploration of the self-absorption effect and its correction methods has always been the research hotspot. In this review, the progress of the correction method and the physical mechanism of self-absorption are reviewed. The main correction methods are summarized from the perspectives of experiment parameters optimization, physical assist device, self-absorption model and correction algorithm, respectively. The advantages and disadvantages of the primary correction methods are compared and analyzed. The experiment parameters optimization has the advantages of simple principle and operation. The effect of self-absorption reduction of laser stimulated absorption LIBS(LSA-LIBS) is stable. Microwave assisted excitation LIBS (MAE-LIBS) can reduce the self-absorption effect of multiple elements simultaneously and cost low. The self-absorption coefficient method can directly quantify the degree of self-absorption effect, has simple calculation steps and requires less plasma parameters. The self-absorption correction algorithm based on internal reference line has high calculation efficiency and obvious correction effect. Optically thin method can directly obtain optically thin spectral lines to avoid theoretical errors. Finally, the future research direction and development trend of self-absorption is prospected in our opinion.
Oct. 01, 2021Vol. 41 Issue 10 2989 (2021)
Hai-feng LIU, Zhen-yang MING, Ming-sheng WEN, Yan-qing CUI, Wei LIU, and Ming-fa YAO
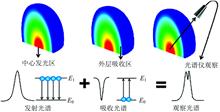
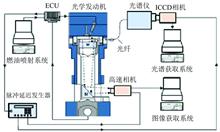
In this paper, the effect of fuel sensitivity (S) of 0 and 6 on the flame development and combustion luminescence spectrum in the engine cylinder are studied in an optical engine by using flame high-speed imaging technology and self-luminescence spectroscopy. The combustion model was transitioned from the new partially premixed combustion to diesel combustion mode by changing the injection timing (SOI= -25, -15, -5°CA ATDC), and the fuel sensitivity is changed by using n-heptane, iso-octane, ethanol mixed fuel. The results show that in the PPC model(-25°CA ATDC), the flame development process starts from the area near the wall and then develops toward the center of the combustion chamber and it is a similar flame propagation process, and a new unburned area is formed in the lower part of the combustion chamber. Sensitivity has a more significant impact on the combustion phase and less on the development history of the combustion flame in the cylinder. The high-sensitivity fuel suppresses when the OH and CH band spectra appear, and the spectral intensity is lower. With the change of fuel injection time, the spectral change trend of the two sensitive fuels is the same. The high-sensitivity fuel suppresses the high-temperature reaction process, weakens the soot radiation and reduces the spectral intensity. In the transition area between PPC and CDC (-15°CA ATDC), the combustion flame glows brighter than -25°CA ATDC, and the combustion reaction rate is faster than the reaction rate at -25°CA ATDC. The influence of high and low sensitivity fuels on the cylinder pressure heat release rate is similar to -25°CA ATDC. The combustion reaction is more intense, the heat release rate is high, and the soot appears earlier. The intensity of the spectrum at this time of fuel injection is higher than that in the PPC model, indicating that the CO oxidation reaction and soot radiation are stronger. In CDC mode, due to the low fuel activity used, the time of combustion heat release is too delayed, the heat release is small, and the combustion pressure in the cylinder is low, which is close to the misfire condition. Therefore, the effect of fuel sensitivity on cylinder pressure and heat release rate is not significant. The blue flame of low-sensitivity fuel first appears in the center of the combustion chamber at the beginning of the combustion, and the ignition flame appears earlier, and then the blue flame spreads from the center to the surroundings, showing a combustion process dominated by flame propagation. In the later stage of the combustion, the local mixed gas passes the dense zone causes the bright yellow flame area to increase and spread to the surroundings gradually. The flame development trend of high-sensitivity fuel is similar to that of low-sensitivity fuel, and the brightness and area of yellow flame are small. The appearance time of OH and CH band spectra of high-sensitivity and low-sensitivity fuels is similar, and the spectral intensity of high-sensitivity fuels is low. It may be because at the time of fuel injection, the flame retardation period is long enough, and the oxidation of ethanol in the susceptible fuel is the dominant factor. Comprehensive analysis shows that the flame development structure and spectrum development process are mainly affected by fuel injection time. The fuel sensitivity mainly affects the ignition time and flame self-luminescence spectrum intensity, and the spectrum intensity of low-sensitivity fuels is great.
Oct. 01, 2021Vol. 41 Issue 10 2999 (2021)
Kai-di YE, Min QIN, Wu FANG, Jun DUAN, Ke TANG, Fan-hao MENG, He-lu ZHANG, Pin-hua XIE, and Wen-bin XU
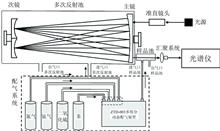
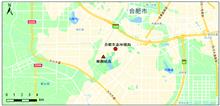
Substituents form BTX (benzene, toluene, xylene, etc) by replacing the H atom on the benzene ring. The unfixed π-bond electrons on the benzene ring of the common structure are stimulated, which makes BTX have a distinct characteristic absorption structure in the ultraviolet band of 240~280 nm. BTX in this atmosphere can be quantified by the differential optical absorption spectroscopy (DOAS) method. However, problems need to be taken into consideration when adopting the measurement of this band, such as the non-linear absorption of O2, cross interference between BTX due to the existence of similar absorption structures, and overlapping absorption interference of other gases. Benzene has a large absorption cross-section (2.417×10⁻¹⁷ cm2·molecule-1) in the deep ultraviolet band of 195~208 nm, which is about nine times the cross-section size (2.6×10⁻¹⁸ cm2·molecule-1) at 240~260 nm. Therefore, according to the characteristics of benzene in the deep ultraviolet 195~208 nm band, a portable differential optical absorption spectrum (DOAS) quantitative method is studied. This band is used to carry out the quantitative spectral analysis of benzene for the first time and applied to the actual field observation. The optimal retrieval band of benzene spectral quantification is obtained by establishing the two-dimensional correlation matrix of the differential absorption cross sections of benzene and the interfering gases SO2, NH3, CS2, and NO. Furthermore, the effect of retrieval of benzene in 195~208 nm band was evaluated by carrying out mixed gas experiments with different concentrations of benzene, SO2 and NH3 under laboratory conditions. The experimental results show that the detection limit of the spectral retrieval using the 195~208 nm band reaches 17.6 μg·m-3, the relative measurement error between the measured concentration of the spectral retrieval and the configured concentration is less than 5% and the relative standard deviation (RSD) is less than 3%. Compared with the retrieval results in the 240~260 nm band, the relative error is less than 5%. In the actual field condition, a portable differential optical absorption spectroscopy (DOAS) system was used to obtain the atmospheric measurement spectrum of 190~300 nm, and the DOAS method was applied to analyze and combine with the GPS information to obtain the pollution concentration distribution of benzene in a chemical industrial park. The experimental results show that the deep ultraviolet band of 195~208 nm can also be adapted to the quantitative analysis of benzene. And compared with the retrieval results of the 240~260 nm band, the correlation coefficient of the two retrieval bands has reached 0.98 and the relative error is less than 10%.
Oct. 01, 2021Vol. 41 Issue 10 3007 (2021)
Jin-ping OU, Hao-ran LIU, Peng-cheng ZHU, Heng XU, Zhuang WANG, Yuan TIAN, Guo-hua LIU, and Qi-hua LI
Aerosols directly disturbs the earth’s radiation budget and climate by absorbing and scattering solar radiation, indirectly affecting the formation of cloud condensation nuclei, and further changing the optical properties. A field study was carried out using an aethelometer and nephelometer from 5 November to 10 December 2019 in Hefei. Based on the meteorological data, diurnal variation and wind dependence of the optical properties of aerosols were analyzed. The average PM2.5, aerosol scattering coefficient (σsp), absorption coefficient (σap) in autumn in Hefei were (43±25) μg·m-3, (238.70±161.52) Mm-1, and (32.04±17.01) Mm-1, respectively, and the trend of time variation of σsp and σap was consistent with PM2.5. The contents of PM2.5, σsp, and σap have significant double-peak daily variation characteristics, peaking at 8:00—10:00 and 20:00—21:00, which was mainly related to traffic emissions and meteorological conditions.The wind dependence of aerosol optical properties in Hefei mainly reflects that the weather conditions of low temperature, high humidity and low wind are conducive to the accumulation and formation of pollutants, but the higher wind speed is also easy to transport pollutants around. The σap and σsp were mainly affected by the pollution air mass in the northwest wind direction. Based on the HYSPLIT backward trajectory model, the spatial characteristics of different transport pathways were analyzed by cluster analysis, and the potential source contribution method (PSCF) and concentration weight trajectory method (CWT) were used to investigate the potential source area distribution of Hefei. The results showed that the polluted air masses mainly originated from the northwest of Hefei. The highest proportion of air masses 1 and 3 were from Inner Mongolia Autonomous Region and Xinjiang Uygur Autonomous Region. Air mass 2, which contributes more to the scattering coefficient, comes from Baoji City, Shaanxi Province, and air mass 6, which originates from Inner Mongolia, passes through Shanxi, Shandong and Jiangsu Provinces, and arrives at Hefei from the southeast of Anhui Province, carrying more pollutants. PSCF larger value was mainly distributed in the northwest and southwest of Hefei. The high CWT values in autumn in Hefei were mainly distributed in northeast Henan Province, southwest Shandong Province and North Anhui Province. In particular, Jining city in Shandong Province and Shangqiu city in Henan Province are the potential sources of air quality in Hefei.
Oct. 01, 2021Vol. 41 Issue 10 3014 (2021)
Hong-wei LIU, and Liang FU
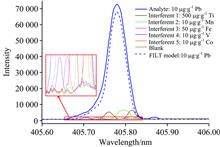
The spinel Li4Ti5O12 demonstrates high operating potential, excellent cycle life, and high safety as anode material of lithium-ion battery due to its negligible volume change, high thermal stability. The migration and deposition of metal impurities in Li4Ti5O12 are harmful degradation effects. In particular, magnetic metal impurities will cause the self-discharge and micro short circuit inside the battery, thereby affecting the safety performance and cycling life of the battery. A new method was proposed to determining the metal impurities in Li4Ti5O12 by microwave plasma atomic emission spectroscopy (MP-AES). The metal impurities of Mn, Na, Pb, Ni, Cr, Zn, K, Fe, Al, Mg, Cu, Ca, Co, and Cd was determined by MP-AES via dissolving the Li4Ti5O12 sample in aqua regia solution by microwave digestion without further filtration. The wavelengths of Mn 403.076 nm, Na 589.592 nm, Pb 405.781 nm, Ni 352.454 nm, Cr 425.433 nm, Zn 213.857 nm, K 766.491 nm, Fe 371.993 nm, Al 396.152 nm, Mg 285.213 nm, Cu 324.754 nm, Ca 393.366 nm, Co 340.512 nm, and Cd 228.802 nm was selected as the analytical line. Combined with the fast linear interference correction (FLIC) technology, the spectral interference and the background interference of all analytes was corrected. CsNO3 was added as an ionization suppression solution to correct the ionization interference caused by the easily ionized Li matrix. Y was used as the standard internal element to correct for signal intensity instability and matrix effects. The method detection limit (MDL) was 0.03~0.77 μg·g-1, the linear correlation coefficient was all greater than 0.999 3, the spiked recoveries were 96.4%~103%, and the relative standard deviations (RSDs) were less than 3.89%. The developed method was used to analyze the real sample and compared it with the national standard method (GB/T 30836—2014). Statistical analysis by the t-test method showed that at the 95% confidence level, there were no significant differences in most of the elements between the MP-AES and GB/T 30836—2014 methods, except for Zn, which further verifies the high accuracy of the method. Compared with inductively coupled plasma optical emission spectroscopy using argon as plasma gas, employing nitrogen as plasma gas can significantly reduce the operation cost. MP-AES has higher safety and better stability than atomic absorption spectroscopy using combustible gas. This method is simple to operate, low cost of analysis, high accuracy, and good precision. It provides a new method for the high-through put determination of multiple metal impurity elements in Li4Ti5O12.
Oct. 01, 2021Vol. 41 Issue 10 3021 (2021)
Jing WANG, Zhen CHEN, and Quan-zhou GAO
Laser particle size analysis integrated laser, photoelectric and computer technologies has recently become a mainstream method of grain size testing. As particles with different sizes produce scattered light at different angles to the incident laser, the particle size distribution of the sample can be calculated by measuring the intensity of scattered light at different angles. Because of simple operation, rapid test and high precision, it has an important application in sedimentology. A layer of “mottled clay” is widely developed between the Late Pleistocene and Holocene in Quaternary basins in the coastal areas of Guangdong and Fujian provinces. Current research attributes its origin to exposure weathering of Late Pleistocene marine/fluvial deposits during the last glacial maximum. However, our studies find that the mottled clay has no transition in color, structure and composition with its underlying layer and is therefore not formed from weathering. The mottled clay is silty, easily raised by the wind and similar to typical loess. In order to ascertain the character and origin of the mottled clay, three drill cores in the Pearl River delta area were chosen in this study with the method of laser grain size analysis. The results show that grain size composition is characterized by the modal grain size group of coarse silt(10~50 μm), followed by the group of clay grain (<5 μm), both of which are typical particle compositions of an aeolian deposit. All grain size parameters are in accordance with that of an aeolian deposit. Both particle size parameter scatter diagrams and index distribution range of the mottled clay are consistent with typical loess but different from the underlying deposits. The discriminant analysis exhibits an aeolian origin of the mottled clay. The phase analysis also shows that the mottled clay points coincide with the range of typical loess, but has no genetic correlation with its underlying deposits. It is concluded that the mottled clay is not a weathering product of its underlying sediments but an exotic aeolian deposit. This conclusion is of great scientific significance for reconstructing the paleoenvironment of the last glacial period in Fujian and Guangdong coastal areas in the future. The laser particle size method based on optical scattering provides effective scientific evidence for judging the sedimentary environment and origin of the sediments.
Oct. 01, 2021Vol. 41 Issue 10 3026 (2021)

Mei-feng GAO, and Huan-ming TAO
Aiming at the problem of near-infrared spectroscopy wavelength selection, an improved team progress algorithm (iTPA) is proposed based on the team progress algorithm (TPA). The bands of molecular spectrum are arranged in descending order according to the evaluation value function obtained by modeling corresponding physical and chemical values and are divided into elite group, plain group and garbage collection group. When the new wave band selects learning behavior, if it is generated in the plain group, it needs to adjust to the direction of the elite group template; if it is generated in the elite group, its updating direction needs to be improved to adjust to the reverse direction of garbage collection group template. Unlike the elite group and the plain group, members’ evaluation value of the garbage collection group is always in a deficient state, which provides an accurate update direction for the new band generated from the elite group during the learning procedure to improve the global optimization ability of the algorithm. Through continuous iterative updating, the overall evaluation value is gradually improved, and finally, the band with the highest evaluation value is selected as the screening band. The algorithm is tested on the data set of corn starch and protein content and compared with TPA, genetic algorithm (GA), principal component analysis (PCA) and complete spectrum method. The experimental results show that the proposed algorithm can find the optimal combination of wavelengths in the whole spectrum range and explain each component’s chemical characteristics. Compared with the full spectrum, for the corn starch data set, the number of variables of iTAP was decreased from 700 to 17.55 (averaged by 50 tests), RMSEC of the model was reduced from 0.335 7 to 0.260 9, and the prediction accuracy of the correction set was improved by 22.3%. The RMSEP of the model decreased from 0.391 4 to 0.334 4, and the prediction accuracy of the prediction set increased by 14.6%; For the corn protein dataset, the number of variables decreased from 700 to 19.6 (averaged by 50 tests), RMSEC of the model was reduced from 0.147 4 to 0.101 9, and the prediction accuracy of correction set was improved by 30.1%. The RMSEP of the model decreased from 0.178 9 to 0.117 7, and the prediction accuracy of the prediction set increased by 34.2%.
Oct. 01, 2021Vol. 41 Issue 10 3032 (2021)
Run-yu WANG, Da-ming DONG, Song YE, and Lei-zi JIAO
In addition to degrading into microplastics in the natural environment, plastic products will pollute the environment, but also produce volatile organic compounds, which also cause huge pollution and harm to the environment. Therefore, the measurement of plastic volatiles is particularly important. At present, traditional volatile measurement methods, such as environmental mass spectrometry and chromatography, have disadvantages such as complex measurement processes, high cost, and inability to measure in real time. Therefore, there is a lack of a fast and effective measurement method for plastic volatiles. In this study, Fourier Transform Infrared Spectrometer (FTIR Spectrometer) combined with White Cell was used to measure plastic volatiles. However, due to the limited sensitivity of extractive Fourier Transform Infrared Spectrometer, it is not easy to measure plastic volatiles. Therefore, in response to this problem, we try to improve the sensitivity of conventional Fourier transform infrared spectrometers through a long optical path gas cell to measure different types of plastic volatiles. In this research, we studied 5 kinds of plastic products, namely low density polyethylene (LDPE), high density polyethylene (HDPE), polyethylene (PE), polyethylene terephthalate (PET), Polypropylene (PP), through the White cell with an optical path length of 20 m combined with a Fourier transform infrared spectrometer to achieve the observation of some of the volatile spectral characteristics. It is observed from the experiment that all types of plastics have two spectral absorption bands. Obvious spectral characteristics at 800~850 and 1 050~1 150 cm-1 respectively. In addition to polyethylene terephthalate (PET), the other four plastic volatiles also have obvious spectral absorption bands at 2 800~3 000 cm-1. We further studied the volatiles produced by plastics under different temperature conditions. By analyzing the infrared spectra of the volatiles produced by plastics under different temperature conditions, we found that, except for low-density polyethylene (LDPE), the spectra differed significantly under the two temperature conditions. In addition, other types of plastic volatiles have relatively small differences in infrared spectra. This study proposes a new method for measuring plastic volatiles based on long optical path FTIR, which proves its effectiveness in measuring plastic volatiles. This method has the advantages of low measurement cost, continuous observation, real-time online, etc. Lays the foundation for continuous is online monitoring of plastic volatile emission flux.
Oct. 01, 2021Vol. 41 Issue 10 3039 (2021)
Jing ZHOU, Qing-qing ZHANG, Jin-guo JIANG, Qian NIE, and Zhong-chen BAI
The fresh, dried chestnut rose (CR) (Rosa roxburghii Tratt) and stored for several days wild CR pulp were analyzed by using the infrared spectral technology of Fourier transform infrared spectrometer (FTIR) at room temperature in this paper. To compare the spectral characteristics of fresh and dried CR pulp, we extracted their flavonoids by the ultrasonic-assisted solvent extraction (UASE) method and ultrasonic combined enzyme-assisted semi-bionic (UCES) method, respectively. Moreover, absolute ethanol was used to extract CR flavonoids in the UASE method for the extraction of CR flavonoids. And then Pepsin, tryps in and bile were used to simulate the environment of enzyme assisted gastrointestinal digestion for the extraction of Flavonoids from Rosa roxburghii Tratt. The Fresh pulp and Dried pulp were respectively reacted for 0, 0.5, 1, 1.5, 2 and 2.5 h in the two extraction methods. First of all, the infrared spectra data of fresh pulp and dried pulp were measured. Then, by comparing the optimal characteristic wavelength combination of the two methods for extracting CR flavonoids, we found that under the same reaction conditions, when the reaction time is at 1.5 h, the transmittance intensities of the infrared spectrum from the fresh CR and the dried CR in the UASE method were 83.5% and 84%, respectively; in the UCES method, their transmittance intensities were 32% and 38%, respectively. Therefore, combined with Lambert-Beer’s law, when the reaction time was the same, the UCES method was superior to the UASE method for extracting CR flavonoids. Besides, with the increase of reaction time, the infrared absorption peak intensity of the two extraction methods showed an upward trend. After being reacted for 2 h, the absorption peak was gradually stable. The results showed that the infrared absorption peaks at 3 419 cm-1 (hydroxyl group O—H stretching vibration), 1 615 cm-1 (Carbonyl C=O bond stretching vibration) and 1 053 cm-1 (alkyl group) of the CR flavonoids could be distinguished. The infrared absorption peaks of flavonoids in fresh pulp and stored at room temperature for several days were consistent with that of quercet in and kaempferol. Under the same experimental conditions, the flavonoids concentration of dried CR was higher than that of fresh CR pulp. This research can provide references for identifying the production of functional medicines and foods of chestnut rose.
Oct. 01, 2021Vol. 41 Issue 10 3045 (2021)
Yu-hui ZHAO, Peng-cheng LU, Yu-bo LUO, and Peng SHAN
With the advantages of high efficiency, non-destructive and environmental protection, NIR is widely used in many fields to rapidly analyse substances. However, it is still faced with the problems of the short life cycle of spectral calibration model and difficulty obtaining and preserving standard samples for instrument calibration transfer method. In the stoichiometric literature, transfer methods usually correct the spectral differences between master and slave instruments. Most methods need to measure a set of transfer standard samples under the same conditions of two instruments. Although the number of samples does not need to be too much, generally speaking, it must be well selected to ensure a successful transfer. The Kennard-Stone algorithm is the main algorithm for selecting representative sample subset in the master-slave instrument. In determining the standard sample, it is assumed that the master instrument has found the standard sample, and the selected sample set needs to be measured in the slave instrument. It is only possible when the transferred sample is sufficiently stable, but this cannot be guaranteed in the near-infrared spectroscopy technology. If it is assumed that the sample of the slave instrument is used as the standard sample, the master instrument is replaced by the slave instrument in consideration of the change of the spectrum light source in the new industrial application, so it is no longer available. Based on these problems, this paper proposes a method of minimizing mean distribution discrepancy calibration transfer for NIR (MCT), without considering the standard sample (standard-free) of the slave instrument, due to the multicollinearity of NIR spectroscopy data, this method first assumes that there is a subspace of the partial least squares of the master-slave instrument, and then the spectral data of the master-slave instrument are projected to the common subspace respectively; then, the mean distribution discrepancy minimization algorithm is introduced, that is, the mean distribution (center point) representation function of the master-slave spectral data in the subspace is given Function to minimize the discrepancy between the mean distribution (center point) of the two spectra, and maximize the covariance of the main instrument spectrum after projection to derive the optimal subspace; finally, the main spectrum samples and the secondary spectrum prediction samples are projected into the partial least squares subspace respectively, and the regression model is obtained by using the main spectral data, and the modified model can be used to predict the secondary spectral concentration. Through the test and research on the corn data set and the wheat data set, it is proved that the prediction effect of this method is improved compared with SBC, PDS, CCACT, TCR and MSC. The experiment shows that MCT can achieve a lower prediction value.
Oct. 01, 2021Vol. 41 Issue 10 3051 (2021)
Shu-xiang FAN, Qing-yan WANG, Yu-sen YANG, Jiang-bo LI, Chi ZHANG, Xi TIAN, and Wen-qian HUANG
A handheld portable device for fruit sugar content was developed based on visible/near-infrared spectral analysis. The device consists of a micro-spectrometer, halogen lamps, OLED screen and microcontroller. The real-time analysis and control software of the microcontroller was written in C language with the help of the Keil 5 development tool. Combined with the spectrum acquisition program written by LabView, the spectra of fruit samples were collected by the developed device. Apples and big peaches were used to explore the detection accuracy of the device and the transfer of the model between two devices (master and slave). The visible-near infrared spectra of the apple and peach were collected in the spectral range of 600~950 nm under laboratory conditions and in the field. The spectral data of calibration set collected by the master device under laboratory conditions were preprocessed by smoothing, maximum normalization, second derivative and other preprocessing methods, followed by the sugar content models developed using partial least squares algorithm for apples and peaches respectively. The models were then imported to the custom software, making it possible for the master device to predict the sugar content of apples or peaches directly. The correlation coefficient and the root mean square error of the prediction set were 0.925, 0.587% and 0.821, 0.613% for apples and peaches, respectively. The models were transferred from the master device to the slave device by using the piecewise direct standardization (PDS) and canonical Correlation Analysis (CCA) algorithm. After comparison, it was found that better model transfer results were achieved based on the CCA algorithm. The correlation coefficient and root mean square error of the prediction set were 0.883, 0.641% and 0.805, 0.626% for apples and peaches, respectively. The model established under laboratory conditions was used to analyze the fruit spectral data collected on the tree, the correlation coefficient and root mean square error of the prediction set were 0.866, 0.741% and 0.816, 0.627% for apples and peaches, respectively. The results showed that the developed device had considerable potential to detect fruit sugar content under lab conditions, and in the field. With the help of the model transfer algorithm, the model can be shared and effectively transferred between different devices. The developed device could meet the demand for rapid, non-destructive, and on-site detection of internal fruit quality.
Oct. 01, 2021Vol. 41 Issue 10 3058 (2021)
Fu ZHANG, Xia-hua CUI, Ya-kun ZHANG, and Yong-xian WANG
It takes more time and energy for eggs to hatch, but the circumstances of hatching egg embryo growth are less than 100%. The early discrimination of hatching eggs can reduce the economic loss and improve the efficiency. The near-infrared spectral analysis technology used in detecting the early fertilization information of hatching eggs because of speed and harmless. However, the existing detection method can not meet the requirement of detecting position. The necessitated problem is to build the relationship between the detecting position and the internal information. The visible/near-infrared spectroscopy detection system was used to collect the diffuse reflectance spectrum intensity of eggshell. 181 fresh eggs with similar shell color and no surface cracks were selected for analysis, and 61 samples were randomly selected for cross-validation. In order to eliminate the influence of dark current, the diffuse reflectance of eggshell was obtained by spectral correction. It was found that the trend of the spectral curve of fertile egg and the infertile egg was the same, and the spectral curves of position 3 and 4 were higher than position 1 and 2. The effective spectral bands of 440.27~874.6 nm were selected for the study. SGolay smoothing, second derivative, SNV, normalize and MSC pretreatment method were used to construct the PCA-SVM discrimination model. Then the data after 24, 48, 72, 96 and 120 h was collected at different positions. The results showed that the accuracy of derivative was as same as the accuracy of MSC, which indicated that the two pretreatment methods were not sensitive to the change of position through the analysis of data and ertilization information. The accuracy of the validation set was fluctuated in a certain range, and the accuracy rate after 120 h was 91.71% when the pretreatment methods of Normalize and SGolay were used to reduce noise. The accuracy rate of SNV pretreatment at the equator showed an upward trend with time, and it was sensitive to the time and position. The longer the embryo development, the better the discrimination effect. The best discrimination accuracy rate was 91.16% at the equator after 120 h. Moreover, smoothing, SNV and normalize have the highest discrimination accuracy at equator, which was mainly because the equator’s surface is flat and more information was collected. This study provides a new idea and method for the early identification of the data acquisition position.
Oct. 01, 2021Vol. 41 Issue 10 3064 (2021)
De-fang LUO, Jie PENG, Chun-hui FENG, Wei-yang LIU, Wen-jun JI, and Nan WANG
Soil organic matter is the material basis of soil fertility, and its fraction is an important indicator to evaluate soil fertility. Soil organic matter fractions can be divided into humin (HM), humic acid (HA) and fulvic acid (FA) according to their solubility. The fertility characteristics of different fractions are significantly different. Therefore, the data of soil organic matter fractions can reflect the status of soil fertility more comprehensively and objectively. The traditional determination of soil organic matter and its fractions is complex, inefficient and time-effective. Many studies show that hyperspectral technology can effectively improve the detection efficiency of soil properties and reduce the testing cost, but the reports on the detection of soil organic matter fractions by visible-near infrared and mid infrared spectroscopy are rare. 93 soil samples were collected and analyzed to acquire the content and spectral information of SOC, HM, HA in Aksu and Hetian, southern Xinjiang, and to explore further the feasibility of mid-infrared spectroscopy and visible near infrared-mid infrared combined spectroscopy in detecting soil organic matter fractions and to comparing the prediction accuracy of a single spectral model for organic matter with that of a combined spectral model for different soil organic matter fractions. Secondly, three kinds of spectral data sets of visible near-infrared (VNIR), mid-infrared (MIR) and their combined spectra (VNIR-MIR) were used to analyze and predict the contents of soil organic matter, HM, HA and FA by using three modeling methods of partial least squares (PLSR), support vector machine (SVM) and random forest (RF). The results show that: (1) soil organic matter and its fractions had a good correlation with spectral reflectance, and the number of characteristic bands of soil organic matter and its fractions in Mir was significantly more than that in VNIR. (2) The optimal prediction model of organic matter is VNIR-MIR-RF with R2 of 0.90; the optimal prediction model of HM and HA is VNIR-RF model with R2 of 0.92; the optimal prediction model of FA is VNIR-RF model with R2 of 0.94. (3) The prediction accuracy of the organic matter combination spectral model based on HM, HA and FA is significantly higher than that of the single spectral model. The R2 of the two models is 0.93 and 0.90, respectively. The results of this study realized the efficient and rapid inversion of soil organic matter fractions, and the combined model based on organic matter fractions improved the prediction accuracy of soil organic matter and provided important reference value for large-scale soil fertility identification and precision fertilization in southern Xinjiang.
Oct. 01, 2021Vol. 41 Issue 10 3069 (2021)
Han YANG, Jian-fei CAO, Zhao-hai WANG, and Quan-yuan WU
Rapid and accurate monitoring of soil salinity in the coastal regions are of great significance to the rational use and protection of land. Visible-near infrared spectroscopy has been widely used for the efficient estimation of soil properties. However, the interference of soil moisture on the spectrum decreases the estimation accuracy of traditional soil salinity estimation models. This paper aimed to explore the capacity of piecewise direct standardization (PDS) and orthogonal signal correction (OSC) in estimating the soil salt content under the condition of moisture interferedand establishing “moisture resistance” Vis-NIR models in the coastal saline regions. To this end, 114 soil samples were collected from the Yellow River Delta (0~20 cm) and divided the data into a modeling dataset (17 samples) and a validation dataset (127 samples). A control rewetting process obtained the soil spectral of the modeling dataset with 10 moisture content levels (0%,1%, 5%, 10%, 15%, 20%, 25%, 30%, 40% and 50%). The soil spectral of the validation dataset was measured after a fully randomized trial, according to the generated 1~50 random integer. The modeling strategy combining PDS and OSC with partial least squares regression (PLSR) was proposed to build soil salinity estimation models. These models were validated and compared. Results showed that OSC was more effective than PDS in reducing modeling interference of moisture content in soil salinity estimation. Specifically, all of the PLSR models generated before and after spectral correction have achieved a certain level of success in soil salinity estimation ($R^{2}_{p}$=0.79~0.91, RMSEP=2.6~3.98 g·kg-1, RPD=1.98~2.37). Compared with PLSR ($R^{2}_{p}$=0.86, RMSEP=3.02 g·kg-1, RPD=2.21), OSC-PLSR could effectively improve the soil salinity estimation accuracy with $R^{2}_{p}$=0.91, RMSEP=2.6 g·kg-1, RPD=2.37, respectively. However, the PDS-PLSR model was not effective with $R^{2}_{p}$=0.79, RMSEP=3.98 g·kg-1 and RPD=1.98, respectively. The representation order of the model was OSC-PLSR>PLSR>PDS-PLSR. Furthermore, the analysis strategy of the variable importance in the projection (VIP) combined with Spearman correlation coefficients (r) were used for exploring the estimative mechanism. The important wavelengths (VIP>1) of the models overlap with the sensitive wavelengths (|r|>0.4), which is of great significance for the soil salinity estimation. In comparison, OSC-PLSR accurately refines the wavelengths near 830, 1 940 and 2 050 nm that are important to the estimation model, while general PLSR and PDS-PLSR contain much redundant information. Overall, the OSC-PLSR model has strong moisture resistance in Vis-NIR soil salinity estimation, which provides feasibility for soil salinity study under soil moisture.
Oct. 01, 2021Vol. 41 Issue 10 3077 (2021)
Jing-xuan WU, Jie LI, Jia-wei LIN, Shi-wen YI, Min LI, and Wen-rou SU
At present, methods of separating from low-grade barite ore are usually adopted to improve the grade of barite in flotation by using new flotation reagents, and the recovery of flotation can be improved by microwave pretreatment of the mineral before flotation, but the mechanism of microwave on flotation reagents and minerals are not yet known. In recent years, microwave heating technology has been used in mineral processing, metallurgy and material preparation and so on, with the advantage of fast reaction speed and high product index. In this paper, sodium oleate was used as a collector in the flotation tests of the pure barite mineral after microwave pretreatment, and the infrared spectrum detection was carried out for the barite flotation samples under different microwave heating times. The effect mechanism of microwave on barite flotation was discussed by the infrared spectral analysis of fitting smooth spectrum and second derivative spectrum. The flotation test results showed that the barite without microwave pretreatment had the best flotation index and recovery of 91.41% under the conditions of sodium oleate dosage of 55 mg·L-1 and pH value of 8.0. In contrast, the flotation index of barite treated with microwave increased gradually with the increase of microwave treatment time, and the recovery rate of barite treated with microwave in the 60 s was the highest, reaching 95.27%. Infrared spectrum analysis based on flotation test showed that in the flotation of barite without microwave pretreatment interacted with sodium oleate, the red shift of —CH2— symmetric stretching vibration peak at wavenumber 3 004 cm-1, —CH3 antisymmetric stretching vibration peak at wavenumber 2 953 cm-1, $SO^{2}_{4}$asymmetric stretching vibration peak at wavenumber 1 119 and 1 077 cm-1 were all found, indicating chemical adsorption of sodium oleate on the surface of barite was happened; By contrast, in the flotation of barite after microwave pretreatment interacted with sodium oleate, the red shift of —CH2— symmetric stretching vibration peak at wavenumber 2 853 cm-1, —CH2— symmetric stretching vibration peak at wavenumber 2 923 cm-1, —CH3 antisymmetric stretching vibration peak at wavenumber 2 958 cm-1, $SO^{2}_{4}$ asymmetric stretching vibration peak at wavenumber 1 181, 1 122 and 1 086 cm-1, $SO^{2}_{4}$ symmetric stretching vibration peak at wavenumber 982 cm-1, $SO^{2}_{4}$ bending vibration peak at wavenumber 635 and 610 cm-1 were not found, but the peak strength increased significantly with the microwave heating time, and the peak strength increased most significantly with the microwave heating time of 60 s. The fitting smoothing spectrum and the second derivative spectrum calculations of the infrared spectrum after microwave pretreatment showed that the peak area at wavenumber 2 958, 2 923, 2 853, 1 181, 1 122, 1 086, 982, 635 and 610 cm-1 increased to different degrees, and under microwave heating 60 s, the peak area respectively increased by 1.84%, 259.12%, 761.15%, 235.72%, 145.61%, 198.50%, 641.16%, 549.67% and 744.97%. It indicates that microwave pretreatment does not induce a chemical reaction on the barite surface, but strengthens the chemical adsorption between sodium oleate collector and barite ore, make the chemical adsorption on the barite surface denser, and the adsorption quantity increased, so the barite recovery increases and the flotation index improves.
Oct. 01, 2021Vol. 41 Issue 10 3083 (2021)
Di SUN, Meng-ting LI, Mei-rui MU, Run ZHAO, and Ke-qiang ZHANG
Rapid and accurate determination of the nitrogen (N) and phosphorus (P) in the slurry/biogas slurry has been a technical bottleneck is urgently needed for the large-scale dairy farms in China on their ways of planting and breeding combination. Conventional wet chemical measuring methods in the laboratory were difficult to meet the practical demand of rapid quantitative determination on the N and P before recycling the dairy farm slurry back to the field. An indigenized rapid detection method of N and P through the full chain of slurry movement in large-scale dairy farms was developed based on the near-infrared (NIR), mid-infrared (MIR) and near-mid infrared (NIR-MIR) spectral fusion technology. A total of 144 slurry samples were collected along with the entire process links (manure collecting gutter, slurry tank, lagoon, etc.) from 27 large-scale dairy farms in Tianjin. The spectral data of 12 000~4 000 and 4 000~650 cm-1 were collected by the Fourier transform near-infrared spectrometer (FT-NIRS) and mid-infrared spectrometer (FT-MIRS). Pretreatment methods involved the normalization, baseline and SNV were performed on the whole NIR, MIR and NIR-MIR data.NIR and MIR spectral characteristics were analyzed. The concentration gradient method was used for the sample diversity. NIR and MIR models of the total nitrogen (TN) and total phosphorus (TP) in the slurry were constructed by the partial least squares (PLS), interval partial least squares (IPLS) and synergy interval partial least squares (SIPLS). The results of slurry TN models were preferable, while the optimal models between the NIR and MIR were equivalent. The prediction performance of the TP model for the slurry was unsatisfactory that difficult of practical application. The $R^{2}_{pred}$ of the optimal SIPLS models for NIR and MIR were only 0.790 and 0.631, respectively. The residual predictive deviation (RPD) was 2.213 and 1.479 respectively. And the ratio of performance to interquartile range (RPIQ) was 3.616 and 2.351, respectively. In order to realize the simultaneous and effective determination and analysis of the N and P in the slurry meanwhile further improve the overall prediction performance of the model, the NIR-MIR fusion model of the N and P in the slurry was established integrated the NIR with MIR spectral data, with the spectral range of 12 000~650 cm-1. The prediction performance behaved well overall. IPLS fusion model performed the optimum. The $R^{2}_{pred}$ was 0.970 and 0.861 respectively. RPD was 5.615 and 2.684 respectively. RPIQ was 12.874 and 4.394 respectively. It was better than the single NIR model and MIR model. In particular, the optimal fusion model of the TP was 0.071 and 0.170 which was higher than that of the single NIR and MIR models. The results showed that exact and rapid determination of the N and P through the full chain links of slurry movement in large-scale dairy farms via the near-mid infrared spectroscopy fusion technology could be available for the scientific slurry recycling to the farmland.
Oct. 01, 2021Vol. 41 Issue 10 3092 (2021)
Nian TANG, Shu-kai HE, Xiao-zhe ZENG, Huan-xin WANG, Dong-wei SUN, Qian-qian WU, and Jing-wei LI
The search for alternative new environmentally insulating gases has become a research hotspot in the fields of chemistry and electrical science since the widespread application of sulfur hexafluoride gas in the power field has brought about increasingly severe environmental pollution. Trans-1,1,1,4,4,4-hexafluoro-2-butene [HFO-1336mzz(E)] gas has been attracted extensive attention at home and abroad due to its excellent environmental characteristics and high dielectric strength. It is necessary to study its spectral absorption characteristics and corresponding detection technology. In this paper, an experimental platform was established, composed of a multi-reflection long optical path cell whose pressure and temperature are adjustable, Fourier transform infrared spectrophotometer (FTIR) and vacuum pumps. Firstly, IR absorption characteristics of HFO-1336mzz(E) in 1 100~1 350 cm-1 were studied through FTIR experiments and Gaussian simulations at the pressure of 101 kPa and the temperature of 298 K, and the spectral cross-interference analysis of the possible co-existing gases such as CO2 and H2O was carried out. The effect of the pressure and temperature of HFO-1336mzz(E) gas on its infrared absorption characteristics was systematically performed. Based on NDIR technology, HFO-1336mzz(E) gas detection of low concentration leakage or high concentration mixing ratio was simulated. From the tested IR absorption spectrum of HFO-1336mzz(E), it can be seen that 1 152, 1 267 and 1 333 cm-1 are the central wave numbers of the three strong absorption spectra, which is basically in agreement with the simulated IR spectra. When the concentration of HFO-1336mzz(E) is high, the cross-interference of spectral lines of CO2 and H2O can be ignored, because the absorption intensity of CO2 in dry air at 1 333 cm-1 is as low as 10-6 and the integrated influence factor of the peak area of H2O is about 1.44×10⁻³ in filter bandwidth of 150 nm. However, humidity compensation is needed when the leakage concentration of HFO-1336mzz(E) is deficient. So, it is feasible to choose the absorption line of 1 333 or 1 267 cm-1 to realize the detection of low or high concentrations of HFO-1336mzz(E) using NDIR technology. The pressure measured results show that the spectral absorption coefficient of HFO-1336mzz(E) increases with increasing pressure, and its change rates at 1 333 and 1 267 cm-1 with pressure are respectively 0.273 and 0.118 cm-1·kPa-1. However, the width of spectral bands broadens with increasing pressure. The temperature tested results reveal that the peak absorption coefficient of HFO-1336mzz(E) decreases and the width of spectral bands becomes narrow with the increase of temperature, but the change rate of absorption coefficient at different wave numbers is quite different, where the change rates of absorption coefficient at 1 333 and 1 267 cm-1 are respectively -0.105 6 and -0.035 cm-1·K-1. The sensor simulation results indicate that a 5 cm optical path at 1 333 cm-1 measure a trace leakage of 0~1 800 μL·L-1, and a 2 mm optical path at 1 267 cm-1 a high concentration of 0~10% of HFO-1336mzz(E). This research provides an experimental and theoretical basis for developing optical gas sensors based on the principle of infrared spectrum absorption.
Oct. 01, 2021Vol. 41 Issue 10 3099 (2021)
Liu-fang NI, Jing YU, Xin-ping WANG, Jun WANG, Xiao-xia CAO, Shi-lin CAO, and Xiao-juan MA
In this study, attenuated total reflection spectroscopy (ATR-IR) was used to analyze the influence of NaOH on the hydrogen bonding network of H2O and 1-ethyl-3-methylimidazolium acetate ionic liquid aqueous solution (EmimAc/H2O). The results showed that the addition of NaOH affected the symmetry and type of hydrogen bond of water aqueous solution. The symmetric hydrogen bond bands Ⅰ (3 218 cm-1) and Ⅱ (3 375 cm-1) decreased with NaOH concentration. The hydrogen bonds of the water were polarized in the presence of NaOH, thus producing continuous absorption bands; moreover, the absorptions of the continuous bands were enhanced with increasing NaOH concentration. In the case of the EmimAc, water affects both the cation and anion. The OH of H2O interacts strongly with COO- of EmimAc and generates a wide absorption band between 3 400 and 3 200 cm-1, while the interaction of proton on H2O and COO- makes the C=O absorption band red-shift. H2O addition could cause a blue shift or a decrease of the absorption between the band 1 600~1 200 cm-1, which is referred that water could damage the original hydrogen bond network of EmimAc and form “anion···HOH···anion” and weaken the interaction between cation and anion of ionic liquid. When water was substituted by NaOH and mixed with EmimAc, the absorption strengthened. It is probably that destruction of the EmimAc hydrogen bond network by NaOH aqueous solution is not as significant as water. In summary, the EmimAc/NaOH system can be used to reduce the viscosity of the ionic liquid system and the application cost of EmimAc, which has a specific guiding significance for the pretreatment of lignocellulosic biomass.
Oct. 01, 2021Vol. 41 Issue 10 3106 (2021)
Shun-kuan WAN, Bo LÜ, Hong-ming ZHANG, Liang HE, Jia FU, Hua-jian JI, Fu-di WANG, Bin BIN, and Yi-chao LI
Portable near-infrared (NIR) spectrometer for quick on-site measurement is an important trend in the study field of NIR spectroscopy. However, in order to achieve quick measurement, a portable NIR spectrometer is generally not equipped with temperature-controlled device. Therefore, the change in ambient temperature will bring a relatively large measurement error to the predicted results. Reducing the error caused by the changes in ambient temperature is an important problem that has to be solved before the large-scale application of portable near-infrared spectrometer in the field of quick on-site measurement. The condensation points of diesel is an important parameter to evaluate diesel quality and temperature range for diesel application. Development of the on-site quick measurement of condensation point can effectively reduce the cost of traditional measurement. In the present study, the NIR spectra are collected by a portable spectrometer in the wavelength range of 950~1 650 nm for 50 kinds of diesel samples with different condensation points. The effect of changes in ambient temperature on the quantitative analysis results is studied using one new type of NIR spectrometer. This type of spectrometer is a portable spectrometer designed based on a digital micromirror device(DMD), which is developed for quick on-site measurement without temperature-controlled device sample cell. Firstly, the predicting model is developed for condensation point under the condition of ambient temperature at T0=25 ℃, using based on the partial least square method. Then, the spectra measured under other ambient temperatures (TE=-10, 0, 10, 20, 30, 40 and 50 ℃) are introduced into this model to predict the condensation point, and the relationship between prediction error and changes in ambient temperature (TE-T0) is studied. The linear function fitted the relationship between prediction error and ambient temperature. It is found that the average value of condensation point prediction error is Δc=-0.019 8(TE-T0). The compensation factor of environmental temperature is brought into the prediction model developed under 25 ℃, and a temperature compensation model for the change in ambient temperature is established to predict the condensation point of diesel with NIR spectra collected under other conditions ambient temperature. The root means square error (RMSE) of condensation point prediction at 10 ℃ is improved from 14.6 to 8.8, and the coefficient of determination increased from 0.4 to 0.7. The study shows that the temperature compensation model can effectively reduce the error caused by ambient temperature. This method can improve the time cost for developingthe model and extend the temperature range in applying a portable NIR spectrometer.
Oct. 01, 2021Vol. 41 Issue 10 3111 (2021)
Yu-hua QIN, Meng ZHANG, Ning YANG, and Qiu-fu SHAN
Aiming at the curse of dimensionality problem in measuring spectral similarity caused by the high dimensionality, high redundancy, non-linearity and small samples of the near-infrared spectrum, a local preserving projection algorithm based on kernel mapping and rank-order distance (KRLPP) is proposed in this paper. First, the spectral data is mapped to a higher-dimensional space through a kernel transformation, which effectively ensures the manifold structure’s nonlinear characteristics. Then, the dimensionality of the data is reduced by the locality preserving projections (LPP) algorithm, the rank-order distance is introduced instead of the traditional Euclidean distance or geodesic distance, and a more accurate local neighborhood relationship can be obtained by sharing the information of neighboring points. Finally, the measurement of the spectrum is realized by calculating the distance in low-dimensional space. This method solves the problem of distance failure in high-dimensional space and improves the accuracy of similarity measurement results. In order to verify the effectiveness of the KRLPP algorithm, firstly, the best parameters including the number k of the nearest neighbors and the dimensionality d of the reduced space were determined according to the residuals variation of the dataset before and after dimension reduction. Secondly, it compared with PCA, LPP, and INLPP algorithms from the perspectives of the projection effect of the spectra dimension reduction and the model classification ability. The results show that the KRLPP algorithm has a better ability to distinguish tobacco positions, and the effects of dimension reduction and correct identification of different tobacco positions are significantly better than PCA, LPP and INLPP methods. Finally, five representative tobacco were selected as target tobacco from a certain brand of cigarette formula. At the same time, PCA, LPP and KRLPP methods were used to find similar tobacco for each target tobacco from 300 tobacco samples used for formula maintenance, and the tobacco and cigarette formulas before and after replacement were evaluated from the aspects of chemical composition and sensory. Among them, the parameter selection of LPP and KRLPP for dimensionality reduction is consistent, and 6 principal components were selected for PCA. The results showed that, compared with PCA and LPP methods, the chemical components of total sugar, reducing sugar, total nicotine, total nitrogen and sensory indexes such as aroma, smoke and taste of the replacement tobacco and the replacement formula selected by the KRLPP algorithm had the least difference, and the accuracy of similarity measurement was the highest. This method can be applied to search for alternative raw materials for formula products and assist enterprises in maintaining product quality.
Oct. 01, 2021Vol. 41 Issue 10 3117 (2021)
Chen-yang LIU, Huang-rong XU, Feng DUAN, Tai-sheng WANG, Zhen-wu LU, and Wei-xing YU
Rabbit liver VX2 tumor is a tumor model that can grow rapidly in various organs, such as liver, lung, rectum, etc., and is often used in tumor research. In this paper, using high-near-infrared spectrum technology to four rabbits VX2 liver tumor and normal tissue in vivo and in vitro reflection spectrum detection, then respectively the Two categories based on support vector machine (normal liver tissue and liver VX2 tumor tissue) and Four categories (not bleeding living normal liver tissue, not living liver VX2 tumor tissue bleeding, bleeding in vitro normal liver tissue and hemorrhage in vitro liver VX2 tumor tissue). According to its spectral reflection curve characteristics, the data in the range of 400~1 800 nm are selected as characteristic variables. In order to further improve the classification accuracy, the kernel parameter g and penalty factor c of the support vector machine was optimized by using a 50 fold cross-validation and genetic algorithm, respectively. The optimization parameters and classification results of the 50-fold cross-validation are as follows: penalty parameter c of the dichotomy optimization is 4, kernel parameter g is 0.125 0, and the accuracy of the correction set and prediction set reaches 100%. The optimized parameters c and g are 8 and 0.121 1, and the accuracy of the correction set and the prediction set are 99.242 4% and 93.33 3%, respectively. The optimized parameters and results of the genetic algorithm are as follows: the optimized parameters c and g in dichotomy are 0.845 6 and 0.062 5, respectively, and the accuracy of Two categories, the correction set and the prediction set, is agreed to reach 100%.The optimized parameter C in the Four categories was 5.530 7 and g was 0.068 5, and the accuracy of the correction set and the prediction set reached 99.242 4% and 100%, respectively. The results show that the two optimization methods have achieved good results, and the genetic algorithm is more accurate in the classification of the Four categories. In order to further improve the speed of the algorithm, the method of variable selection at intervals was adopted to reduce the characteristic variables continuously. Finally, a variable was selected for every 100 nm spectral segment, and a total of 14 spectral segments were selected as the characteristic variables. Parameters of support vector machine were optimized by using genetic algorithm for the classification was studied, the results show that the Two categories and Four categories of both results of the calibration set and prediction set were 99.242 4%, and the running time of 11.4 s and 20.0 s respectively, and choosing all band running time: 340.3 s and 491.0 s compared to how spectroscopy can be in the identification of hepatic VX2 tumor tissue and normal liver tissue. The classification accuracy rate can reach more than 99%, and the running time shorten a lot. Therefore, it also lays a foundation for realising rapid real-time online detection and classification of tumor tissues in the future clinical tumor diagnosis with multi-spectrum technology, showing great application potential.
Oct. 01, 2021Vol. 41 Issue 10 3123 (2021)
Ying-qiang ZHANG, Shui-qin ZHANG, Li-yan WANG, Liang YUAN, Yan-ting LI, Qi-zhong XIONG, Zhi-an LIN, and Bing-qiang ZHAO
As the main nitrogen fertilizer in China, urea shows high activity. After hydrolysis in soil, urea is easily lost through volatilization and leaching, resulting in a low urea utilization efficiency, a waste of nutrient resources, and environmental pollution. Using organic acids to modify urea can delay urea decomposition, enhance urea use efficiency. However, the combination and enhancement mechanism is unclear. In this study, two low-molecular-weight organic acids, citric acid and salicylic acid, were selected as additives and added to molten urea to obtain urea containing citric acid (CAU) and urea containing salicylic acid (SAU). The combination of these two organic acids and urea was characterized by using Fourier transform infrared spectroscopy (FTIR), X-ray photoelectron spectroscopy (XPS), liquid chromatography-mass spectrometry (LC-MS) and other analytical technologies. The results showed that after the combination of citric acid and salicylic acid with urea, there was an enhanced primary amine vibrational peak at 3 348 cm-1 of FTIR spectra, indicating the reaction happened on the primary amine of urea. The new carbon structure (—CX) and nitrogen structure (—NX) was separated from the XPS C(1s) spectra and the N(1s) spectra, respectively. These new structures led to the decrease of the carboxyl group in citric/salicylic acid and amide group of urea. In addition, the C—OH chemical bond breakage happened in the XPS O(1s) spectra. The above indicated a new substance formed through the reaction of the carboxyl group in citric/salicylic acid and the amide group of urea to form a new substance. LC-MS analysis showed that the dehydration reaction happened between the carboxyl group of citric acid/salicylic acid and the amide group of urea, and that the new substance was structured with O=C—NH—C(O)—NH2 will be produced in CAU or SAU. Therefore, the results from the spectral analysis and other analytical technologies used in this study clarified the combination characteristics of low-molecular-weight organic acid and urea. This founds a basis for the study on the reaction mechanism of organic polymer and urea and provides new ideas for the selection of high-efficiency fertilizer synergists.
Oct. 01, 2021Vol. 41 Issue 10 3129 (2021)
Zhi-chao YANG, Lu SHI, Jing CAI, and Hui ZHANG
The species identification of blood stains has important practical significance in criminal technology and inspection and quarantine. Raman spectroscopy provides an idea for the identification of bloodstain species. In this paper, human blood samples and blood samples of pig, chicken, duck, cow and mouse were collected and their Raman spectra were obtained. Savitzky-Golay method was used to smooth noise reduction, airPLS method was used for baseline correction, and 100~1 700 cm-1 bands were selected for the experiment. The training set contained 600 sets of data, and the test set contained 300 sets of Raman spectral data. The first part of the experiment compared plS-DA, LDA, PCA+LDA, SVM and PCA+SVM. The accuracy of the test set was 84.0%, 49.3%, 78%, 83.0% and 85.7% respectively, which verified the effectiveness of the combination of the dimension-reduction algorithm and the SVM classifier. In the second part, three band selection algorithms of mutual information algorithm, genetic algorithm and equispaced combination were adopted. A comparative experiment was conducted in combination with the SVM classifier. The results showed that the combination of mutual information and the SVM algorithm had the best classification accuracy. When the number of band selection is 300, the accuracy of the three band selection algorithms combined with the SVM classifier is about 93%, which is much higher than the traditional classification method. The experimental results show that the spectral dimension reduction using a band selection algorithm can effectively improve the accuracy and robustness of the algorithm, and at the same time, make the identification of Raman spectral species more interpretable. The band selection algorithm determines the key band location of blood stain identification, which is also important for the design of a portable Raman system for law enforcement.
Oct. 01, 2021Vol. 41 Issue 10 3137 (2021)
Sen ZHAO, Xiao-tian LIANG, Meng-ke YU, and Jing CAI
To establish a method to use Raman Microscope Imaging Spectrometer to inspect the propellant powder, the product after the propellant combustion, and the shooting residue. Collect the propellant particles of the imitation 9×19 Balabellum pistol ammunition and the combustion product of the “QSZ92” 9 mm pistol propellant and extract the shooting residue from the shooter’s hand, the shooting residue in the barrel and the target. Shoot the residue on the target. The Raman Microscope Imaging Spectrometer was used to perform Raman detection on the collected propellant gunpowder, gunpowder combustion products and shooting residue samples. The experiment found that 455 nm laser should be used to detect the above samples. This wavelength laser can effectively avoid the interference of fluorescence; the laser intensity is 6.0 mW, the energy Raman intensity can reach the maximum, and it can be better distinguished from other impurity peaks; observe the objective lens at the same time choose the 50 times condition. Under these multiple conditions, the microscopic morphological characteristics of the sample to be tested can be seen, and the Raman signal can be absorbed to the greatest extent. Using the above parameters, the Raman signal obtained by the sample to be tested has the best effect. The results of the detection spectrum of Raman spectroscopy proved that the main components of the gunpowder, the composition after the burning of the gunpowder and the shooting residue extracted from other parts were basically the same, and these components were mainly derived from the organic components in the sample to be tested. After the gunpowder is burned, the Raman intensity of some parts of the gunpowder and other parts extracted from the shooting residue has decreased and changed relative to the fired gunpowder. The fluorescence phenomenon has been strengthened in the experiment, which proves that certain specific components will change after the shooting. Under the condition of a 50x objective lens, the microscopic morphology is highly comparable. It is found that the surface of the object to be tested has the characteristics of the black and bright surface, collapsed voids and cracks. These characteristics can be regarded as the typical microscopic morphological features of different types of samples to be tested and can also be used as a judgment shot strong evidence of residue. This method can use Raman spectroscopy to perform non-destructive testing of propelled gunpowder, products after burning of gunpowder, and shooting residues, which meets the current spectral inspection and forensic inspection requirements for such samples. At the same time, the method has high sensitivity, fast analysis speed and easy operation.
Oct. 01, 2021Vol. 41 Issue 10 3142 (2021)
Yan-jun ZHANG, Cheng-long KANG, Ya-qian LIU, Xing-hu FU, Jin-xiao ZHANG, Ming-xue WANG, and Liu-zhen YANG
A new quantitative analysis method was proposed, which combined surface-enhanced Raman spectroscopy (SERS) and support vector regression (SVR) based on Grey Wolf Optimization (GWO) algorithm to quickly and quantitatively detect the total nitrogen (TN) and total phosphorus (TP) content in water. The traditional TN and TP detection methods are complicated in process and time-consuming in the experimental environment. Therefore, rapid detection cannot be realized. However, SERS technology is easy to operate and time consuming, so combining it with the GWO-SVR algorithm can realize fast and accurate detection. With laboratory silver sol as the Raman enhanced substrate and TN ,TP solutions with different concentration gradients as the research objects.TN and TP sample solutions were allocated to 26 and 23 groups respectively, in which 8 groups were selected as the test set for TN solution, 7 groups as the test set for TP solution, and the remaining sample solutions as the training set. The optimal experimental scheme was determined according to the different volume ratios of the tested solution and the silver sol. TN ,TP were mixed with silver sol for 1:1, 1:2, 1:3, 2:1, 3:1, respectively. The results showed that the enhancement effect was the best when the solution and the silver sol were mixed at a ratio of 2:1. Spectral information was collected, and characteristic peaks were assigned. The original spectral data were preprocessed by dark current deduction, background deduction (baseline correction) and smoothing processing. The spectral analysis results show that the intensity of characteristic spectral peak varies with the concentration of solution due to the difference of functional group concentration in different concentrations of solution. The GWO-SVR quantitative analysis model was established by taking the spectral characteristic peak strength and solution concentration of the training set sample as the input and output values of the regression prediction model. Themodel’s prediction ability was analyzed by correlation coefficient (r) and mean square error (MSE) of the sample solution of the test set, and the GWO-SVR model was compared with the other two models. The results showed that the GWO-SVR model predicted the TN solution with a correlation coefficient of 0.9995 and a mean square error of 0.005 8, which were higher than the 0.993 8, 0.052 7 and 0.998 3, 0.022 7 of the artificial bee colony algorithm optimization support vector regression (ABC-SVR) and particle swarm optimization neural network (PSO-BP).The correlation coefficient of TP solution prediction was 0.998 5, and the mean square error was 0.037 6, which was also higher than the other two models. Moreover, compared with ABC-SVR and PSO-BP models, GWO-SVR has fewer input parameters, faster convergence speed, and easier to find the optimal global solution. Therefore, this method can realize the rapid and accurate detection of TN and TP content in water and provides a new method for water quality detection.
Oct. 01, 2021Vol. 41 Issue 10 3147 (2021)
Xiang-peng JIN, Xing-jia LI, Chen-jie ZHANG, Ya-xian YUAN, and Jian-lin YAO
The surface plasmon resonance (SPR) of noble metallic nanostructures has attracted considerable attention due to its wide application. It plays a dual roles in catalyzing special surface reactions and inducing surface-enhanced Raman spectroscopy (SERS) effect. For the latter, the surface Raman signal is enhanced dramatically. It allows monitoring the SPR catalysis reaction by SERS at nanostructures with extremely high sensitivity. However, the SERS investigation of SPR catalysis reaction is still significantly restricted to the N=N coupling. The extension on the reaction type and improvement in the catalytic activity and efficiency are highly desired. Herein, the SERS technique is employed to investigate the decarboxylation reaction of Ortho-mercaptobenzoic acid (OMBA) adsorbed on Au nanoparticles monolayer film (Au MLF). The self-assembly fabricated the Au MLF at air/liquid interface, and it exhibited uniform distribution of “hot spots”. By using as substrate, the influence of solution pH, laser power and irradiation duration on the surface decarboxylation reaction was explored accordingly. The results demonstrated that the decarboxylation reaction of OMBA was occurred in the neutral or alkaline solution at Au MLF, and the product was thiophenol (TP). It was absent in the acidic solution and the activity of decarboxylation reaction activity in the alkaline solution was higher than that in the neutral solution. The stronger laser power brought the higher activity of decarboxylation. It indicated the linear relationship between the SERS intensities and laser irradiation duration, and the efficiency of SPR catalyzed decarboxylation was improved by prolonging the irradiation duration. The preliminary results are beneficial for extending the SPR catalyzed surface reaction and understanding of the surface reaction mechanisms.
Oct. 01, 2021Vol. 41 Issue 10 3153 (2021)
Jing-xin ZOU, Yan-qin LIU, Ming-zhe YUAN, Qi-hang WANG, Zhou FAN, and Fu WAN
Obtaining effective characteristics that can accurately reflect the ageing condition of oil-paper insulation is of great significance to the accurate diagnosis of oil-paper insulation systems. Surface-enhanced Raman spectroscopy (SERS) has shown application potential in oil-paper insulation ageing diagnosis. This paper performed accelerated thermal ageing test for oil-paper samples composed of conventional 25# mineral oil and ordinary Kraft paper. The Raman spectral signal was obtained by the Confocal laser Raman spectroscopy (CLRS) platform and the silver nano-plates. Various methods extracted the features of Raman spectrum. The competitive adaptive reweighting algorithm was used to extract the key variables of the spectrum. The results correspond to the main characteristic peaks of aging characteristics of oil-paper insulation. The Voigt function is used to analyze the spectrum. A correlation between the profile parameters of the analytical peak and the aging degree of oil-paper insulation was obtained. The aging degree of the samples was classified according to the polymerization degree of the insulating paper. The first eight principal components and their loadings were correlated with aging characteristics and aging degree and can accurately classified the samples. Finally, wavelet packet energy entropy analysis was carried out to analyze the energy change of Raman spectrum in the aging process of oil-paper insulation. This study provides a basis for the application of surface enhanced Raman spectroscopy in the diagnosis for the ageing condition of oil-paper insulation. It lays the foundation for the rapid and non-contact comprehensive diagnosis for the fault and ageing condition of oil-paper insulation equipment in the field.
Oct. 01, 2021Vol. 41 Issue 10 3159 (2021)
Guang-mao LI, Sheng-ya QIAO, Chen ZHU, Fu-li ZHENG, Sen YANG, and Han-xian CAI
The development of electric energy is closely related to the development of the national economy, so the stable and safe operation of the power grid guarantees the people’s stable life. The stable and reliable operation of the power grid is related to the insulation level of the transformer, so it is very important to always pay attention to the condition and operation of electrical equipment. The furfural produced only by paper insulation is currently one of the most commonly used indicators for evaluating the aging status of power transformers, so it is of great significance to accurately measure the furfural content in transformer oil. Raman spectroscopy based on the Raman effect can achieve rapid and non-destructive detection of the object to be tested, but limited by the weak Raman scattering signal, it is not easy to detect trace substances such as aging characteristics in oil. Surface-enhanced Raman spectroscopy technology can solve the sensitivity problem of trace substance detection and enable fast and non-destructive detection of aging features dissolved in transformer oil. Therefore, the application of SERS to detect furfural in transformer oil is of great significance for evaluating transformer operating conditions. In this article, around the problem of low detection sensitivity of furfural in transformer oil as a trace substance, a micro-nano structure SERS substrate was prepared on the TEM copper mesh based on the displacement reaction to detect furfural in transformer oil. It provides a fast and effective new method for efficiently and accurately detecting the aging level of transformer oil. In this paper, specific experimental materials are selected, the micro-nano structure SERS substrate is prepared based on the displacement reaction under controlled specific experimental conditions, and its surface morphology is characterized by scanning electron microscopy. Raman characteristics are obtained by Raman detection at different detection positions The relative standard deviation of peak-to-peak intensity is only 3.55%, indicating that the substrate has a uniform distribution of “hot spots” and higher detection repeatability; qualitative analysis of the Raman spectra of furfural in transformer oil with a certain concentration gradient and the Raman of the background noise spectrum. Combined with the selection rule of Raman characteristic peak, the Raman peak of 1 702 cm-1 was selected as the Raman characteristic peak of furfural in oil. In the quantitative analysis, a linear function of the ratio of the standard internal peak to the peak at 1 702 cm-1 and the furfural concentration in the transformer oil was established, and it was concluded that it has a good linear relationship. The 3δ principle is used to calculate the minimum detection concentration of furfural in transformer oil on the micro-nano structure SERS substrate, which is about 0.51 mg·L-1. In this paper, the micro-nano structure SERS substrate based on copper mesh displacement reaction has a more sensitive detection of furfural in transformer oil. This is very important for diagnosing the insulation status of power transformers and maintaining the stability of the power grid.
Oct. 01, 2021Vol. 41 Issue 10 3166 (2021)
Yun-fan YANG, Jian-bo HU, Yong-gang LIU, Qiang-qiang LIU, Hang ZHANG, Jian-jie XU, and Teng-xiao GUO
Peptides are important biological molecules. Ultraviolet-visible absorption spectroscopy and fluorescence spectroscopy are important methods for studying the fine structure of biomolecules. The structures and molecular frontier orbital of Growth hormone-releasing peptide (GHRP-6) and Oxytocin were calculated by density functional theory (DFT/RI). Based on time-dependent density functional theory (TDDFT), TDA and other parameter approximations are introduced to establish theoretical models for calculating the UV-Vis and fluorescence spectra of peptides. For GHRP-6, UV spectrum peak is λcal.=282 nm (λExp.=279 nm, Δλ=3 nm, Erλcal.=368 nm (λExp.=360 nm, Δλ=8 nm, Erλcal.=269 nm (λExp.=275 nm, Δλ=6 nm, Erλcal.=305 nm (λExp.=312 nm, Δλ=7 nm, Er*→π orbital transition on the tryptophan residue, Oxytocin fluorescence peak position is similar to the fluorescence wavelength range produced by tyrosine. The main contribution of Oxytocin’s fluorescence is the π*→π orbital transition on tyrosine residues. Calculation results obtain via theoretical models are in good agreement with the experimental. It shows that the models are feasible to accurately calculate the UV Vis absorption spectra and fluorescence spectra of polypeptides, providing reliable theoretical guidance for experiments.
Oct. 01, 2021Vol. 41 Issue 10 3172 (2021)
Zi-hao ZHOU, Fan YANG, Dong LI, Jian-ping WANG, and Jian-hua XU
At present, the research on the pH response of quantum dots mainly focuses on quantum dots containing Cd, and study only the response of steady-state fluorescence spectrum to pH value. However, quantum dots containing Cd have certain toxicity to the biological system, and the steady-state fluorescence spectrometry has certain instability due to the influence of concentration and other factors, so the application of quantum dots containing Cd as pH probes in biological systems has obvious disadvantages. Based on the above analysis, water-soluble ZnSe quantum dots based on glutathione ligand were made by the water phase synthesis method, showing the characteristics of low toxicity and good biological compatibility, which is suitable for application in biological systems. The fluorescence dynamics of ZnSe quantum dots under different pH values from 5 to 11 have been systematically studied by using time-correlated single-photon counting technique, UV-VIS absorption and steady-state fluorescence spectroscopy. Two fluorescence decay lifetime components of ZnSe quantum dots were found around 4 and 24 ns. By collecting fluorescence decay curves of ZnSe quantum dots at different detection wavelengths, it was found that the long-lifetime components increased with the increment of detection wavelength, while the short-life components did not change with the change of detection wavelength. It is concluded that the short life and long-life components were derived from non-local carrier recombination in the nucleus and local carrier recombination in the surface state, respectively. In addition, it was found that ZnSe quantum dots under different pH values showed different fluorescence lifetimes, and the fluorescence lifetime was negatively correlated with pH change, which was mainly derived from the surface state lifetime components. The sensitivity responding to the pH values was different, which maximized in the pH value range of 6~8, showing a large decay with the increase of pH value for the surface state lifetime components. It was further found that the ratio of two-lifetime components of ZnSe had a good linear correlation with all the pH values, but the slope was different in different pH ranges. The maximum value was within the range of 6~8. The interaction experiments with metal sodium ions and related reports show that metal ions have little influence on the fluorescence lifetime of ZnSe quantum dots. The above studies show that ZnSe quantum dots have a good application prospect in the pH detection of biological systems.
Oct. 01, 2021Vol. 41 Issue 10 3178 (2021)
Peng-cheng LI, Han LIU, Long-lian ZHAO, and Jun-hui LI
To provide effective technical means for the study of the crop growth in water stress response mechanism, drought monitoring, and precision irrigation, moisture content detection in different regions of maize live crop leaves and near the canopy is achieved.The large volume, large weight, low luminous flux hyperspectrometer is difficult to achieve live detection in the field. The small volume, small weight, high luminous flux NIR camera with filters to make it wavelength-resolved is expected to achieve live leaf moisture content imaging detection in the field. Based on the near-infrared hyperspectral data of live maize leaves, this study is to investigate the key parameters, including the characteristic wavelength position and number, bandwidth and offset limit. Among them, the simulation data of different bandwidths are based on the filter light transmission distribution function; the simulation data of the center wavelength shift under fixed bandwidths are based on the interpolation method. The research results showed that the feature wavelengths are 1 150 and 1 400 nm respectively, and the bandwidth is less than 100 nm, which can meet the requirements and find the filter products that meet the parameter conditions. When the bandwidth was 25 nm, the model set’s determination coefficient (R2) and root mean square error (RMSE) were 0.968 and 1.245%, respectively, and the prediction set was 0.960 and 1.298%, respectively. To infer that the model built with the filters is affected by the ambient temperature, the model within a fixed center wavelength is used to predict the simulation data of different offsets. When the drift was 0.05 nm, the model prediction errorunder non-drift conditions was about 3%, which could be neglected. The relationship between the center wavelength drift of the filter and the temperature is equivalent to that the ambient temperature in the range of 50 ℃ has little effect on the detection results. Thisresearch provides important technical parameter support and working range for the NIR camera with filters to form a multispectral imaging system detection device. The device’s construction has been started, and the realization of the device can provide new and effective means for modern agricultural crop physiology and production research.
Oct. 01, 2021Vol. 41 Issue 10 3184 (2021)
Guo-liang WANG, Ke-qiang YU, Kai CHENG, Xin LIU, Wen-jun WANG, Hong LI, Er-hu GUO, and Zhi-wei LI
As the main ingredient of millet flour, the quality of starch determined the market price of millet flour. Gelatinization characteristic is one of the most important physical characteristics of millet flour, and the alkali spreading value is the main index that reflects the gelatinization characteristic directly. The differences in the alkali spreading the value of millet flour show the quality of amylose content. When the alkali spreading value becomes lower, on the contrary, the gelatinization temperature and amylose content become higher, eventually the lower the waxy of millet flour. This study employed the hyperspectral technique could with chemometrics methods to develop an approach for detecting the alkali spreading the value of millet flour, whose aim is to explore a rapid, nondestructive and low-cost method for predicting the alkali spreading the value of millet flour. First, the hyperspectral data of millet flour were collected, then the hyperspectral data matrix in the region of interest (ROI) in each pixel was computed. The results were meant in each wavelength of every sample. Then we used the rapid visco analyser (RVA) to measured the alkali spreading the value of millet flour. In the data processing, partial least square regression (PLSR) models were made after using competitive adaptive reweighted sampling(CARS) and random frog (RF) to extracted key wavelengths. The results showed that the highest predicted Rp was 0.77 in the PLSR of the full wavelengths, and that explained that the reflectance of millet flour could invert the alkali spreading the value of millet flour. The Rp in the other two methods were 0.72 and 0.7, and both were close to the previous result, these illustrated it was feasible to build the PLSR using CARS and RF. In order to improve the predicting accuracy, the full wavelengths were preprocessed by Savitzky-Golay (S-G), multiplicative scatter correction(MSC) and S-G+MSC. The performance of the PLSR model was better by using MSC predicted the full wavelengths (Rp=0.83). Then built the PLSR model again after extracting key wavelengths using CARS and RF, compared with the models without pretreatment, the Rp does not change much, which also shows that CARS and RF have a certain stability and can be used as reference methods for predicting the alkali spreading the value of the hyperspectral reflectance of millet flour. The results showed that the reflectance of millet flour could predict its alkali spreading value by using hyperspectral. This could supply a rapid, nondestructive and low-cost method of the alkali spreading value of millet flour, then provided the theoretical foundation for the rating, processing and alkali spreading value sensor of millet flour.
Oct. 01, 2021Vol. 41 Issue 10 3189 (2021)
Liu ZHANG, Nan YE, Ling-ling MA, Qi WANG, Xue-ying LÜ, and Jia-bao ZHANG
Hyperspectral images have hundreds of continuous and narrow spectral bands, spanning visible light to infrared light. They can provide fine spectral properties of ground objects and have important application value for recognizing and classifying ground objects’ materials and attributes. It is of great significance to select limited spectral bands for transmission and processing of interested targets, improving the timeliness of hyperspectral data processing and designing practical spectrometers for specific applications. Selecting the optimal band combined with the target features becomes an inevitable requirement to improve the processing efficiency and ensure the accuracy of target recognition or classification. Therefore, selecting the band subset with better classification and recognition ability from hundreds of hyperspectral images is an urgent problem to be solved. This paper proposes a hyperspectral band selection method based on the improved particle swarm optimization algorithm. This method is different from the traditional particle swarm optimization algorithm by introducing the “probability jump characteristic” and setting the elimination mechanism of the new solution to eliminate the “stagnation” new solution, which improves the global optimization performance of the algorithm. Then, based on the spectral characteristics of the target, the objective optimization function of optimal band selection is adopted. The improved particle swarm optimization algorithm is used to solve the objective function, and the selected band subset is fed back to the support vector machine (SVM) for classification application. In this paper, two standard hyperspectral datasets (Indian pines, The experimental results show that the proposed method has higher classification accuracy than the existing methods. Among the several methods, the traditional particle swarm optimization algorithm has the worst effect; the waveband selected by the proposed algorithm has the best classification accuracy, and the classification accuracy of the two data sets can reach 98.141 4% and 99.084 8%, respectively.
Oct. 01, 2021Vol. 41 Issue 10 3194 (2021)
The detection of insect pests of Phyllostachys edulis plays a vital role in the growth of bamboo and the development of the bamboo industry. Based on the relationship between the hyperspectral canopy spectrum information and the pest degree of Phyllostachys edulis, the characteristic wavelengths, indices, and spectral parameters closely related to the pests in the canopy spectrum were extracted, and Fisher’s discriminant analysis method was used to establish Phyllostachys edulis Pest degree detection model. Here are the wavelengths at 400~508, 586~693, 724~900 nm of the original spectrum, and the envelope curve to remove the characteristic wavelengths between 400~756 nm of the spectrum, 9 of canopy spectrum vegetation indices and 7 characteristic spectral parameters of the canopy are used as independent variables of the Fisher discriminant function to construct the discriminant function. Collected 300 groups of Phyllostachys pubescens leaf pest sample data, and randomly divided them into 210 modeling sets and 90 verification sets. According to the detection accuracy, Kappa coefficient and determination coefficient R2 as the test standards, the effect of the established discriminant function is evaluated and compared. The results show that the inspection accuracy of the Fisher discriminant function established by the original spectrum, de-envelope spectrum, canopy index, and spectral parameters as independent variables are 84.4%, 81.1%, 79.7%, 78.7%, respectively. The inspection accuracy of Kappa coefficient is 0.79, 0.74, 0.74, 0.76, and R2 is: 0.89, 0.88, 0.88, 0.85, respectively. It can be seen that the function established by the Fisher discriminant analysis model has a good ability to detect the degree of pests of the Phyllostachys edulis, and the discriminant function established based on the original spectrum of the canopy has the best detection effect. The discriminant function established based on the original spectrum of the canopy of the hyperspectral data was used to detect the pest degree of Phyllostachys edulis in Yangmen and Tulong Village in Wufang Village, Dagan Town, Shunchang County, Fujian Province. The test result is that the bamboo forests in the two sample areas of Shanghu are mainly healthy, and the pest degree of the two sample areas of Yangmen is mainly moderate and severe. Therefore, based on UAV hyperspectral remote sensing, it is feasible for large-area detection of Phyllostachys edulis pests. The method and results can provide a reference for the exploration of pest detection and contribute theoretical support for pest detection based on canopy remote sensing.
Oct. 01, 2021Vol. 41 Issue 10 3200 (2021)
Lin HU, Shu GAN, Xi-ping YUAN, Yan LI, Jie LÜ, and Ming-long YANG
Hyperspectral remote sensing technology has the advantages of map integration. And compared with the traditional multispectral remote sensing technology, it can realize the accurate identification of the target. Therefore, it is gradually applied to the detection of surface vegetation. In this paper, the three typical surface vegetations are bamboo forest, armand pine and spinney in central Yunnan, which were taken as the research objects. In order to get the hyperspectral features of three typical surface vegetation types in central Yunnan, based on the airborne hyperspectral image data, the original high spectrum, first-order differential treatment spectra and the continuum removal spectra were compared and analyzed. Results showed the following: (1) Based on the analysis of the original spectral features, the optimal band window of the original hyperspectral of the three typical surface vegetations appeared in 690~946 nm, and the spectral reflectance characteristics in this band range were bamboo forest>armand pine>spinney; (2) The analysis of spectral features by first-order differential processing shows that the spectral difference of vegetation can be enhanced by spectral differential transformation. After the first-order differential treatment, the optimal band window of the spectrum appeared in the range of 670~774 nm, and the first-order differential coefficient is bamboo forest>armand pine>spinney. Moreover, it was found that 718 nm was the sensitive band of the three types of vegetation, and the characteristic sensitive band of 718 nm could be used to distinguish the three types of vegetation. In addition, three types of vegetation types can be distinguished by comprehensively applying the characteristic parameters of the first-order differential spectrum, including the blue edge amplitude, the yellow edge amplitude, the red edge amplitude, the blue edge area, the yellow edge area and the red edge area. (3) Finally, based on the analysis of the spectral features of the continuum removal treatment, it is concluded that the continuum removal method can effectively enhance the spectral curve reflection and absorption features of vegetation. After the continuum removal, the optimal band window of the three typical vegetations was between 458~554 and 570~690 nm. In the range of these two bands, the first-order differential coefficient is bamboo forest>armand pine>spinney. Moreover, it was found that 502 and 674 nm were sensitive bands of the three types of vegetation, and this feature could be used to distinguish the three types of vegetation comprehensively. The research results of this paper are helpful to provide technical methods for the fine discrimination of forest vegetation in central Yunnan. At the same time, it will provide technical support for the future development of integrated remote sensing vegetation fine classification of space-ground-air hyperspectral image data.
Oct. 01, 2021Vol. 41 Issue 10 3208 (2021)
Jia-mao SANG, and Feng-nong CHEN
Rice smut is known as the cancer of rice. The pathogen not only affects rice yield, but also causes health risks if it attaches to food and enters the body. In this study, the normalized vegetation index (NDVI) of hyperspectral images was used to obtain feature points, and the incidence of rice smut disease was detected by the method of rank sum test. Firstly, 28 adjacent rice test areas with the same area were selected from the research base of the China National Rice Research Institute. Four farmland management methods were adopted in the area, namely natural growth and spraying with 3 different pesticides. Each management method had 7 different planting dates. The sowing dates of the plots in the adjacent experimental areas differed by 1 week before and after the plots, successively decreasing, each area planted about 500 rice plants. In the peak period of rice smut disease, the incidence of rice was first investigated on the spot, and the incidence index was obtained according to the number of incidences of rice ears per unit area. Then use the UAV-borne hyperspectral camera to shoot the test field according to the corresponding trajectory. In order to facilitate the subsequent hyperspectral image stitching, it is necessary to ensure that the aerial photography path covers the test field. According to the aerial photo coordinates, elevation information and similarity, multiple hyperspectral samples are sorted, and each hyperspectral image is stitched with high quality by the corresponding algorithm. Finally a complete hyperspectral image covering the entire test area is obtained. The normalized vegetation index that best reflects the incidence of rice smut disease is extracted from the hyperspectral image, and the feature points in the corresponding spectrum are obtained according to the index to achieve the purpose of feature dimensionality reduction. The data is cleaned with box plots to remove the feature points. Then use the cleaned feature points to perform rank sum test on the disease feature values of different rice test areas. The rank sum test is divided into two steps. The first step is to perform a rank sum test on the total sample to verify whether there is a significant difference, determine which set of samples the difference comes from; the second step is to arrange and combine the 4 sets of samples to obtain a total of 11 sets of samples to be tested in different combinations, and perform rank sum tests on the 11 sets of sample data. The significance level obtained by each group is much less than 0.01, indicating that there are extremely significant differences in sample data between different groups, and it also reflects the rationality of this method for detecting the incidence of rice smut disease. In order to show the different incidence areas, the planting areas with different incidences of rice smut are marked with different colors. Finally, the field rice incidence index was used as the control group to compare with the rank sum test results. The results showed that the rank sum test was feasible to detect the incidence of rice smut disease.
Oct. 01, 2021Vol. 41 Issue 10 3214 (2021)
Sheng-hui YANG, Yong-jun ZHENG, Xing-xing LIU, Tian-gang ZHANG, Xiao-shuan ZHANG, and Li-ming XU
Wine grapes are generally harvested in batches, and their quality is affected by harvest time. Conventional methods mainly rely on the test of physical and chemical indicators of samples in laboratories, such as testing phenol and sugar, to determine the maturity of harvest. However, if multiple fields are required to be continuously monitored before harvesting, it will be difficult to ensure the quality of grapes due to large batches, high costs, heavy workload of sampling and analysis and lower timeliness. In this paper, Cabernet Gernischt taken as the study object, a novel method using the near-ground spectral images by Unmanned Aerial Vehicles (UAVs) to determine maturity was proposed. A multispectral camera, ADC Micro, was carried by a four-rotor UAV, DJI Phantom, and the grape images of nine sampling points were taken in-situ with an S-shaped sampling route. Meanwhile, grape samples were collected. Then, a multispectral image processing software, PixelWrench2 x64, was employed for image processing to obtain the values of red (R), green (G) and near-infrared (NIR) index of each image. In addition, grape juice was obtained by pressing and total sugar was selected as the characteristic of maturity determination due to detection duration, cost and representativeness. A handheld sugar meter, PAl-1, was applied to detect the total sugar of the juice. Furthermore, the significance between R, G and NIR components and sampling date were respectively analysed, illustrating that the R component of leaf-dense areas (the local areas) had the most significant relation with and date (with P-value=5.314 44×10-4 and Adjusted R2=0.815). Therefore, the local R component was selected as the maturity characteristics of modelling. According to the principle that the model set and validation set should be 4:1, the models between total sugar and local R component were respectively developed using linear and logarithmic regression. The results showed that compared with the linear model, there was a very significant logarithmic relation between them (with p-value=5.124 07×10-10, adjusted R2=0.970 62). The mean of prediction errors of the model was less than or equal to 1.388%, the maximum prediction error of the model was less than or equal to 4.6% and the pre-harvest prediction error was ±0.46%. It was demonstrated that the logarithm model had high accuracy of detection. As a consequence, before harvesting, the multispectral images of Cabernet Gernischt could be gathered in-situ in fields by using UAVs to collect spectral images to obtain the local R-component value. Then, the value could be taken into the logarithmic model to predict the content of total sugar. Based on the standard that total sugar should be 22%±0.46%, Cabernet Gernischt maturity could be determined. Hence, it is convenient and feasible to use spectral images of fields to predict wine qrapes’ quality and harvest time, which provides a novel idea for the application of spectral images in agricultural production.
Oct. 01, 2021Vol. 41 Issue 10 3220 (2021)
Zhi-qi ZHANG, Tong ZHAO, Ling LIU, and Yan LI
The origin of agate is distributed worldwide, and the mineralogical and spectroscopic characteristics of agates in most areas at home and abroad have been well studied. However, little research has been focused on the spectral characteristics and origin characteristics of agates from Madagascar. The banded structure and spectral characteristics of five agate samples from Antsohihy and Mahajanga were analyzed using polarization microscope, infrared spectrometer, and Raman spectrometer. The main mineral compositions of the samples from Mahajanga and Antsohihy are the same, which include α-quartz and moganite. The absence of characteristic Raman peaks (501 cm-1) of white and red moganite near the center of the sample from Mahajanga, combining with the previous studies, is related to the dehydration reaction between structural water in the agate to form neutral water molecules, which react with moganite to form the quartz particles. However, the secondary minerals from those two areas are different. The Raman peaks of the agate from Mahajanga are 222, 294, 410, 1 316 cm-1, which are proved to be hematite. But the Raman peaks of the samples from Antsohihy are 400~1 160 cm-1.Therefore the secondary mineral is feroxyhyte. The impurity minerals in some samples from Antsohihy were proved to be α-quartz (moganite) and feroxyhyte by Raman spectrometer.It was speculated that four agates from Antsohihy were formed in a low-temperature (2+ content (β-1) and structural water (3 750~3 500 cm-1), the structural water (3 740 cm-1) in agates from Antsohihy was proved to be located at structural defects. It is of great significance to speculate the formation mechanism of Madagascar agates by combining with the texture and spectral characteristics of Madagascar agates. Moreover, feroxyhyte can be used as a common mineral which is different from other producing areas and has the significance of producing areas. It also provides support for studying the geological environment of the formation of Madagascar agates.
Oct. 01, 2021Vol. 41 Issue 10 3227 (2021)
Wen-feng YANG, Zi-ran QIAN, Yu CAO, Gui-ming WEI, De-hua ZHU, Feng WANG, and Chan-yuan FU
Laser paint removal, as a branch of laser cleaning technology, will replace the traditional polishing and chemical paint removal technology to achieve the controlled paint removal of the aircraft skin surface.However,the process and quality of controlled paint removal depend on effective in-situ online monitoring technology. For the multi-paint layer on the surface of the aircraft aluminum alloy skin,LIBS technology is used to analyze the spectral and the component of characteristic elements of different paint layers and different paint thicknesses during laser paint removal.Based on signal interpretation, to establish the relationship between the paint layer and paint thicknesses of laser paint removal and the change of LIBS spectrum.And to realize the real-time monitoring and feedback control of the paint removal process and quality.The results show that the spectral peak of the characteristic elements (Fe, Ti) of the layer disappears when the topcoat or primer is completely removed in the process of layered removal.Once LIBS monitors the characteristic element Fe of topcoat at 501.494 1 and 521.517 9 nm Fe Ⅰ spectral characteristic peak disappears, the topcoat has been completely removed at the same time. And when the characteristic element Ti of primer at 498.173 0, 499.107 0 and 521.039 0 nm Ti Ⅰ spectral characteristic peak disappears, determine primer has been completely removed.When the paint is removed in different thicknesses, the spectral peak strength of the paint characteristic element (Ca) decreases correspondingly with the decrease of the paint thickness or the increase of laser pulse. Until the paint thickness is 0 (completely removed), the spectral peak of the paint characteristic element disappears, and the matrix characteristic element (Al) appears.By applying the LIBS spectral signal intensity changes of Ca Ⅰ at 616.217 0, 643.907 0 and 422.673 0 nm, the remaining paint thicknesses during laser paint removal could be monitored and further realizes Laser-based Thickness Controlled Paint Removal. In addition, combined with EDS and SEM testing and analysis, the feasibility of LIBS for aircraft skin laser paint removal process and effect monitoring, Laser-based Layered Controlled Paint Removal and Laser-based Thickness Controlled Paint Removalare verified. It shows that under the premise of not damaging the oxide layer of the substrate, by monitoring the characteristic element spectrum and composition change law of the topcoat and primer at the corresponding wavelength position, Laser-based Layered Controlled Paint Removal and Laser-based Thickness Controlled Paint Removal can be achieved.
Oct. 01, 2021Vol. 41 Issue 10 3233 (2021)
Wen YOU, Yang-peng XIA, Yu-tao HUANG, Jing-jun LIN, and Xiao-mei LIN
When laser induced breakdown spectroscopy (LIBS) is used for detection, due to the many and complex spectral lines, there are much redundant information, which will affect the quantitative analysis. Therefore, extracting effective feature variables is of great significance in the quantitative analysis of LIBS. In this paper, the method of selecting the spectral characteristics of the Ca element in the CaCl2 solution was analyzed, and the accuracy and stability of the univariate model, partial least square regression and CART regression tree calibration model were compared. In view of the large volatility of the surface of the water body, the poor spectral stability, and the fact that the spectrum is affected by the matrix effect and the self-absorption effect, the fitting coefficient (R2) obtained by the univariate model is only 0.933 2, and the training root mean square error (RMSEC), prediction root mean square error (RMSEP) and average relative error (ARE) are 0.019 2 Wt%, 0.017 7 Wt% and 11.604% respectively. After partial least squares regression optimization, the model R2 is increased to 0.975 3, and RMSEC, RMSEP and ARE are reduced to 0.010 8 Wt%, 0.013 Wt% and 7.49%, respectively. Although the model’s accuracy has been improved, it is still difficult to meet the analysis requirements. In order to further improve the accuracy of quantitative analysis, a CART regression tree calibration model was established. When constructing the tree model, this method uses the square error minimization criterion to select the optimal combination of characteristic variables from the complex spectral information to make classification decisions, thereby establishing the calibration curve of the Ca element. Through the variable selection of the CART regression tree, the number of characteristic variables is reduced from 100 to 6, and the compression rate of variables reaches 94%, which significantly reduces the interference of irrelevant spectral lines. The correlation coefficients of the regression tree model are R2, RMSEC, RMSEP and ARE is 0.997 5, 0.003 5 Wt%, 0.006 1 Wt% and 2.500%, respectively. Compared with the traditional univariate and partial least square regression, the CART regression tree model has higher accuracy and lower error. Through effective screening of characteristic variables, this paper eliminates the interference of irrelevant signals, significantly reduces the influence of matrix effect and self-absorption effect on LIBS quantitative analysis, and improves the accuracy and stability of quantitative analysis.
Oct. 01, 2021Vol. 41 Issue 10 3240 (2021)
Qing-shan WANG, Dong-yang WANG, Xiong-jie ZHANG, Bin TANG, and He-xi WU
In the measurement of the radioactivity energy spectrum, due to the low resolution of the detector, the similarity of the atomic energy level in the sample to be tested, and the limitation of the instrument stripping technology, the overlapping phenomenon of full energy peak often occurs, which brings great difficulties to the qualitative or quantitative detection of radionuclides. Conventional separation algorithms generally require complex spectrum transformation or a large number of standard spectrum samples and are not suitable for real-time decomposition of overlapping peaks at on-site of measurement. Therefore, a decomposition method of energy spectrum overlapping peaks based on the Gaussian sharpening method (GSM) is proposed, combining the resolution enhancement capability of the peak sharpening method and the smoothing characteristics of the convolution sliding transformation method, which can quickly identify, locate and resolve overlapping peaks in the γ energy spectrum. Firstly, the Gaussian function is sharpened and normalized and selected the appropriate Gaussian parameters and window width, used as a transformation operator to filter and improve the separation of overlapping peaks through convolution and sliding transformation of the original γ energy spectrum data. Then, the approximate function of the energy spectrum after GSM shaping is solved as the objective function, and several points near the center of the peak position are selected as initial parameters. Finally, the analysis of the characteristic peak parameters of the overlapping peaks is carried out by the method of nonlinear fitting. In the experiment, we first verified the invariance of the peak position and peak area eigenvalues before and after GSM shaping, and then the GSM was verified in the overlapping peak energy spectrum and the MCNP simulated131I, 137Cs, 214Bi, 206Bi and 26Al mixed radioactive source γ energy spectrum. The experimental results show that GSM has great decomposition ability for the overlapping peak with the resolution better than 0.375 and the SNR better than 40 dB, the relative errors of the peak position and peak area before and after decomposition are within 1% and 4.5%, respectively; For the GSM-processed energy spectrum of γ-ray, the relative error of the position of the overlapping peak is within 1% and that of the single peak is within 0.1%, furthermore, the decomposition result will be more accurate if the half-width in the transformation operator is set close to the energy resolution of the detector. GSM is noise-immune and does not require pre-processing operations such as spectrum smoothing and background subtraction in full-spectrum analysis. Besides, it consumes less computing resources and has high-resolution accuracy, which is convenient for embedded real-time spectrum analysis of energy spectrum measurement system and has practicability for quick on-site analysis of energy spectrum in radioactive measurement.
Oct. 01, 2021Vol. 41 Issue 10 3245 (2021)
Xiao-lin ZHANG, Shou-zhe LI, Chun-jun JI, Yu-long NIU, Yang BAI, and Hong-da LIAO
Atmospheric pressure argon plasma jet (APAPJ) is a non-equilibrium plasma producing a large number of electrons, positive ions, excited particles and active groups, which can significantly reduce the activation energy in reactions, and the dynamic effect caused by APAPJ also imposes influence on the transportation process, thereby they both play a very important role in the process of plasma-assisted combustion. In this experiment, By OES, the intermediate radicals (OH, CH and C2) generated in the non-premixed and premixed combustions are identified. The variation of emission intensity of those radicals is measured with respect to the fuel equivalent ratio and discharge voltage, respectively. It is found that the application of the APPJ causes the overall length of flame to become short and the flame surface appears wrinkled, with the blue area of the flame root continuously enlarged, which accounts for about 1/2 of the total flame area at discharge voltage of 22 kV, indicating that the combustion becomes complete and intense. When the voltage reaches 16 kV, the spectral intensity of the free radical OH(A-X), CH(A-X) and C2(d) becomes remarkable, but when the voltage is 22 kV, the spectral intensity decreases, which is because the plasma enhances the gas flow rate in the tube, causing the combustion region to move away from the nozzle so that the less intensity is collected by fiber during the spectrum acquisition process. In addition, the combustion process of premixed gas assisted by plasma jet under different fuel equivalence radio is studied. In the case of Φ=2, it is found that the spectral intensity of OH(A-X) increases with discharge voltage, while those of CH(A-X) and C2(d) decline when the discharge voltage is large enough that the APPJ is merged into flame near the nozzle. It is found that APAPJ plays an importance role in CH4 combustion in open air due to the active radicals generated in APAPJ and the mixing effect caused by ion wind by APAPJ.
Oct. 01, 2021Vol. 41 Issue 10 3251 (2021)
Tunable diode laser absorption spectroscopy technology is widely used in fields such as atmospheric environment monitoring, combustion flow field diagnosis, industrial process control, human breathing detection, etc. Due to its strong selectivity, high sensitivity, high accuracy and non-invasive measurement. Direct absorption technology and wavelength modulation technology are two different measurement methods of tunable diode laser absorption spectroscopy technology. The direct absorption technology measurement system has a simple structure, relatively easy signal processing, low cost, avoid pre-calibration, and is widely used when the measurement gas is a constant component use. When the direct absorption technique measures the gas concentration, it is first necessary to obtain a baseline signal indicating no absorption from the spectral absorption signal and this process is called baseline fitting. At the same time, the baseline fitting will bring large errors to the measurement results, which is one of the reasons why the direct absorption technique cannot reach the low detection limit. Regarding the issue above, this paper is based on the gradient descent method, taking the baseline, gas concentration, absorption line type, etc. as unknowns, and establishing the mathematics of the laser absorption spectrum signal. The model directly fits the transmission signal, and finally obtains the gas concentration information. This method simultaneously fits the lineshape and the baseline. Compared with the traditional integral area method, it enhances the overall consistency of the fit. It is using distributed feedback laser with center wavelength at 1 580 nm. This method is used to measure CO2 with actual concentrations of 10%, 12%, 14%, 16%, 18% and 20% in the near-infrared laser absorption spectrum gas concentration detection system. The research results show that the curve fitting variances of the direct fitting method at six concentrations are all less than 1×10⁻⁴, the minimum relative error of the measured concentration is only 0.90%, the maximum relative error is 4.40%, the iteration time is within 4 s, and the calculated detection limit is 0.39%. The average relative errors of the concentration obtained by the direct fitting method and the integral area method are 2.63% and 5.74%, respectively. The direct fitting method is better than the integral area method. The experimental research in this paper verifies the feasibility and accuracy of the gas concentration measurement method based on the gradient descent method to fit the spectral absorption signal directly and provides a new idea for directly absorbing technology.
Oct. 01, 2021Vol. 41 Issue 10 3256 (2021)
Guo-shui WANG, Ao GUO, Xiao-nan LIU, Lei FENG, Peng-hao CHANG, Li-ming ZHANG, Long LIU, and Xiao-tao YANG
As a necessary means of circulation of bulk cargo, ship transportation has made significant contributions to our country’s economic and social development. However, at the same, time marine diesel engines have brought severe problems of pollution emissions. In the context of increasingly stringent global emission limits, real-time monitoring of its emission parameters is of great significance to environmental protection, energy conservation, emission reduction, optimization of diesel engine control strategies and combustion performance. In recent years, tunable diode laser absorption spectroscopy (TDLAS) technology has gradually been favored due to its high accuracy and fast response. The wide application of this technology puts forward higher requirements for its research, so using mathematical software to simulate it has a certain value for this test system’s development and parameter adjustment. Combining the current ship emission detection problems, taking the most representative pollutant NO as the target gas, a simulation model of gas concentration measurement was made using software. The simulation model of the detection system is mainly composed of a light source modulation part, a line type function fitting part, a simulated gas absorption part, a line strength function S(T) fitting part, and a lock-in amplifier. The method of wavelength modulation is used to simulate the concentration measurement process. The high-frequency sine wave and the low-frequency saw tooth wave are superimposed to tune the laser. After the gas chamber absorbs the laser, the signal is adjusted by the lock-in amplifier to obtain the harmonic signals. The peak point of the value of the second harmonic divided by the first harmonic is used as the signal. The least-square method is used to fit the concentration-signal amplitude curve, and then the concentration inversion and error calculation are performed. The inversion error is within 2.5%. Analyzed the influence of temperature, pressure and other environmental factors on the signal amplitude and drew the harmonic graph. By introducing a reference gas chamber to eliminate environmental fluctuations on the results, there is no need to refit the concentration-signal curve when the environment changes. The result can be obtained directly. Tried to use different sine wave frequency, modulation coefficient and other parameters. Analyzed the influence of modulation parameters on signal amplitude and selected a suitable parameter range. It provided a certain reference for the construction of a diesel engine online emission test system and the selection of parameters.
Oct. 01, 2021Vol. 41 Issue 10 3262 (2021)
Study on the Characteristic Parameters of Lightning Return Stroke Channel Core Based on Spectroscopy
Guo-rong LIU, Ting-ting AN, Rui-bin WAN, Ping YUAN, Xue-juan WANG, Jian-yong CEN, He-tian CHENG, and Zhi-yan GUO
High current and intense electromagnetic radiation in the lightning return stroke channel core are the leading causes of many lightning disasters. With the rapid development of modern science and technology, lightning protection is becoming more and more important. In order to perfect the lightning protection system, it is necessary to investigate the microscopic physical mechanism of the lightning channel formation and development from the characteristic parameters describing the channel core. Up to now, spectral observation is the most effective means to obtain the lightning channel core characteristic parameters. In a field experiment on the Qinghai Plateau in China in the summer of 2015, a slit-less grating spectrometer assembled by a high-speed camera as a recording system was used, combined with a fast antenna ground electric field measuring instrument, the spectra of a cloud-to-ground discharge process including four return strokes and the synchronous fast electric field change information were recorded. According to the spectrum and plasma theory, the conductivity of the lightning return channel core is calculated. On this basis, the lightning electrodynamics model is used to calculate the lightning return stroke velocity, peak current, electromagnetic field across the return stroke channel core and peak power per unit length of the channel core. The results show that the return stroke velocity is in the range of (1.2~2.3)×108 m·s-1, and the maximum values of the axial electric field, radial electric field and magnetic induction intensity across the return stroke channel core are in the range of (1.42~1.74)×105 V·m-1, (8.22~9.99)×108 V·m-1 and 1.51~2.83 T, respectively. When the peak current is in the range of 7.52~24.05 kA, the peak power of the return stroke channel core is in the range of (0.63~1.92)×109 W·m-1. In addition, the correlations between the electrical conductivity, the initial electric field peak value, the return stroke velocity and the peak current and the peak power are analyzed, it is found that the peak current and peak power has a good linear relationship. The results can provide a reference for further exploring the microscopic physical mechanism of the formation and development of the lightning return stroke channel.
Oct. 01, 2021Vol. 41 Issue 10 3269 (2021)
Feng-nong CHEN, Jia-mao SANG, Rui YAO, Hong-wei SUN, Yao ZHANG, Jing-cheng ZHANG, Yun HUANG, and Jun-feng XU
With the improvement of people’s living standards, people pay more and more attention to the health care function of Chinese herbal medicine. Dendrobium officinale Kimura et Migo (Dendrobium officinale) is a rare Chinese herbal medicine, known as “life-saving fairy grass”. In this study, we tried to evaluate the quality of Dendrobium officinale by sugar content, pH value and other related physical and chemical characteristics. We selected three different habitats of Dendrobium officinale from Huoshan in Anhui, Yandang Mountain in Zhejiang and Yunnan Province as research objects, extracted the spectral data and physical and chemical parameters of different Dendrobium officinale, and then carried out the inversion of quality indicators. Finally, the correlation model between quality and spectrum was established. In the experiment, the leaves, roots and flowers of Dendrobium were removed first, and then the stems to be studied. The spectral data of three Dendrobium officinale with different quality grades were obtained by the ASD specter. The same samples was ground, put into a centrifugal tube, sealed with methanol solution, and packaged with tin foil paper to make corresponding solutions. The chlorophyll content, sugar content and pH value were measured by spectrophotometer, sugar meter and pH meter. The upper layer, middle layer and lower part of the centrifuge tube were selected for each sample. Each sample was measured 3 times, and the average value was taken as the control sample. The original spectral data were denoised and dimensionally reduced by wavelet transform. The correlation between the energy coefficients (including band and scale) and the physicochemical parameters of the Dendrobium officinale control group was analyzed. The higher energy coefficient in the determination coefficient was selected as the wavelet feature, and the wavelet feature was fitted by the least square method. Using all experimental samples as test set and 70% as verification set, the determination coefficient (R2) of chlorophyll content inversion model was 0.819, 0.820 and 0.865, the root mean square error (RMSE) were 0.035, 0.013 and 0.017, respectively; the determination coefficient (R2) of sugar content inversion model was 0.756, 0.764 and 0.823, respectively. The results showed that the root means square error (RMSE) was 0.025, 0.030 and 0.036 8; the determination coefficient (R2) of the inversion model for pH value was 0.819, 0.820 and 0.865, and the root mean square error (RMSE) was 0.034 5, 0.013 and 0.017, respectively. It can be found that the quality inversion model and determination coefficient (R2) of three kinds of Dendrobium officinale are all greater than 0.80, and the root means square error (RMSE) is less than 0.10. This study proved that the spectral characteristics of chlorophyll, sugar content and pH value in Dendrobium officinale were feasible for quality evaluation.
Oct. 01, 2021Vol. 41 Issue 10 3276 (2021)
Fu-hao LI, and Chang-jun LI
The research on predicting the spectral reflectance information of objects based on the camera RGB value has always attracted researchers’ attention. The traditional method is to restore spectral reflectance through the information under a single light source. Recently, Zhang et al. [Color Research & Application, 2017, 42: 68] proposed a two-step method for predicting reflectance based on camera RGB information under a single light source. Firstly, the camera response RGB value under a single light source is transformed to CIE XYZ values under different light sources through a polynomial model with local training samples using a pseudo-inverse method. Then the reflectance can be estimated based on the predicted CIE XYZ values under multiple light sources using local training samples and pseudo-inverse method. Though the method still uses camera RGB information under a single light source, obtaining CIE XYZ values under multiple illuminants improves the reconstruction accuracy of the spectral reflectance. Motivated by Zhang et al., a new two-step method is proposed for reconstructing spectral reflectance based on the raw camera RGB. Firstly, camera raw RGB is transformed to CIE tristimulus values under multi-illuminants via polynomial expansion of order 3 and weighted least square approach. Reflectance of the object is predicted based on the transformed CIE tristimulus values under multi-illuminants using the Wiener estimation. The prosed method uses the full set of training samples in order to avoid selecting a certain number of training samples that existed with the method of Zhang et al. Hence the proposed method is easy to be applied. Furthermore, in the method of Zhang et al., selected training samples are considered as equalimportant, while the proposed method assigns different weights to each of the training samples depending on the closeness to the given test sample in the first step so that prediction accuracy is increased. Comparison between the proposed method and the method given by Zhang et al. is considered. Both methods are trained using the X-Rite Color Checker Standard Digital (SG) chart and tested using the Color Checker Classic Chart and self-made 44 printed samples. Comparison results have shown that the proposed method outperforms the method given by Zhang et al. in terms of root mean square error (RMSE) and CIEDE2000 colour difference. Furthermore, the prediction accuracy of the proposed method is improved with the increase of the number of illuminants used, and the proposed method performs the best with 6 illuminants.
Oct. 01, 2021Vol. 41 Issue 10 3281 (2021)
Yu-yang LI, Yan-ni GUO, Jun-yu ZHU, Lei ZHOU, Yong-qiang ZHOU, and Chun-hua HU
In this paper, water samples were taken from Lake Chaohu in January (dry), April (wet-to-dry transition), and July (wet) to explore the spectral composition and distribution characteristics of chromophoric dissolved organic matter (CDOM) under different hydrologic conditions. Our results showed that there was no significant difference between the mean of dissolved organic carbon (DOC) in the wet season (3.90±0.40) mg·L-1 and in the dry season (3.89±0.19) mg·L-1. The mean spectral slope of CDOM, i. e. S275~295 in the wet season (21.48±1.56) μm-1was significantly higher than that in the dry season (19.24±0.98) μm-1 (t-test, pa, and DOC (pp<0.05). There were seasonal differences in the optical component and sources of CDOM in Chaohu. In the wet season, terrestrial humic-rich CDOM contributed primarily while in the wet-to-dry transition season, autochthonous CDOM derived from algal degradation contributed to the lake’s CDOM pool. In order to protect the water quality of the lake effectively, certain control measures should be carried out in the watersheds of the Shiwuli River and the Nanfei River.
Oct. 01, 2021Vol. 41 Issue 10 3286 (2021)
Jing DU, Tao JIN, Feng-dan HU, Chi ZHANG, Tie-quan ZHU, Chang-fa ZHAN, Nai-sheng LI, Zheng JIA, and Yue CHEN
The “Xiaobaijiao Ⅰ” shipwreck is a wooden commercial vessel designed for ocean-going, which sank in the Daoguang Reign of the Qing Dynasty (1821—1850 AD). Its hull structure of “the combination of Chinese and Western” has caught society’s attention. The desalination protection treatment mainly uses EDTA-2NA as completing agent. NaOH is prepared into a neutral solution, static water immersion and deionized water circulation are coordinated, and the desalting solution is changed periodically. In this paper, we used spectrophotometer, Scanning Electron Microscope-Energy Dispersive Spectrometer (SEM-EDS), Elemental Analyzer-Isotope Ratio Mass Spectrometry, Inductively Coupled Plasma Mass Spectrometry (ICP-MS) and Ion Chromatography (IC) to observe and test the characteristic hull components in desalting and the desalting solution samples of “Xiaobaijiao Ⅰ” for one year, in order to evaluate the desalting effects. The spectrophotometer results showed that the overall color distinct trend of the hull components of “Xiaobaijiao Ⅰ” is relatively stable, and the color difference changes are not obvious. Scanning Electron Microscope-Energy Dispersive Spectrometer (SEM-EDS) test results show that the iron sulfide in the form of spherical particles is significantly reduced, and the iron sulfide is effectively removed. Elemental Analyzer-Isotope Ratio Mass Spectrometry and Inductively Coupled Plasma Mass Spectrometry (ICP-MS) test results show that the sulfur in the components is reduced to about 1 Wt%, and the iron in the desalting solution is overall low, the fluctuation range is not obvious, and it shows a slow downward trend. The removal rate of iron in the half section is decreased. Ion Chromatography (IC) showed that the content of $SO^{2-}_{4}$ in the desalting solution was very low and the change was small. K+, Mg2+, and Ca2+ are undetectable. The relatively high Cl- and Na+ content is explained by the two ions in the desalting reagent. Stopping the reagent and changing with deionized water can effectively reduce the content. Although the content of Cl- and Na+ fluctuates, the total amount of desalination has a minor change over one year, and a large amount of soluble salt has been eliminated.
Oct. 01, 2021Vol. 41 Issue 10 3294 (2021)
Shi-yu DENG, Cheng-zhi LIU, Yong TAN, De-long LIU, Chun-xu JIANG, Zhe KANG, Zhen-wei LI, Cun-bo FAN, Cheng-wei ZHU, Nan ZHANG, Long CHEN, Bing-li NIU, and Zhong LÜ
With the ever-increasing space activities and the rapid increase in the number of space debris, it is especially important to catalog and identify unknown space debris. Because rocket bodies, artificial satellites and their fragments are exposed in space, their surface materials’ physical and chemical properties will undergo major changes. At present, the research on the surface materials of space targets is mainly concentrated in ground laboratories, and it is impossible to judge the state changes in deep space accurately. Using a large field of view space target photoelectric telescope and spectrum test terminal. The spectral characteristics of space targets can be studied in real-time, and the influence of material characteristics changes on target characteristics recognition can be further explored. In this study, by using the Changchun Observatory of National Astronomical Observators’s 1.2 m space target photoelectric telescope and related spectrum test terminal, combined with image preprocessing software to obtain the hyperspectral image of the space target, and using the astronomical method IRAF to extract the spectral one-dimensional data, obtain analyze data. Partial least squares method is used to inversely analyze the area ratio and confidence of surface materials. In the experiment, the spectral data of 6 space targets were inverted separately. The inversion results of 6 commonly used aviation materials showed that all targets could resolve at least 2 materials. The common inversion showed a golden insulation film, which is a certain surface of the space target. One of the materials contained has a higher surface area ratio, and the results were approximately at 0.75, 0.78, 0.78, 0.59, 0.71, 0.45. Mainly, 4 targets appeared carbon fiber board. The results was approximately at 0.19, 0.22, 0.07, 0.24; 3 targets appeared gallium arsenide, the results were approximately at 0.07, 0.15, 0.17; 2 targets appeared Si, the result were approximately at 0.29, 0.55. And the confidence levels are approximately at 84.7%, 80.4%, 84.1%, 82.8%, 82.6%, 79.6%. The experimental results show that the observation method is reliable, and the research results in the field of space target observation technology, data acquisition, research analysis, etc. have a reference role for subsequent in-depth exploration. The experimental results and the source of the space target are highly self-consistent, the research method is simple and feasible, and the compatibility with traditional optical observations is good. This method expands the research field of precision tracking space target observation. It has the scientific significance of analyzing the space environment where the target is located, and has the application prospect of the safe operation of space targets.
Oct. 01, 2021Vol. 41 Issue 10 3299 (2021)
Zheng-kai LI, Lei CHEN, Mei-qi WANG, Peng SONG, Kun YANG, and Wen ZENG
To gain a deeper understanding of the electron transport process and chemical reaction process in the plasma jet. A needle-ring plasma generator generated a stable plasma jet- at a discharge frequency of 10 kHz and an atmospheric pressure. The types of active particles, electron excitation temperature and plasma vibration temperature of atmospheric pressure argon/air plasma jet under different applied peak voltages were diagnosed by emission spectroscopy. The results show that the main active particles in the atmospheric pressure argon/air plasma jet are the second positive band system of N2, Ar Ⅰ atoms and a small number of oxygen atoms, and the relative spectral intensity of the second positive band system of N2 is the strongest and the most clear. The first negative band line of $N^{+}_{2}$ was not found in the emission spectrum of this experiment, which shows that there are almost no free electrons with electron energy higher than 18.76eV in the argon/air plasma jet. Plasma electron excitation temperature was calculated using5 spectral lines with a large difference in excitation energy of Ar Ⅰ atoms. The electron excitation temperature was between 7 000 and 11 000 K. With the increase of the applied peak voltage, the electron excitation temperature showed a trend of increasing first and then decreasing. The plasma vibration temperature was diagnosed by the second positive band system of N2, and it was found that the vibration temperature of the atmospheric pressure argon/air plasma jet was between 3 000 and 4 500 K, which decreased with the increase of the applied peak voltage. This means that although the increase in peak voltage can effectively increase the kinetic energy of free electrons, when the electron kinetic energy is large, the interaction time between free electrons and nitrogen molecules will be shortened, and the collision energy transfer cross section between the two will be reduced. So the plasma vibration temperature shows a downward trend.
Oct. 01, 2021Vol. 41 Issue 10 3307 (2021)
Refat Moamen S., Salman Mahmoud, El-Didamony Akram M., Fetooh Hammad, Abd El-Maksoud Eman S.E., and El-Sayed Mohamed Y.
The four isolates solid complexes: [La(RHC)(NO3)2]·3H2O, [Nd(RHC)(NO3)2]·4H2O, [Eu(RHC)(NO3)2]·2H2O, and [Ce(RHC)(NO3)2]·5H2O that obtained by the reaction of the nitrate salts of the Ce(Ⅲ), Eu(Ⅲ), Nd(Ⅲ) and La(Ⅲ) ions and rhodamie C (RHC) ligand were interpretative using elemental analysis (C, H and N), molar conductivity, infrared, electronic, fluorescence and 1H-NMR spectra to achieve the speculated suitable formula. The low molar conductance values of the synthesized RHC complexes concluded the non-electrolytic behavior. The infrared spectra recorded the absence of stretching vibration ν(OH) of the —COOH and presence of two new vibration bands at 1 597~1 601 and 1 383~1 399 cm-1 which were assigned to νas(COO-) and νs(COO-). The difference between them revealed that the carboxylate group acts as a bidentate ligand. 1HNMR spectra of Europium and lanthanum(Ⅲ) complexes were supported the FTIR results based on the absent of proton of the carboxylic group. Therefore, the microanalytical and spectroscopic results deduced that RHC acts as a monobasic bidentate ligand, and coordinated to the central metal(Ⅲ) ions via the two oxygen atoms of deprotonated carboxylic group. Fluorescence studies were performed on the metal complexes of Ce3+, Tb3+, Th4+, Gd3+ and La3+, that referred a quenching in the fluorescene intensity of rhodamine C in the aqueous state after complexation. The antimicrobial assessment against some kind of bacteria and fungi were also checked and recorded enhancement in case of their complexes.
Oct. 01, 2021Vol. 41 Issue 10 3311 (2021)
El-Megharbel Samy M., and Refat Moamen S.
Clidinium is a synthetic anticholinergic agent which has been shown in experimental and clinical studies to have an antispasmodic and antisecretory effect on the gastrointestinal tract. Inhibits the muscarinic effects of acetylcholine at neurotransmitter sites after parasympathetic ganglia. It is used to treat peptic ulcer disease and to help relieve stomach or stomach cramps or cramps due to abdominal cramps, diverticulitis, and irritable bowel syndrome. Mononuclear complexes of the manganese(Ⅱ), nickel(Ⅱ) and mercury(Ⅱ) with clidinium bromide drug (C22H26NO3) types [M(C22H25NO3)2(H2O)4] and [Hg(C22H25NO3)2(H2O)2] where M=Mn (Ⅱ) and Ni(Ⅱ), have been synthesized and characterized on the basis of elemental analysis, conductivity measurements, magnetic, electronic, 1H-NMR and infrared spectral studies. The complexes confirm to 1:2 stoichiometry and are non-electrolytes. The clidinium drug ligand (C22H26NO3) act as a deprotonated monovalent monodentate chelate coordinating through hydroxyl oxygen where IR spectral bands of clidinium bromide shows a band at 3 226 cm-1 assigned to the OH group stretching frequency, this band ν(O—H) stretching vibration motion is disappeared in case of the infrared spectra of the Mn(Ⅱ), Ni(Ⅱ), and Hg(Ⅱ) complexes suggesting the involvement of the oxygen atom of the deprotonated OH group of clidinium ligand in complexation. The band for the ν(C—O) of alcoholic group of clidinium that appears at 1 240 cm-1 has blue shifted after complexity, indicating the participation of the alcoholic group in the coordination . 1H NMR spectrum for clidinium bromide show a singlet peak at 3.65 ppm due to proton of OH group which isn’t observed in the spectrum of mercury(Ⅱ) complex referring to the deprotonation of OH group and participated in the complexation. Based on electronic spectra, IR spectra and magnetic moment measurements; six coordinated octahedral structures have been proposed for the manganese and nickel(Ⅱ) complexes, while mercury(Ⅱ) complex has a four coordinated geometry. Thermogravimetric analyses studies revealed the presence of coordinated water molecules. For instance the X-ray powder diffraction pattern and scanning electronic microscopy for the Hg(Ⅱ) complex deduced that it was isolated in nanostructured with crystallinity form.
Oct. 01, 2021Vol. 41 Issue 10 3316 (2021)
© Copyright 2018-2021 | Chinese Laser Press.
All Rights Reserved 沪ICP备15018463号-20