


 View fulltext

2020
Volume: 40 Issue 10
52 Article(s)

Jie CHEN, Xian-mei QIAN, Qiang LIU, Jian-jie ZHENG, Wen-yue ZHU, and Xue-bin LI
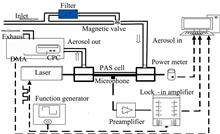
Absorption of atmospheric aerosol is an important factor affecting global climate change and local weather. Characteristics of aerosol optical absorption in the near infrared wavelength have attracted more and more attention to the development of optoelectronic engineering. Based on photoacoustic spectroscopy (PAS), a set of optical absorption coefficient (OAC) measurement device for aerosol at 1 064 nm wavelength was built. OAC and particle size distribution have obtained by the photoacoustic spectrometer and scanning mobility particle sizer spectrometer (SMPS) on Science Island (near suburban of Hefei) for 9 days. Firstly, the correlation between OAC and particle number concentration was analyzed based on the measured data. The results show that the OAC had a strong correlation with number concentration and the correlation coefficient varied between 0.62 and 0.99 while the aerosol particle size distribution was relatively stable. Secondly, the particle size growth process was observed at night time. In this process, the number concentration of aerosol was varied slightly (less than 4%), but OAC increased from 6 Mm-1 to 17 Mm-1 with the growth of aerosol particles size from ~120 nm to ~175 nm. With the results of the theoretical fitting and analysis of the correlation between the absorption cross section and the average particle diameter, aerosol particles in this process were found to be surface absorbers approximately. Finally, combined with the air quality index (AQI) released by environmental protection administration, the diurnal variation of the OAC and particle size distribution of aerosol particles in different weather, were compared and analyzed. OAC and particle number concentration indicates a strong correlation with the weather and environmental condition, such as haze, traffic, rain. In haze day, OAC increased gradually with the increase of larger portion and the total particle number concentration in the air. In sunny days, the exhaust emission of vehicles on nearby roads during traffic busy caused sharply growth of the fine particles in the air in a short period of time, resulting in a significant increase in the OAC. In a rainy day, precipitation has a clear cleaning effect on aerosol particles, which reduces the number of particles in the air dramatically, leading to a decrease in the OAC. This observation experiment and the analysis verified the reliability of the photoacoustic spectrometer. It also accumulates experience for the future study on the aerosol optical absorption characteristics in near infrared wavelength.
Oct. 01, 2020Vol. 40 Issue 10 2989 (2020)
Liu-jie WAN, Chao ZHEN, Zong-jia QIU, Kang LI, Feng-xiang MA, Dong HAN, and Guo-qiang ZHANG
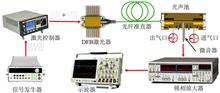
Photoacoustic spectrum(PAS) gas detection technology based on wavelength modulated spectrum signal second harmonic component detection has been widely used in electric power, chemical and medical industry. Although the second harmonic component detection technology can effectively reduce the related noise in the photoacoustic signal, there is still non-correlation noise in the second harmonic signal, which affects the detection ability of the detection system to trace gas and the accuracy of the test results. In order to study how to weaken the influence of the non-correlated noise of the photoacoustic spectrum detection system on the second harmonic signal, improve the detection system of the limit of detection, improve the measurement accuracy, this paper built a set of with tunable distributed feedback (DFB) semiconductor laser is first longitudinal resonant photoacoustic spectrum of excitation light source gas detection system, first put forward using fast Fourier transform (FFT) to light the second harmonic signal filtering of the new method. Firstly, the sawtooth scanning signal frequency is optimized according to the noise spectrum of the gas photoacoustic spectrum detection system, so as to minimize the influence of background noise of the detection system on the optical acoustic detection signal. Then, the FFT filter is used to extract the fundamental wave component of the optical acoustic second harmonic signal of the same frequency as the scanning sawtooth wave. Although the amplitude of the extracted fundamental wave component is smaller than the maximum of the second harmonic component of the photoacoustic signal, the background noise of the photoacoustic detection system decreases more, so the purpose of improving the minimum detection limit of the photoacoustic detection system is realized. By analyzing and comparing the test results of C2H2/N2 mixed gas with the concentrations of 102, 75.1, 50, 30.3, 15.3, 7.7, 1, 0.79, 0.57, 0.35 and 0.17 μL·L-1, the test results are very stable after FFT is used to filter the photoacoustic second harmonic signal. When the SNR was 3, the minimum detection limit of the system was reduced from 0.43 μL·L-1 to 0.030 6 μL·L-1. This shows that FFT filtering is very effective in eliminating the non-correlated noise in the second harmonic component of wavelength modulated spectral signal, which can improve the measurement accuracy and improve the minimum detection limit of the photoacoustic spectrum detection system. The research results in this paper can provide some references for the application of wavelength modulated spectrum signal second harmonic component detection technology.
Oct. 01, 2020Vol. 40 Issue 10 2996 (2020)
Li-cheng LI, Hai-yang GAO, Ling-bing BU, Qi-lin ZHANG, and Zhen WANG
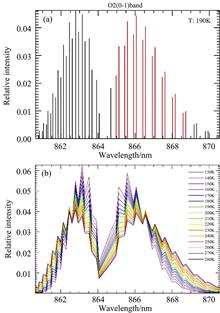
The Mesosphere and Lower Thermosphere (MLT) is a transitional region between the neutral atmosphere and the ionosphere, as well as an important coupling region where many dynamic processes including gravity waves, tidal waves and planetary waves are active. Based on the Mesopause Airglow Spectral Photometer (MASP), a novel instrument developed by our group, this work provides the inversion method in detail for deriving rotational temperature from the emission of the airglow O2(0-1) band. MASP instrument consists of an aperture, a main achromatic doublet lens, a narrow-band interference filter, an imaging lens and a cooled CCD detector. The optical elements and CCD detector are connected by four black alumina sleeves which are fixed on the optical breadboard by means of several metal supports and precise clasps. The field of view (FOV) for MASP is ±13.6°, and the detection target is a thin airglow layer at an altitude of about 94 km with a thickness of 3~6 km. Thus, the area of the zenith direction projected by the FOV at this altitude is about 44 km in diameter so that MASP is designed to detect the average temperature of this area. Based on the optical principle of MASP, the spectral characteristics of the airglow O2(0-1) band and the instrument parameters by calibrations, we constructed the forward model to calculate synthetic spectrum from the forward image. We then describe the detailed process of the inversion algorithm, including the eliminations of dark noise, cosmic rays, moonlight images and background scattered signal of the continuous spectrum. In addition, the calculation method of the actual observed synthetic spectrum, the temperature inversion process and the evaluation of the error are provided respectively. The MASP has been conducting routine observations on the field platform of Nanjing University of Information Engineering since September 2018. At present, more than thirty nights of data have been obtained. The observation results in this paper show two whole night observation cases and the mean value averaged by 13 sets of valid data in October 2018. The general trend shows that the observed temperature ranges from 170 to 220 K, and the error ranges from (+1.8 K) to (+4.3 K). Compared with the data of the MSISE-00 empirical model, the temperature trend has a good consistency, which verifies the validity and accuracy of the inversion method. MASP has compact structure, stable performance and easy maintenance. It is thereforesuitable for multi-station networking observation.
Oct. 01, 2020Vol. 40 Issue 10 3002 (2020)
Xiang LI, Zhong-feng LI, Jun GAO, Xia WANG, Xin ZHANG, and Zhuo-yong ZHANG
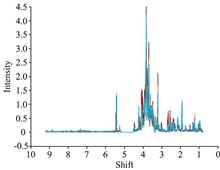
The research of the Seed germination progress could provide important scientific information and corresponding database for food crops. As one of the primary agricultural products, mung bean is nutrients-rich and can be eaten directly, manufactured as products or cultured to bean sprouts. In order to study the changes of metabolites in plants during the process of metabolism, we extracted the metabolites from the germination samples of mung bean seeds at 24 h, 36 h and 48 h, and analyzed the changes of metabolites in mung bean seeds by 1H-NMR. Except for its non-destructive and stable characteristics, 1H-NMR still has some shortcomings of low sensitivity and low resolution in the spectrum. In complex systems, there is overlap in spectrum bands for different compounds, which makes it difficult to give enough information on metabolites. Therefore, chemometric methods are needed to interpret the information in NMR spectroscopy. In this paper, multivariate curve resolution-alternating least squares (MCR-ALS) was used for data processing and analysis of the metabolite data based on NMR. MCR is a bilinear model, which can decompose the given data matrix to the pure spectra and their corresponding relative concentration. MCR can provide physical and chemical meaningful results, which facilitate the analysis of metabolites based on the corresponding spectral library and provide their concentration changes. In this paper, besides the non-negative constraints, selectivity constraint was also used in MCR iteration to reduce the rotation ambiguity in MCR modeling. The changes of metabolites and differential metabolites in mung bean at different germination stages were analyzed. In the determination of samples without certain metabolites, the 1H-NMR spectra are constrained to zero. From the MCR results, we can find that acetate and choline exist in the pre-germination stage of mung bean, and increasing in the late stage of germination. Sucrose, valine, α-ketoglutarate tryptophan, and phenylalanine inosine do not exist in the pre-germination stage, while they gradually increased during the seed germination of the samples. OMSI, phosphorylcholine and α-glucose exist before the germination and increases in the pre-germination stage. Until the late stage of germination, they were consumed and the content decreased. Lactate, 2-amino-4-oxopentanoic acid, Malic acid, citric acid, choline, stachyose, α-galactose, N1-methylnicotinic acid always exist during the germination of mung bean, and there is no significant change.
Oct. 01, 2020Vol. 40 Issue 10 3010 (2020)
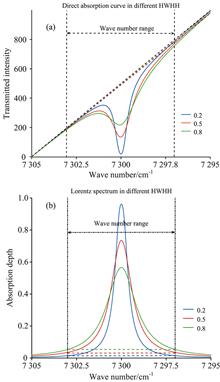
Hao CHEN, Yu JU, Li HAN, and Yang CHANG
Tunable Semiconductor Laser Spectroscopy (TDLAS) is a rapidly developing spectroscopic detection technology, which is widely used to detect flammable and explosive hazardous gases in the industrial environment. These hazardous gases are often mixed by various gases. The direct absorption spectrum of gas changes under different background gases which causes errors in the calculation. This paper proposes a new algorithm of mixed gases under different background gases. The algorithms of mixed gas concentration under different background gases are discussed, the reasons for Lorentz absorption spectrum changing under different background gases are studied. The reasons for errors of peak algorithm and integral algorithm in calculating mixed gas concentration are analyzed. A new method is proposed to fit the Lorentz absorption spectrum by Levenberg-Marquardt algorithm and to characterize the concentration of mixture by the quadratic fitting of area coefficient and measured concentration. In the experiment, a gas detection system based on TDLAS technology was built. The laser with a center wavelength of 1 368.59 nm was used. The length of the gas chamber was 30 cm. The water vapor was used as the gas to be tested. Dry air, nitrogen and argon were used as the background gas. The humidity generator GRZ5013 produces a relative humidity environment of 40% to 80%. Using the measurement results of the Mitchell-s8000 dew-point meter as a reference value, the quadratic fitting relationship between the three parameters (the peak, integral and area coefficients of the dry air as the background gas) and the water vapor concentration of the Mitchell dew-point meter is obtained. The relative errors of the three algorithms in the background of nitrogen and argon were compared. Experiments show that the maximum relative error of the peak, integral and area coefficient algorithms under nitrogen are -11.64%, 2.65% and 1.76%, the minimum errors are -7.79%, -0.56% and -0.54%, and the relative error mean square values are 0.88%, 0.03% and 0.01%. The maximum relative errors of the peak, integral and area coefficient algorithms under argon are -109.27%, -10.13% and 2.96%, and the minimum errors are 73.04%, -5.51% and 1.34%, and the relative error mean square values are 87.51%, 0.61% and 0.06%. The area coefficient is the best concentration algorithm in three with the smallest error and the most accurate results.
Oct. 01, 2020Vol. 40 Issue 10 3015 (2020)
Hui-yan TIAN, Yu LIU, Jiao-qi HUANG, Feng-xin XIE, Guo-rong HUANG, Pu LIAO, Wei-ling FU, and Yang ZHANG
Nucleic acid is the most basic genetic material in life. It is of great significance to carry out a nucleic acid molecular diagnosis to promote the development of human health and medical treatment. Surface-enhanced Raman spectroscopy (SERS), as a rapid, nondestructive testing technique, has the advantages of simple sample preparation, low interference of water, non-invasion, and real-time detection. It has shown great application potential in the fields of nucleic acid detection, pathogenic microorganism detection and tumor accurate molecular diagnosis. Based on the application of clinical examination, a brief tutorial on SERS technical principle and SERS enhancement theory are given first of all. Then the review mainly summarizes the recent trends and developments of SERS in the detection of nucleic acid. The traditional label-free SERS detection is to detect the Raman signal of nucleic acid itself directly, but its sensitivity and specificity can not meet the detection requirements. In the labeled SERS detection, the Raman reporter molecule is connected with the target nucleic acid by DNA probe. The qualitative and quantitative detection of target DNA/RNA is realized by detection and analysis of the Raman reporter molecular signal, which demonstrates the advantage of SERS as “fingerprint” and achieves the purpose of high throughput detection with good control lability and stability. According to different Raman signal amplification methods, the labeled SERS analysis on nucleic acid detection mainly include “sandwich structure”, signal turn “on /off”, and hybridization chain reaction (HCR) signal amplification method, especially the “sandwich structure” detection strategy has the highest sensitivity. These researches have demonstrated that the application of SERS in DNA/RNA detection could over come the shortcoming of traditional methods, and provide a rapid, effective and sensitive analytical tool for real-time monitoring of nucleic acid and accurate real-time diagnosis of clinical diseases. At the same time, there are still great challenges for the application of SERS technology in clinical application: (1) The poor binding stability of Raman reporter molecules to nanoparticles makes it difficult to realize the high sensitivity SERS probe which can be stored stably for a long time. (2) the composition of clinical, biological samples is complex, and there are many interference factors to SERS detection signal, so it is necessary to select effective data analysis methods. (3) The research of highly sensitive, easy to operate, low-cost Raman spectrometer is the key to transform SERS technology into practical application. In the future, with the deepening of SERS and the cross-development of multi-disciplinary, SER technology is expected to be widely used in nucleic acid detection and the whole biomedical detection field, and provide a powerful analytical technology for life science.
Oct. 01, 2020Vol. 40 Issue 10 3021 (2020)

Qing LI, Xiao-jian YAN, Kui ZHAO, Lan LI, Shan-gui PENG, Xiao LUO, Yong-sheng WEN, and Zhu-yun YAN
The use of cloud-connected infrared spectroscopy technology combined with chemometrics to identify the rarest saffron and its commonly encountered adulterants (carthami flos, corn silk, nelumbinis stamen, chrysanthemi flos, pulp) and adulterated saffron, and quantitative determination of adulterant in saffron. Near-infrared spectra of saffron, adulterants, and adulterated saffron were collected by using the PV500R-I portable near-infrared instrument controlled by mobile phone. The first derivative, second derivative, third derivative, standard normal variable transformation and multiplicative scatter correction are used to preprocess the original spectral data. Partial Least Squares Discrimination Analysis was used to establish the identification model of saffron and its adulterant, and saffron and adulterated saffron. The results show that an optimal recognition model can distinguish saffron and its five kinds of adulterant from each other completely; the lowest 93% external prediction accuracy of saffron and five kinds of samples of adulterated saffron can be achieved step-by-step by two optimal recognition models, and the adulteration recognition level of saffron mixed with carthami flos, corn silk, nelumbinis stamen, chrysanthemi flos and pulp are 0.5%, 0.5%, 4.0%, 0.5% and 0.5%, respectively. Partial least squares regression was used to establish quantitative prediction models for the five kinds adulterant in saffron. The external prediction correlation coefficient range of the final model was 0.920~0.999, and RMSEP range was 0.005~0.044, and when the saffron mixed with carthami flos, chrysanthemi flos, nelumbinis stamen, pulp and corn silk are more than 8%, its external prediction relative error is less than 8%, 8%, 3%, 10% and 5% respectively, which indicated that the quantitative prediction model could be used to predict the amount of adulterant in saffron. To sum up, the identification method based on cloud connected portable near-infrared spectroscopy and the prediction method of the amount of adulterant is fast and accurate, economic and environmental protection, and can meet the requirements of quick and non-destructive identification of saffron on site.
Oct. 01, 2020Vol. 40 Issue 10 3029 (2020)
Xiao-hong LIU, Hua DENG, Lin CHANG, Wei ZHANG, and Shan JIANG
The Environmental estrogen is an exogenous endocrine disruptor which can be enriched in organisms, and usually exits in the environment at a low concentration. Meanwhile, it can interfere with the normal function of the endocrine system and induce the multiple organism pathological changes. Therefore, the detection of environmental estrogen at low concentration with high specificity is important. Surface enhanced Raman scattering (SERS) is a technique with high sensitivity enabling trace amount analysis and even single-molecule level detection of the target molecule. This paper aims to summarize the recent development of environmental estrogen (such as estradiol, polychlorinated biphenyls, bisphenol A, etc.) detected by using SERS technology. Firstly, the SERS substrates without modification are used for direct detection. Secondly, the modified substrates (such as cyclodextrin, molecularly imprinted polymer, antigen and antibody and nucleic acid aptamer, etc.) are used for highly specific and sensitive detection of environmental estrogens. Finally, the development of SERS in environmental estrogen detection are summarized and prospected.
Oct. 01, 2020Vol. 40 Issue 10 3038 (2020)
De-hong YANG, Lei-lei ZHANG, and Cheng ZHU
Food safety issues, especially those related to pesticides and antibiotics residues, have aroused widespread concern in recent years. Therefore, the detection of pesticides, antibiotics and other harmful residues in agricultural products is an indispensable step for guaranteeing the national food safety, consumer's health and promoting economic and trade development. As an emerging detection method, Surface-enhanced Raman scattering (SERS) has the advantages of simple operation, short operation time and high sensitivity. A brief introduction on SERS, the SERS enhancement theory and SERS active substrate is given first of all. The paper focuses on the current research status of SERS in the field of pesticides residue detection in agricultural products (such as animal meat, aquatic products, fruits and vegetables and other agricultural products, etc.). Traditional colloids substrate has the characteristics of low cost, easy synthesis and excellent Performance of SERS. In order to improve the enhancement effect, many researchers optimize the size and morphology of the substrate to form flower-shaped nanostructure, star nanostructure, rod nanostructure and chain nanostructure and other forms of colloids particles. In order to improve the performance and stability of colloidal substrates, a series of core-shell nanostructures have been developed based on the synergy of composite materials. The solid substrate structure is stable and has good consistency and repeatability. There are three kinds of flexible substrates, SERS substrate based on flexible devices, SERS substrate based on flexible polymer and SERS substrate based on flexible carbon material, which has the advantages of excellent mechanical properties, not easy to damage and low cost, which is conducive to the realization of minimally invasive or non-destructive detection. The review summarized and compared these different studies of SERS methods, which could be used to detect pesticides, antibiotics and other harmful residues in agricultural products based on different substrates, different agricultural products, different pesticides. The sensitivity of the current study is relatively high, which shows the application potential of SERS technology combined with nano substrates in detecting pesticide residues in a complex matrix. At the same time, there are still great challenges for the application of SERS technology in the pesticides residue analysis.(1)Low pesticides residues and uneven distribution of pesticides in agricultural products lead to relatively weak Raman signals, which are susceptible to fluorescence and background noise.(2)The complex matrix of agricultural products has a great influence on the SERS spectral data.(3)The current SERS detection method has not been standardized, and the results of different detection schemes are quite different. Surface-enhanced Raman scattering, whether it is the detection technology or the support theory is progressing, are given for a broader application prospect in food safety.
Oct. 01, 2020Vol. 40 Issue 10 3048 (2020)
Xue-yan SONG, Yan LI, Qi-ying XIA, and Xue-hai JU
Dihydroxylammonium 5,5’-bistetrazole-1,1’-diolate (TKX-50) is a newly synthesized high energetic explosives. Density functional theory calculations were carried out to study the terahertz (THz) spectra of TKX-50 and its pressure and isotope effects. The results show that TKX-50 has four peaks in low frequencies of 1.17, 1.19, 2.50 and 2.95 THz, and six absorption peaks at high frequencies of 3.87, 4.79, 5.33, 5.75, 6.65 and 7.85 THz. Among them, four peaks at 1.17, 3.87, 5.33 and 6.65 THz have large absorption intensities. Vibrational analyses of normal modes show that the absorption peak at 1.17 THz belongs to the N—H…O stretching; and those at 3.87, 5.33 and 6.65 THz are attributed to the NH3 rocking. In the 0~4.0 THz, the absorption peaks of 1.17, 1.91, 2.50, 2.95 and 3.87 THz for TKX-50 correspond to the peaks of 1.13, 1.85, 2.44, 2.91 and 3.63 THz for the deuterated TKX-50, respectively. The deuteration of TKX-50 brings about the red shifts of THz spectra along with the absorption intensities decreasing at the same time. In addition, the peaks at 4.79 THz and 5.33 THz for TKX-50, which are assigned to the rocking of NH3, become overlapped and redshifted to 4.66 THz due to deuteration. As the pressure changes, the variations of molecular distances are larger than those of bond lengths. The intermolecular O…H distance generally decreases with increasing pressure, especially the NO…HN distance. However, the lengths of the O—H and N—H bonds irregularly vary with pressures. When the pressure increases from 1 atm to 30 GPa, the peaks at 4.79, 5.33 and 5.75 THz will red shift and overlap, accompanied by a larger change of absorption intensity. Then at 30 GPa, the absorption peaks overlap to a weak peak at 4.54 THz. With increasing pressure, the absorption at 6.65 THz is slightly blue shifted, while the peak at 7.85 THz is red shifted firstly but then gradually blue shifted. This is because the atomic equilibrium distance decreases with increasing pressure, leading to an increase in bond strength; in addition, when the crystal is severely compressed, the steric hindrance for the NH3 rocking becomes large, and large potential energy needs to overcome for the rocking, resulting in a blue shift of THz absorption. The low frequency peaks irregularly vary with pressures, mainly because the length of the N—H bond varies irregularly with pressures. Since the vibrational movements of the molecule are constrained by the steric hindrance at high pressures, the THz absorption intensities of TKX-50 decrease with increasing pressure. The above studies not only reveal the THz spectral characteristics of TKX-50 and the effects of pressure and isotope but also provide the theoretical basis for further study of the optical properties in THz region and their application in rapid penetrable detections for similar energetic materials.
Oct. 01, 2020Vol. 40 Issue 10 3056 (2020)
Jing LIU, Hai-shun LIU, Jian ZUO, Cun-lin ZHANG, Yue-jin ZHAO, and Mei-yan LIANG
L-Phenylalanine and L-Tyrosineplay essential roles in synthesizing neurotransmitters and hormones. The two amino acids have similar structures which lead to an obviously functional distinction between the two amino acids. Previous studies have shown that there are remarkable differences between the two amino acids on low-frequency vibrations. Recently, terahertz (THz) spectroscopy has been proven to be a useful technique on studying low-frequency dynamic of biologic molecules. Many multivariate calibration methods have been successfully applied to quantitative analysis multi-components spectra data due to the linear behaviors revealed by terahertz absorption spectra. However, the predictive performances of traditional calibration techniques are sometimes unsatisfied as only a single model is built between spectra and targets to predict the unknown samples. Thus, the ensemble modeling method with better accuracy came into being. The empirical mode decomposition (EMD) method, firstly proposed by Dr. Huang in 1998, is used to decompose the signal into a set of intrinsic mode functions (IMF) self-adaptively, which is widely applied in signal and spectra processing. We proposed an empirical mode decomposition (EMD) based partial least squares (PLS) method for terahertz spectra quantitative analysis on amino acids mixture with various concentrations. The terahertz time signals were decomposed into a series of intrinsic mode functions (IMF) with different frequencies by the EMD method. The several top IMFs (from 2 to 5) based absorption spectra were obtained for quantitative analysis by employing PLS. The predicted results indicated that the top four IMFs based absorption spectra acquired higher R (0.996 1) and lowered RMSEP (0.019 8) compared tothe single PLS regression and theother top several IMFs’results. Thus, the successful application with EMD-PLS method manifests the effectiveness in quantitative analysis of binary mixtures within the THz region.
Oct. 01, 2020Vol. 40 Issue 10 3061 (2020)
Hong-zhen ZHANG, Ming-xia HE, Li-li SHI, and Peng-fei WANG
The coating is an indispensable process in automobile, marine, aerospace manufacturing and other industries. Reasonable film thickness is not only conducive to the stability of painting quality but also conducive to saving paint and reducing painting cost. With the advent of industrial 4.0 era, it is an inevitable trend to realize online, non-contact, non-destructive and high-precision detection. Compared with traditional measurement methods, THz thickness measurement method could perform the non-contact online measurement. However, when the optical thickness of the sample is small, terahertz reflection pulses will overlap in the time domain, and it is impossible to obtain the exact flight time directly from the peak position of the pulses. In order to solve this problem, a thickness measurement method based on reflective terahertz time domain spectroscopy system and the stochastic optimization algorithm are proposed. A multivariate regression model of the terahertz reflection pulses is established. With the application of the Differential Evolution algorithm, the thickness of the sample is calculated automatically. The convergence of the differential evolution algorithm was verified by calculating the results from the same time-domain signal several times. The measurement error introduced by the angle error between the normal direction of the substrate and the direction of terahertz probe is also evaluated. In addition, the feasibility of time-of-flight (TOF) method for measuring the thickness of each layer in multi-layer structure samples is studied. The measurement results show that the calculated results of Differential Evolution algorithm are stable. The uncertainty of thicknesses of zinc dipping paint, black paint and base paint are 0.22 μm(223.87 μm), 0.05 μm(54.18 μm) and 0.08 μm(284.95 μm), respectively. The uncertainty of refractive indexes is 0.004(3.967), 0.002(2.091) and 0.001(1.769), respectively. For zinc dipping paint, angle error of 1° leads to a measurement error of 0.073. Due to the existence of multiple reflection effects, although the method can find the flight time of each reflection pulse in the terahertz measurement signal of many layers of samples, it is impossible to distinguish which reflection interface the reflection pulse comes from, so that the thickness of each layer coating cannot be solved. The analysis shows that the thickness measurement method based on the time-of-flight principle is simple and easy, and the thickness of the single-layer sample can be measured more accurately, which is not sensitive to the angle error. When expanding to the measurement of multi-layer samples, the method has greater limitations. It is impossible to distinguish multiple reflection pulses in the time domain, and is not feasible to calculate the thickness of each layer.
Oct. 01, 2020Vol. 40 Issue 10 3066 (2020)
Bao-long CAO, Ming-hao WANG, Xue LI, and Shu-fen CHEN
Organic electroluminescent devices (OLEDs) have the advantages of low energy consumption, high efficiency, high color gamut, etc., and have shown great application prospects in the current display industry. In the current market, organic light-emitting display devices are mainly manufactured by evaporation. In various preparation technologies of OLEDs, inkjet printing can effectively improve material utilization and reduce resource waste compared with current mainstream evaporation methods. However, in the actual operation process of preparing high-quality film by inkjet printing, researchers found that the filming defect of “coffee ring” effect often appears on the surface of the film. The existence of such defects not only affects the quality of the film layer and the performance of the device, but also restricts the further development of inkjet printing technology to some extent. In view of the main causes of the “coffee ring” phenomenon, we mainly analyze and summarize the previous research work from the three aspects of suppressing the capillary flow inside the droplet, increasing the Marangoni flow inward and controlling the three-phase line slip. Through the analysis and summary of these research work, we found that the main purpose is to suppress the capillary flow by three ways: firstly, increase the capillary flow resistance, secondly, adjust the evaporation condition of the solution, and also rely on the interaction between particles can achieve the purpose of inhibiting capillary flow; At the same time, there are two mainstream methods to increase the inward Marangoni flow, one is to optimize the Marangoni flow by changing the solvent composition to change the surface tension of the droplets, and the other is to increase the surfactant Marangoni stream by adding surfactants; For the control of three-phase line slip, we have summarized three methods by analyzing previous studies. One is to use electrowetting to treat droplets, the other is to change the viscous effect between particles and the substrate, and the three-phase line slip is controlled by surface treatment of the substrate. Finally, based on the above series of optimizations and improvements, under the continuous efforts of researchers, the uniform control of inkjet printing films has been basically achieved.
Oct. 01, 2020Vol. 40 Issue 10 3071 (2020)
Zhao LI, Yong-feng WANG, Jing CAO, Kun-yao WU, and Ya-nan WANG
ScVO4:Eu3+ red phosphor was prepared using-high temperature solid-state method. The phase, morphology and luminescence properties of the samples were characterized by X-ray powder diffraction (XRD), scanning electron microscope (SEM) and photoluminescence spectrum (PL). The results showed that: the synthesized ScVO4:Eu3+ red phosphor was a tetragonal system with near-spherical surface. In the excitation spectrum, the excitation peaks at 382 nm, 395 and 466 nm were attributed to 7F0→5L7, 7F0→5L6 and 7F0→5D2 transitions, respectively. In the emission spectrum, the emission peaks at 598, 622 and 710 nm correspond to 5D0→7F1, 5D0→7F2 and 5D0→7F4 transitions of Eu3+. When Eu3+ has a doping ratio of 7% and is calcined at 1 200 ℃ for 3 h, ScVO4:Eu3+ red phosphor has a CIE color coordinate of (0.671 6, 0.327 3) and fluorescence lifetime of 0.521 ms, which is a kind of high-efficiency red phosphor expected to be used in white LED.
Oct. 01, 2020Vol. 40 Issue 10 3077 (2020)
Ai-ming FENG, Fu-qiang WANG, Hong ZHANG, Peng AN, Yang-hui LI, and Le WANG
White light-emitting diodes (wLEDs) have been considered to be new-generation light sources due to their advantages such as energy-saving, environment-friendly and long lifetime, safety and reliability. Nevertheless, it is the core issue to improve the luminous efficacy of wLED and excavate lighting properties in depth. At present, the commercial way to produce wLEDs are combining a blue-chip with yellow phosphor material as YAG: Ce3+, and the luminescence efficiency of white LED can be effectively improved by improving the luminescence efficiency of phosphor. A novel nanocomposite powder of YAG:Ce3+ coated with anatase nanotitania particles was prepared by sol-gel method using tetrabutyl titanate as the precursor, and the effect of TiO2 nano-particles coating on the luminescence properties of YAG:Ce3+ phosphors were investigated. The phase structure and optical properties of the samples were characterized by X-ray diffractometer, scanning electron microscope and spectrometer. The results have revealed that TiO2 coating YAG:Ce3+ phosphors prepared at different temperatures and different volume ratios (TTBO:H2O) have a significant effect on the fluorescence spectrum of the powder, optimizing preparation temperature is 600 ℃ and TTBO:H2O=2:1 (in volume ratio). The result of the tests showed that TiO2 coating layer around the phosphor surface by the SEM observation, the diffraction peak of anatase is relatively strong, and the separation of the photogenerated e-/h+ pairs can be promoted, leading to increasing quantum efficiency. The Raman spectrum indicated that the energy of localized surface plasmon resonance (LSPR) propagating on the interface at the excitation wavelength of 633 nm, and the intensity of the characteristic peaks at 1 264.10 and 1 283.59 cm-1 were increased. The photoluminescence spectrum indicated that luminescence intensity of TiO2 coating YAG:Ce3+ phosphors were improved 21%, the quantum efficiency has been improved 5.5%, which was by the contribution of the TiO2 localized surface plasmon resonance effect. This study reveals that the localized plasmon effect based on TiO2 could effectively improve the luminescence efficiency of YAG:Ce3+ phosphor, and the application of YAG:Ce3+ phosphor to wLED plays an active role in high efficiency, high power and large lumen condition.
Oct. 01, 2020Vol. 40 Issue 10 3081 (2020)
Qi-xian CHEN, Qi-dan CHEN, and Xue-yuan ZHONG
As the requirement limitation of toxic contaminants such as heavy metals in food and environmental samples is lower and lower, the detection methods developed should be simpler, sensitive and less contaminated. Luminescent carbon dots nanomaterials are a new type of nanomaterials with carbon as a basic skeleton which have been shown low toxicity and excellent fluorescence performance. In our work, low-cost, eco-friendly carbon dots nanomaterial was prepared by simple hydrothermal method using dopamine hydrochloride as carbon source and o-phenylenediamine as a modifier. The carbon dotsemission wavelength was 596 nm (λex=532 nm). The UV-Vis spectra, fluorescence spectra, infrared spectrum and TEM characterization showed that the carbon dots had good optical performance, good dispersion and uniform size (~3 nm). Under the same conditions, the synthesized carbon dots were found selected detection of Hg2+. The detection of mercury is very important, because it is very poisonous and usually presents in the water sample as a form of Hg2+ions, and has even irreversible effect on the human being from the contaminated of bio-products in the water. The Stern-Volmer plot with an upward curvature indicates a bindinginduced quenchingof carbon dots at the presence of Hg2+ ions, andthe range of 0~0.04 μg·mL-1(R2=0.992 4) and 0.6~10 μg·mL-1 (R2=0.993 2) showed good linear correlation. The detection limit was achieved as 0.000 6 μg·mL-1 (S/N=3, n=6) which meet the Chinese guidelines for both drinking water and industrial sewage. The spiked recovery of Hg2+ detection in domestic water samples ranged from 91% to 106% (RSD=0.5 to 1.5). In addition, the biosafety of the prepared carbon dots nanomaterial was further investigated, the results of the MTT for cytotoxicity testing in liver cells showed no significant decrease in cell viability by increasingthe concentration of carbon dotsto 40 μg·mL-1, indicating that the carbon dots nanomaterial were low toxic and eco-friendly. The high-performance near-infrared carbon dots nanomaterial have good potential in the application of environmental monitoring and biosensor.
Oct. 01, 2020Vol. 40 Issue 10 3086 (2020)
Peng LI, Zhi LI, Can XU, and Yu-qiang FANG
GaAs-based triple-junction solar cell has high photoelectric conversion efficiency and is the main material of satellite solar arrays. The scattering spectrum characteristics can be used to assist in determining the solar arrays’ attitudes and satellite working status, which have great significance for space object identification. An automatic scattering spectrum measurement system of space object’s surface materials was established and the scattering spectrum of solar cell samples was measured. The measurement system primarily consists of REFLET 180S and FieldSpec@4 fiber spectrometer. The REFLET 180S can provide a dark environment, a stable light source with spectral range of 400~1 800 nm and a high-precision turntable with 0.01°angular resolution. FieldSpec@4 spectrometer has an advantage of high spectral resolution (3 nm @700 nm, 10 nm @1 400/2 100 nm). According to the strong specular reflection characteristic of the solar cell samples, a standard plane reflector was selected as the calibrator. The incident angles were 5°, 15°, 30°, 45° and 60°, and the reflection angles were plus or minus 2°in the direction of specular reflection with 0.1° angle intervals. The measurement results showed that there were three obvious absorption peaks in the visible (600~900 nm) scattering spectrum of the GaAs-based solar cell, and theses absorption peaks appeared to the left “migration” characteristic with the increase of incident angles, and in the near-infrared (900~1 800 nm) scattering spectrum showed distinct periodic oscillation characteristics. While the scattering spectrum of Si-base solar cell did not have these characteristics. The structure of GaAs-based solar cell was complex, and its physical structure was simplified into a double anti-reflection coating layer and three semiconductor absorptive dielectric layers: a top cell called GaInP layer, a middle cell called GaAs layer, and a substrate cell called Ge layer. Based on the thin-film interference theory, the scattering spectrum of GaAs-based triple-junction solar cell was modeled by the equivalent optical admittance method. The simulation spectrum basically fitted the absorption characteristics in the visible band and the periodic oscillation characteristics in the near-infrared band, which indicated the correctness of the spectral reflectance model established by thin-film interference theory. The influence of different film layers on the scattering spectrum of GaAs-based triple-junction solar cell was analyzed by using the spectral simulation model. The simulation results showed that the main function of the DAR layer was to reduce the spectral reflectance, which had little effect on the shape of the spectral curve. The main function of the Ge layer was to increase the light transmittance and absorption efficiency, which had no effect on the scattering spectrum. GaInP and GaAs layers played a major role in the spectral shape of GaAs-based triple-junction solar cell. GaAs layer was the main reason for the interference characteristics of the scattering spectrum in the near-infrared band. GaInP layer had the main influence on the absorption characteristics in the visible band, and it also modulated the amplitude and frequency of the interference curve in the near-infrared band. The research results can provide data support for satellite solar panel and solar cell debris identification.
Oct. 01, 2020Vol. 40 Issue 10 3092 (2020)
Xi-juan LÜ, and Yun-hong ZHANG
Exploring the repartitioning process of semi-volatile organic compounds (SVOCs) between particles is important for understanding the growth and shrinkage of atmospheric particulates. Optical tweezers-stimulated Raman spectroscopy, compared with other suspension techniques, can not only suspend droplets, but also obtain the chemical composition, structure of droplets and other information according to the conventional Raman scattering spectra of droplets. The radius and refractive index of droplets can be calculated according to stimulated Raman-Mie scattering resonance. The advantages of optical tweezers stimulated Raman spectroscopy are that particle radius can be accurately measured, chemical composition, phase and shape can be controlled, and long-term observation can be realized. In this study, optical tweezers coupled with cavity-enhanced Raman spectroscopy was used to observe the repartitioning of malonic acid between a levitated malonic acid/NaNO3/H2O droplet and surrounding malonic acid /NaNO3/H2O droplets deposited on the inner wall of a chamber with different organic to inorganic molar ratios (OIRs). It was found that when the OIR was 1:1, no NaNO3 crystallization occurred both for levitated and deposited dropletsin the whole relative humidity (RH) range, the radius of the levitated droplet decreased slowly due to the evaporation of malonic acid from the levitated droplet at constant RHs. When the OIRs were 1:2 and 1:3, the radius of the suspension droplets did not decrease but increased gradually when the RH was lower than 52.5% and 58% respectively. This indicated that the repartitioning of malonic acid occurred. The reason was that NaNO3 in the deposited droplets was crystallized when RH was lower than 52.5% for 1:2 or 58% for 1:3. So the vaporpressure of malonic acid at the surface of deposited droplets was higher than that of the levitated droplet which always remained as liquid droplet without NaNO3 crystallization, resulting in the transfer of malonic acid from the deposited ones to the levitated one. This is a good model for explaining the repartitioning process of SVOC among different phase particles states.
Oct. 01, 2020Vol. 40 Issue 10 3098 (2020)
Xiao-yan LIU, Qian YANG, Shu-guo CHEN, Lian-bo HU, Fang-yi ZONG, and Qiao-jun LIU
Jiaozhou Bay, located in the south of Shandong peninsula, is a semi-closed bay in the west of the Yellow Sea. It is an important representative of the north temperate gulf ecosystem. Because there are insufficient exchange capacities of water bodies and a large number of pollutants it contained, the eutrophication of the Jiaozhou Bay and Qingdao coastal water is still a significant problem. Therefore it is of great significance to effectively monitor the water quality of the regions in near-real time. In August 2014 and October 2015, two field experiments of ocean optics were conducted in the Jiaozhou Bay and Qingdao coastal area. The profiles of absorption spectra and attenuation spectra were measured using the high spectral absorption-attenuation meter ac-s, from which the profiles of scattering spectra were obtained. The backscattering meters, BB9 and HS6, were used to measure the profiles of the backscattering spectra in August 2014 and October 2015, respectively. Then the backscattering ratios of particles were calculated. Based on the measurements, the spectral models of scattering coefficients and backscattering coefficients of suspended particulate matters were developed, respectively. Moreover, the relationship model between the backscattering coefficient and scattering coefficient at 532 nm was developed as well. The particle composition and its spatial distribution in the Jiaozhou Bay and Qingdao coast area were analyzed using the refractive index information obtained from the backscatter ratio. Finally, the relationship between the scattering parameters and particle concentrations SPM was analyzed. The results show that the values of the scattering and backscattering coefficients in the Jiaozhou Bay are generally higher than those in the Qingdao coast area. The closer the stations are to the shore in Jiaozhou Bay, the greater the values are. The slope of the scattering spectral (m=0.56) in the Jiaozhou Bay is larger than that in the Qingdao coastal stations (m=0.44). There is a power regression between the backscattering coefficient and the scattering coefficient of particles in the Jiaozhou Bay and Qingdao coast area. The refractive index of particles in this region ranges from 1.097 to 1.197, from which was inferred that the dominant component was inorganic mineral particles. The refractive index of the stations in the bay mouth (JZ1, QD1 and QD7) changed little. A section composed of stations located inside the bay, in the mouth of the bay and outside the Bay (in the Qingdao coast) were selected to analyze the distribution of the particle refractive index. It was found that the refractive index of particles gradually increased from the inner of the Bay (i. e., JZ9) to the mouth of the Bay (i. e., JZ1), which means more inorganic particles inside the Bay. While the refractive index of particles decreased gradually as farther to the coast (from QD7 to QD5) and the composition of organic particles increased. The refractive index of particles in the JZ6 station that is near the Jiaozhou Bay bridge is significantly lower than the stations on both sides of the bridge. The linear and power exponential relationships between the backscattering coefficients and the concentrations of suspended particulate matters were established. It was found that the power exponential regression is better than the linear regression.
Oct. 01, 2020Vol. 40 Issue 10 3102 (2020)
Wei WU, Yu FU, Jun-li REN, Shi-chao MIAO, Yuan-ming GUO, and Cheng-hu YANG
In the range of pH at 3~11, the fluorescence spectra of water-soluble (10 μg·L-1) pyrene and substituted polycyclic aromatic hydrocarbons (S-PAHs) including 1-hydroxypyrene, 1-aminopyrene, 1-methylpyrene, 1-pyrenecarboxylic acid, 1-bromopyrene and 1-nitropyrene were measured by three-dimensional fluorescence spectroscopy. The influences of various substituents and solution pH on the fluorescence properties of seven kinds of PAHs were explored. The results showed that the fluorescence peak and fluorescence intensity of the pyrene ring were dependent on the substituent structure. The substituents of —OH, —NH2, —CH3, —COOH, and —Br can cause varying degrees of red shift in the excitation wavelength and emission wavelength of the pyrene ring. Meanwhile, the fluorescence intensities of 1-hydroxypyrene and 1-aminopyrene were higher than those of pyrene, which is mainly because the electron-donating group —OH, —CH3 can increase the conjugated π electron cloud density on the pyrene ring, and then reduce the ground state excitation energy and increase the fluorescence efficiency of the fluorescence molecule. The electron-withdrawing group —NO2 and heavy atom substituent —Br have a strong inductive effect, leading to decrease the electron cloud density on the pyrene ring conjugation system and reduce the fluorescence efficiency of the fluorescence molecule. The electron-donating group —NH2 has no obvious effect on the fluorescence intensity of the pyrene ring, while the electron-withdrawing group —COOH could sluggishly increase the fluorescence efficiency of the pyrene ring. Under this experimental condition, there were no significant effects of pH on the fluorescence peak position and fluorescence intensity of pyrene, 1-methylyrene and 1-bromopyrene. Compared with pH≤9, the maximum fluorescence peak of 1-hydroxypyrene was redshifted at pH=11, and the fluorescence intensity decreases significantly. In addition, the effects of pH on the fluorescence properties of 1-aminopyrene and 1-pyrenecarboxylic acid were also observed clearly. The fluorescence peaks of 1-aminopyrene and 1-pyrenecarboxylic acid were blueshifted and redshifted respectively, owing to the protonation effect at pH=3. The fluorescence intensity of 1-aminopyrene at pH=3 was slightly greater than that of pH≥5, while the fluorescence intensity of 1-pyrenecarboxylic acid at pH=3 was slightly lower than that of pH≥5. These studies are of great significance to the establishment of S-PAHs fluorescence analysis method and in situ determination of S-PAHs in the water environment.
Oct. 01, 2020Vol. 40 Issue 10 3108 (2020)
Wei-wei ZHANG, Yan-hui SUN, Hai-yang GU, Ri-qin LÜ, and Wen-zheng WANG
At present, the tradition way to detect the oxidative stability could not provide information about a variety of chemical species and simultaneously in real time, and so on. Synchronous fluorescence spectroscopy is considered to be an ideal method, because it is sensitive and reproducible, and should be amenable to longer periods. Combined methods of synchronous fluorescence spectrometer with chemometrics were to monitor the oxidation of peanut oil, which were stored under OXITEST oil oxidation stabilizer to carry out accelerated oxidation test. There was the oxidation induction curve in the accelerated oxidation test, and meanwhile, the 3D synchronous fluorescence spectral data and physical and chemical indexes were collected. The results showed that the Induction Period (IP) of cold pressed peanut oil was worse than that of hot-pressed peanut oil. The hot-pressed peanut oil was roasted at high temperature, which made antioxidant substances to improve the oxidation stability. It was clearly showed induction period, oxidation period and the static period from the oxidation curve. The fluorescence peak of Ex shifted from 300~400 to 400~450 nm. With the increment of oxidation time, the fluorescence peak changed significantly, and the red shift appeared in the fluorescence wavelength. Data multidimensional was reduced by the parallel factor analysis (PARAFAC) method. It was used to select an optimized Δλ of 70 nm on 6 components with the adequate loading score. Then the artificial neural network (ANN) was used to build a regression model for both synchronous fluorescence and the acid value and peroxide value respectively to evaluate the degree of the oil oxidation. The peanut oil exhibited a high regression coefficient (R=0.99) between fluorescence intensity and acid value in the training and the testing. The overall results suggested that synchronous fluorescence spectroscopy combined with chemometrics was useful for rapidly monitoring oil oxidation process in time, and could provide a theoretical basis for the formation of oxidation products and evolution of fluorescence spectra.
Oct. 01, 2020Vol. 40 Issue 10 3113 (2020)
Hui YAN, Xin-ping LI, Zhu XU, and Guo-sen LIN
To reveal the application of fluorescence analysis technology on study of crop response to cadmium stress, the changes in cadmium concentration, chlorophyll fluorescence parameters, and fluorescence response curves of soybean seedlings under cadmium stress were analysed, and the relationship between chlorophyll fluorescence parameters and cadmium concentration in leaves was further assessed. The results showed that, with increased cadmium stress time, the concentration of cadmium in leaves increased gradually, reaching its maximum after 9 days of cadmium stress. After 1 day of cadmium stress, the PSⅡ reaction centre of soybean could dissipate excessive excitation energy by increasing non-photochemical quenching (NPQ) and decreasing actual efficiency of PSⅡ (ФPSⅡ) and apparent electron transport rate (ETR). Thus the physiological damages caused by energy over-excitation in PSⅡ reaction centre were avoided and the stability of the maximal efficiency of PSⅡ (Fv/Fm) was maintained, indicating that the dynamic photo-inhibition in soybean caused by cadmium stress then occurred. After 6 days of cadmium stress, NPQ continued to increase, but the photo-protection mechanism was insufficient to avoid the physiological damage caused by energy over-excitation. Thus, Fv/Fm of soybean seedlings showed a trend of decrease, indicating that soybean seedlings were then affected by chronic photo-inhibition. We next performed the correlation and regression analysis between chlorophyll fluorescence parameters and cadmium concentration. Fv/Fm was non-linearly correlated with cadmium concentration (R2=0.907, pΦPSⅡ (R2=0.959, pR2=0.945, pR2=0.959, pFv/Fm could maintain stability under certain cadmium stress, while ΦPSⅡ, ETR and NPQ changed rapidly with increasing cadmium concentration. The changes in light response curves of chlorophyll fluorescence under cadmium stress were also analysed. It was found that the light response curves of ΦPSⅡ and NPQ in stressed leaves showed similar trends to those observed in non-stressed leaves. However, under specific light intensity, ΦPSⅡ in stressed leaves was lower than that of non-stressed leaves, while NPQ in stressed leaves was higher than that of non-stressed leaves, indicating that cadmium stress reduced the photochemistry activity of leaves, and caused more excitation energy dissipation as thermal. These studies confirmed that, fluorescence analysis technology could provide guidance for further study on the physiological mechanism of crop response to cadmium stress.
Oct. 01, 2020Vol. 40 Issue 10 3118 (2020)
Zi-yong WU, Jin-bao JIANG, Jian-wei GUO, Xin-da WANG, and Yang JI
The leakage of underground natural gas storage will lead to serious safety accidents and economic losses, which can be effectively avoided by the rapid and accurate identification of natural gas leakage point. For the micro leakage of underground gas storage, traditional methods are difficult to be applied due to its low accuracy and high cost. In this study, hyperspectral technology is used to conduct field simulation experiments. Meanwhile, spectral, texture and color information was fused to identify natural gas leakage points. Based on the characteristics of vegetation growth in the corresponding areas under leakage stress of underground natural gas storage, the SOC710VP (spectral range: 400~1 000 nm) is used to obtain the hyperspectral images of winter wheat in the control and stress areas on the 11th, 24th, 32nd, 40th and 49th days accordingly. After preprocessing steps such as spectral smoothing, reflectivity correction and clipping, (1) ANOVA (Analysis of Variation) is first used to select the following characteristic bands: 510, 520, 570, 625, 645, 680 and 690 nm, respectively. Secondly, the gray level co-occurrence matrix (GLCM) is used to calculate the texture features of the characteristic band images and the first three order color moments of RGB synthetic images are calculated. (2) NDVI is used to segment the image, which is divided into vegetation part and bare soil part. Based on least squares support vector machine (LSSVM), a recognition model was constructed to recognize wheat under stress by fusing spectral, texture and color features. (3) The recognition results of wheat and bare soil under stress are fused and processed by morphology and circle fitting. The results showed that there are significant differences in the spectrum, texture and color characteristics between wheat under natural gas stress and wheat without stress. The areas under natural gas stress tend to expand first and then shrink. The recognition model constructed in this paper synthesizes spectral, texture and color features can better identify the stress area on the 24th day of stress occurrence. It is also found that wheat grew more vigorously and appeared “green halo” in the circle 0.25 m from the stress edge. In order to verify the applicability of the model, this paper used the established identification model to identify the soybean, corn and grassland in the experimental area, and achieves satisfying results. The research results can provide theoretical support for the identification of natural gas leakage in engineering applications.
Oct. 01, 2020Vol. 40 Issue 10 3123 (2020)
Fu-cai ZHANG, Wei TANG, and Xiao-gang SUN
Multispectral thermometry is a process of retrieving the true temperature of radiators by measuring the information of multispectral radiations and using related theories and algorithms. The solution of spectral emissivity is still the key and difficulty in multispectral thermometry. Theoretically, it is necessary to know enough spectral information to obtain the true temperature of the radiator. Considering that the spectral emissivity of actual radiators at different spectrum and temperatures are usually inconsistent, and the solution of spectral emissivity is an unavoidable problem in non-contact radiation temperature measurement, it is of great scientific significance and application value to carry out the research on the solution of multispectral emissivity and the inversion methods of true temperature. After decades of development, the solution spectral emissivity can be generalized into four types of models. One is the grey body hypothesis model, which considers that spectral emissivity is a constant or its change can be neglected in the process of temperature inversion; the other is the wavelength hypothesis model, which considers that there is a certain relationship between spectral emissivity and wavelength in the process of temperature inversion. Thirdly, the true temperature hypothesis model, which considers that there is a certain relationship between spectral emissivity and true temperature in the inversion process of the true temperature, and establishes a model between spectral emissivity and true temperature and realizes the inversion of true temperature with iteration method; Fourthly, the establishment of a neural network model, which achieve true temperature inversion by the neural learning network. Based on the uniqueness of true temperature and the analysis of different hypothetical models, thethesis tries to find a generaltrue temperature inversion method without the hypothesis of spectral emissivity model and carries out the research work with multispectral true temperature inversion method as the core. The paper summarizes the characteristics of traditional multispectral true temperature inversion theories and methods. In view of the complexity of selecting the spectral emissivity model in the existing multispectral true temperature inversion process, a true temperature inversion method based on the constrained optimization principle of single objective function minimization is proposed. This method does not need to assume the spectral emissivity model and convert the true temperature solution problem into an optimization problem to solve the minimum of the objective function. By using a blackbody furnace and adding a filter with known spectral emissivity at the output port of the blackbody furnace light source to simulate the radiation source, the true temperature inversion of multispectral pyrometer based on minimum optimization method is realized. Compared with the traditional second measurement method, under the same initial conditions and compared with the original second measurement method proposed by the research group, the new method has the same inversion accuracy as the second measurement method, but the inversion speed has been greatly improved.
Oct. 01, 2020Vol. 40 Issue 10 3130 (2020)
Ang-ang SHI, Hong-xia YU, Min-fen GU, Zhong-lin YANG, and Xue YANG
The investigation on core@shell structured nanocomposites is a hotspot in material science. The dispersion and stability of core particles can be enhanced by coating with a stable shell layer to prevent the physical or chemical changes. Compared to single nanoparticles, improved performance can be achieved via the combined interactions of the cores and shells of the nanocomposites. Thus, core@shell nanocomposites are widely used in the fields of catalysis, photochemistry, electro chemistry, microelectronics, microwave absorption, drug therapy, and so on. In this study, nano-scale nickel-hydrazine complex(NHC)is fabricated by the reverse micelle approach in the oil phase with the nickel chloride and the hydrazine hydrate. Core@shell structured nickel-hydrazine composites (NHC@RF, NHC@SiO2, NHC@RF@SiO2) are synthesized by NHC coated with the resorcinol formaldehyde (RF) resin and silicon dioxide(SiO2). The fabricated samples are characterized by transmission electron microscope (TEM), X-ray diffraction (XRD), transmission, attenuated total reflection and diffuse reflection Fourier transform of infrared spectroscopy (TR-FTIR, ATR-FTIR and DRS-FTIR). It is proved that the nano-rod structured NHC mainly includes Ni(N2H4)2Cl2 with a little Ni(NH3)6Cl2. For TR-FTIR, the structure and surface properties might be changed by the potassium bromide though the possible ion exchange during the process of KBr tablet pressing. No sample pretreatment is needed for ATR-FTIR without any damage to the core@shell structured composites. ATR-FTIR focuses on the shell characterization of core@shell structure and can be used for the qualitative analysis of coating. Similar to ATR-FTIR, the nondestructive DRS-FTIR still requires the potassium bromide for dilution, and its detection depth and intensity are higher than that of ATR-FTIR and lower than that of TR-FTIR. The RF coating has little influence on the characteristics of NHC peak, while SiO2 coating leads to red-shift of the stretching vibration and blue-shift of the bending vibration of N—H bonds, demonstrating the interaction between SiO2 and N—H bonds.
Oct. 01, 2020Vol. 40 Issue 10 3136 (2020)
Interaction Between Graphene Quantum Dots and Trypsin With Spectroscopic and Chemometrics Approaches
Qiu-lan ZHANG, Zhi ZHU, Zi-jian WEN, and Yong-nian NI
With super properties, such as photoluminescence properties, edge effect, low cytotoxicity and great biocompatibility, graphene quantum dots (GQDs) have attracted great attention in biological and biomedical applications. The potential toxicity investigations of GQDs still need to involve. Few studies have been illuminated that GQDs could alter the function and structure of trypsin. The molecular interaction between trypsin and GQDs was systematically researched through the combination of multi-spectroscopic and chemometrics approaches. The fluorescence quenching experiment showed that GQDs quench the intrinsic fluorescence of trypsin and inhibit the biological activity of trypsin. When different concentrations of GQDs were added, the fluorescence emission peak intensity of trypsin at 350 nm continuously decreased and had a blue shifted (350 to 344 nm), indicating that GQDs could change the microenvironment of trypsin and increase its hydrophobic. Meanwhile, the higher the concentration of GQDs, the more obvious the change of trypsin fluorescence, indicating that GQDs interacts and changes the secondary structure of the macromolecule. The microenvironment of protein amino acid residues is determined by the conformation of protein molecules. The spiral structure of proteinase decreased from 19.12% to 16.23% in the circular dichroism experiment indicated that the addition of GQDs induced the alteration of the secondary structure of trypsin and relaxed the trypsin framework. The three-dimensional fluorescence further indicated that the conformation of trypsin changed with the addition of GQDs. When the microenvironment of the chromophores of serum albumin changes, its UV-visible absorption spectrum also changes. Due to the complex life system, most of the information in the test of spectrum data is implicit and overlapping. We need to use and develop the effective biological signal collection, transduction, data processing and analysis method to get the useful information that can explain life as much as possible from the measured data. To obtain sufficient and effective chemical information of life, this study adopts the continuous titration technique collecting multidimensional spectrum data. An expanded UV-Vis spectral data matrix was analyzed by the multivariate curve resolution-alternating least squares (MCR-ALS) chemometrics approach. To further understand the state and the whole dynamic change process of each component when GQDs and trypsin reached equilibrium in action, the qualitative (spectrum of each component) and quantitative (the changing trend of concentration) information were obtained from the heavily overlapped spectra. The analytical results of MCR-ALS provide a basis for further understanding of the kinetic process of the interaction between GQDs and trypsin, indicating that GQDs can interact with trypsin and form GQDs15-trypsin complex. The results offered insights into the binding mechanism of GQDs with trypsin and significant information for possible toxicity risk of GQDs to human health.
Oct. 01, 2020Vol. 40 Issue 10 3141 (2020)
Jian-xin ZHANG, Ying-hao WEI, Hao-zhe JIN, and Xue-yun SHEN
As an active anion, the chloride ion is widely distributed in various aqueous solutions. Chloride ion concentration is an important parameter to evaluate water quality, which has a great impact on food safety, industrial production and corrosion control. Therefore, rapid and accurate determination of chloride ion content in aqueous solution have practical significance for optimizing the living environment and promoting industrial development. Raman spectroscopy is a kind of spectral detection method based on Raman scattering effect. It is widely used in qualitative and semi-quantitative detection of various substances with the advantages of a few samples required, high sensitivity and is suitable for aqueous solution detection, but few cases were reported for quantitative detection. A new method was proposed in this paper for the determination of chloride ion concentration in aqueous solution based on laser Raman spectroscopy combined with silver nitrate turbidimetry. The silver nitric was firstly dipped into the aqueous solution, with acetone as a stabilizer, to make chloride ions with different concentrations react with it to generate a uniform and stable silver chloride colloid, and then the Raman spectrum of the silver chloride colloid was collected using the small Raman spectrometer. After smoothing, de-noising and baseline correction of the Raman spectrum, the Gaussian peak fitting technique was used to fit the Raman spectrum curve. The characteristic parameters of each gaussian peak, such as peak intensity, peak area and half peak width, were obtained, and the relationship between these characteristic parameters and chloride ion concentration was determined. The experimental results show that under normal temperature and atmospheric pressure, the ratio of the peak intensity of the Gaussian fitting at 1 050 and 1 635 cm-1 has a good linear relationship with the concentration of chloride ions, and the detection range of chloride ion concentration is 0.1~4 mg·L-1. The correlation coefficient of the linear equation is 0.9914. The relative standard deviation is less than 5%, and the recovery rate is between 98.02%~103.3%, which implies the proposed method has good accuracy and repeatability, and is suitable for quantitative detecting requirements. In order to determine the effects of factors such as nitric acid, silver nitrate, stabilizers, and standing time on the experimental results, the systematic optimization of the measurement method was carried out to determine the best measurement conditions. The optimal experimental conditions were as follows: 2 mL of nitric acid (1+1), 2 mL of acetone, and 2 mL of silver nitrate solution (0.1 mol·L-1) were successively added to 25 mL of water, and the standing time was 15 min. Therefore, the proposed method of determining the chloride ion concentration in aqueous solution based on Raman spectroscopy combined with silver nitrate turbidimetry is feasible. This method is simple in operation and has a small amount of sampling. It has broad application prospects in water quality detection, corrosion control, substance analysis and other fields.
Oct. 01, 2020Vol. 40 Issue 10 3147 (2020)
Yu-na KAN, Bing-wei CHEN, Sheng-cheng ZHAI, and Chang-tong MEI
Carbon microspheres, as a new type of carbon material, have a high specific surface area and high electrical conductivity. There are a lot of reactive groups such as hydroxyl carbonyl and carboxyl groups on the surface of the microsphere, which makes it suitable for a wide range of application prospects on adsorbent materials, catalyst carriers, electrode battery materials, et cetera. By this research, the hydrothermal carbon microspheres were synthesized from different carbon sources including the natural biomass (Vitis vinifera and Eupatorium adenophorum) and saccharides (xylose, glucose and sucrose). To explore the effect of the composition of the carbon sources on the morphology and chemical structure, the properties of different carbon microspheres were characterized by Field Emission Scanning Electron Microscope (FE-SEM), Attenuated Total Reflection Fourier Transform Infrared Spectrometer (ATR-FTIR) and X-ray Photoelectron Spectroscopy (XPS). The infrared spectra of 2 000~800 cm-1 in the fingerprint characteristic region were selected. The original infrared spectra data were pretreated by automatic baseline correction, automatic smoothing, ordinate normalization and analyzed by principal component analysis (PCA) for probing the differences in spectral properties between different carbon microspheres. The results showed that the morphology and particle size distribution of carbon microspheres were closely related to the raw material. The carbon microsphere prepared by saccharides, which diameter was approximately in the 0.3~1.6 μm range, sucrose >glucose> xylose. And the particle size distribution of biomass carbon microsphere was 0.1~0.6 μm, Eupatorium adenophorum>Vitis vinifera. In the carbonation reaction, biomass and saccharides had a series of dehydration, decarboxylation, aromatization and condensation reaction. In terms of the chemical structure, no matter the complexity of carbon sources, the carbon microspheres all had aromatic ring structure and outer surface contained a high concentration of reactive oxygen groups, such as O—H, CHO. The PCA results showed that two main components represented 83.1% fingerprint region variable information, which could reflect the main information of the original spectrum. In the principal component scores figure, the distribution of different carbon microspheres was relatively independent, there were obvious differences in the chemical composition of the synthetic carbon microspheres derived from different carbon sources. Therefore, the difference in the intensity of absorption peak could provide an effective reference for the identification of carbon microsphere from different carbon sources. The results could provide a theoretical basis for further exploration of the spectral properties of carbon microspheres prepared by different carbon sources under hydrothermal conditions.
Oct. 01, 2020Vol. 40 Issue 10 3153 (2020)
Yin HU, Min-chang WANG, Qing PAN, Yan-li NING, Ying KANG, Ming WANG, Jie-yu LUAN, and Zhi-qun CHEN
Endo-tetrahydrodicyclopentadiene (endo-THDCPD) and exo-tetrahydrodicyclopentadiene (exo-THDCPD) are the products of catalytic hydrogenation with cyclopentadiene as the initial reaction of raw material, which are impurities and space isomers. With the widespread application of these two materials in aerospace, aviation and other fields, it is imperative to study its quality evaluation method. The spectral technique is an important means to study the material quality, and a kind of optical-spectroscopy-based endo-THDCPD and exo-THDCPD identification method is developed to improve the detection efficiency of product quality, and it is of great significance to the production and quality control of the respective products. The absorption spectra of endo-THDCPD and exo-THDCPD were measured with NMR, MS, IR, Raman and terahertz spectroscopy (THz) technique at room temperature. The results showed that there were distinct differences of endo-THDCPD and exo-THDCPD in the rest spectra, except that the mass spectrum behavior was basically the same. The difference of the chemical shift of C-1/3, C-5/6, C-7/8 and C-10 is relatively large, and the maximum difference is 10 ppm. It is easy to distinguish the four group of —CH—, they are H-2/4, H-5/6. And the chemical shift of H-5/6 in exo-THDCPD is smaller than that of H-2/4, and the endo-THDCPD is vice versa. The IR spectra and Raman spectra of endo-THDCPD and exo-THDCPD had shown differences both in the frequencies of the vibrational bands and in the relative band intensities. Absorption peaks observing in the terahertz spectra of endo-THDCPD were at 0.24, 0.59, 1.06, 1.71 and 2.53 THz and exo-THDCPD were at 1.41, 1.76, 2.41 and 2.65 THz. It is found that there were more differences in THz. The results can provide basic data for product quality analysis, and also provide experimental references for the application of NMR, IR, Raman and THz to detect spatial isomers.
Oct. 01, 2020Vol. 40 Issue 10 3161 (2020)
Wang-chun LIAO, Xing-yu FAN, Guang-hai SHI, and Li-li DAI
Amber is a kind of fossil resins, which formed through sedimentation and fossilization of resins secreted by ancient gymnosperm and angiosperm, for millions or even tens of millions of years. According to the chemical composition of fossil resins, amber is classified into five classes: ClassⅠ, Class Ⅱ, Class Ⅲ, Class Ⅳ and Class Ⅴ. Among them, class Ⅰ amber is a kind of fossil terpenoid resins containing labdanoid diterpenoids, and the semi-fossil resins in the formation process are classified as class Ⅰ Copal. Due to the active functional groups such as carbon-carbon double bonds, hydroxyl groups and carboxyl groups containing in labdanoid diterpenoids, during the long process of sedimentation and fossilization, labdanoid diterpenoids in the terpenoid resins were proceeding a series of chemical reactions such as polymerization reaction, cross-linking reaction, esterification reaction and isomerization reaction, and gradually formed into semi-fossil and fossil resins with different degree of polymerization and cross-linking, for instance Copal as semi-fossil resins with inadequate fossilization, amber as fossil resins with adequate fossilization, hard amber as fossil resins with thorough fossilization. In this study, the semi-fossil resin and fossil resin of the three fossilization stages mentioned above were taken as research objects. By means of infrared spectroscopy analysis technology, the changes of absorption peaks of the organic functional groups ware tracked, such as carbon-carbon double bonds, ester groups and carboxyl groups, and the stage characteristics of semi-fossil resin and fossil resin ware verified, and the chemical process of class Ⅰ amber formation was deduced. Through the analysis and comparison of infrared test results, the main research conclusions are as follows: (1) Due to inadequate fossilization, class Ⅰ copal is dominated by the unstable structure with a large number of carbon-carbon double bonds and carboxyl groups, because of the insufficient polymerization reaction, cross-linking reaction, isomerization reaction and deficient esterification reaction; (2) Due to adequate fossilization, class Ⅰ amber is dominated by the stable structure with a few carbon-carbon double bonds and carboxyl groups, because of sufficient polymerization reaction, cross-linking reaction, and isomerization reaction, but the esterification reaction was in the process; (3) Due to thorough fossilization, class Ⅰ hard amber is dominated by a more stable structure without active functional groups, because of the thorough polymerization reaction, cross-linking reaction, esterification reaction and isomerization reaction.
Oct. 01, 2020Vol. 40 Issue 10 3167 (2020)
An-li ZHOU, Jin-hua JIANG, Chun-xiao SUN, Xin-zhong XU, and Xin-ming LÜ
Due to different mineralization environments, Hetian jade in different regions has its own elemental fingerprint characteristics. Elemental fingerprint analysis technology has the advantages of fast analysis speed, low analysis cost and high discriminant rate. It is one of the most effective methods for identification of origin to combine element fingerprint analysis and various statistical methods. However, multi-element fingerprint analysis technology has been widely used in the traceability research of various crops. It has not been used in the geographical origin of Hetian jade. The identification of Hetian jade origin, which has important significance for the identification and traceability of origin. Therefore, the objective of this study is to establish a model for geographical origin discrimination according to multi-element contents. The contents of 20 elements were determined by using inductively coupled plasma mass spectrometry ( ICP-MS) for 45 samples of Hetian jade from four producing areas of different regions. One-way ANOVA, principal component analysis (PCA) and linear discriminant analysis (LDA) were employed in the data analysis to screen out the significant elements.And then Fisher linear discrimination analysis was used to determine the origin of Hetian jade, and the discrimination models were developed. One-way ANOVA showed that the composition of elements in different origin Hetian jade samples was consistent with the expected significantly different (p<0.05). The results showed that the main trace elements in Hetian jade were Fe, Zn, Cu and Ni, and heavy metals (Pb, Cd and As) were lower. The discrimination models were developed by the discrimination analysis of the whole model method with six significant elements identified by PCA and LDA,and 100% correct classification, and 95.5% cross-validation was achieved by the models. The results show that Zn, K, Mg, Na, Ca, Mn can be used as multi-element traceability indicators for traceability in different regions. From the content of various elements in Hetian jade, Different origins and jade can be identified by principal component analysis (PCA) and linear discriminant analysis (LDA). It is a promising approach to classify the geographical origin of Hetian jade based on multi-element fingerprints analysis combined with multivariate statistical analysis. The discrimination models are good enough to be applied in the origin traceability of Hetian jade.
Oct. 01, 2020Vol. 40 Issue 10 3171 (2020)
Qian CHEN, Tao CHEN, Xue-jun YAN, Chao-wen WANG, Jin-yu ZHENG, and Meng-yang LI
In recent years, jade species produced in Xi’an, Yunnan with a similar appearance to Chicken-blood stone appear in the gem market. The similar species of Chicken-blood stone has brought an impact on the trade market of Chicken-blood stone, and also brought challenges to the naming and testing of Chicken-blood stone. In this study, the similar species of Chicken-blood stone are studied by using X-ray powder diffraction spectrometer(XRD), scanning electron microscopy(SEM), infrared spectrometer(IR), and laser Raman spectroscopy(LRM) in order to analyze the mineralogical and spectroscopic characteristics of the similar species of Chicken-blood stone. The results are as follow: (1) According to the testing results of XRD, the “Blood” of the similar species of Chicken-blood stone is cinnabar. Quartz and dolomite are the main constituent minerals of Xi’an sample. The “Di” of Yunnan sample is composed of quartz and calcite, and contains a certain amount of aragonite. A small amount of illite was found in the similar species of Chicken-blood stone produced in two places, and a small amount of kaolinite was found in Yunnan samples. (2) SEM showed that the carbonate minerals in the similar species of Chicken-blood stone were euhedral to subhedral. Carbonate minerals are the largest of all minerals. Subhedral-anhedral quartz is distributed between carbonate minerals. Cinnabar is distributed between carbonate minerals and quartz. Fine scale-like illite crystals were observed in Xi’an samples. (3) The IR spectrum shows that a similar species of Chicken-blood stone produced in two places share the similar mineral component of quartz and carbonate mineral. All samples have a strong and wide absorption band of 1 086, 1 167 cm-1 caused by the anti-symmetric stretching vibration of Si—O—Si, and the infrared absorption peaks of 798, 779, 694, 512 and 462 cm-1 belonging to the symmetric stretching vibration of Si—O band. All the above absorption peaks are attributed to quartz. Infrared spectra of dolomite of 727, 881, 1 444 cm-1 were obtained in Xi’an samples. Yunnan samples have infrared spectra of calcite of 712, 876, 1 427, 1 789 cm-1. Calcite and dolomite are calcite group minerals. Their infrared spectra are composed of the vibration mode of carbonate ions and the lattice vibration mode. Their peak positions are slightly different, but the basic contour and assignment are the same. 712~727 cm-1 is the in-plane bending vibration absorption peak of [CO3]2-, 876~881 cm-1 is the out-plane bending vibration absorption peak of [CO3]2-, and the peaks of 1 427~1 444 cm-1 are attributed to the anti-symmetric stretching vibration of [CO3]2-. Some samples containing clay minerals have the vibration peak of OH in the functional area of IR. (4) Raman spectrum test shows that the “Blood” of the samples from Xi’an and Yunnan is cinnabar, with a Raman shift of 254, 290, 350 cm-1. The black mineral in Xi’an sample is stibnite with Raman shift of 147, 191, 252, 452 cm-1. Raman spectra of “Di” accord with the results of the infrared spectrum. Samples from Xi’an and Yunnan have the characteristic Raman shift of quartz in 464 cm-1. In Xi’an sample, there is Raman shift of dolomite of 1 097, 725, 338, 299 cm-1while in Yunnan sample. There is Raman shift of calcite of 1 087, 713 and 282 cm-1. Because there are clay minerals in the similar species of Chicken-blood stone, the identification of Chicken-blood stone cannot simply depend on whether it contains clay minerals.
Oct. 01, 2020Vol. 40 Issue 10 3179 (2020)
Fu-dong JIA, Chang-qing ZHANG, Zhi-xin HUA, De-bo LOU, Bao-long LI, and Jia SUN
Identification characteristics, composition and genesis of natural blue and colorless euclases from Mahuaping W-Be deposit, Yunnan, China are investigated by the polarizing microscope, scanning electron microscopy and energy spectrum analysis, Raman spectroscopy, electron microprobe analysis and laser ablation-inductively coupled plasma-mass spectrometry (LA-ICPMS). The results indicate that the chemical composition of euclase is simple, and this can be attributed to its simple crystal structure. Crystallized in the fluorine-rich environment, the fluorine concentration in euclase from Mahuaping is higher than that of other regions. Total iron content in the blue sample is much higher than the colorless one suggesting that the high Fe may explain the blue color of euclase. Both of the euclases from metamorphic clastic rocks and marbles are preserved pseudomorphs of beryl which imply that theyare the alteration products of beryl. Euclase intergrowth with quartz from metamorphic clastic rocks may attribute to the direct alteration of beryl as the temperature went down. While the euclase coexisted with muscovite from marble is formed due to the addition of K-rich fluid at lower temperatures. It is simple and effective to identify euclase by optical microscopic observation and Raman spectrum analyses. Euclase is colorless and displays distinctive light blue to light orange pleochroic color under the microscope and has perfect cleavage. It is a biaxial positive mineral with positive elongation and positive middle to the high protuberance, and with the birefringence value of 0.020 and the axial angle amounted to 2V=48°. The extinction angle of euclase are of Ng∧c=41°~44°, Np∧a=10°~13°and the highest interference color is first-order purplish red to second-order blue to green. The characteristic Raman peaks of euclase include 3 588, 3 577, 1 060, 907, 638, 571, 393, 255 and 174 cm-1.
Oct. 01, 2020Vol. 40 Issue 10 3185 (2020)
Dong WANG, Shan-jun LIU, Ya-chun MAO, Heng-yu LI, and Yu-xin QI
The visible-near infrared spectra of minerals and rocks are closely related to their intrinsic physicochemical properties. The determinants of the reflectance spectra are the composition and the content. The study is focused on the relationship between reflectance spectrum and the grade of Anshan iron mine. The visible-near infrared spectrum of Anshan iron mine with different grade was obtained by SVC HR-1024. The influence of grade on reflectance spectra was analyzed. The sensitive band between the grade and the spectra of the samples were determined. The model for predicting grade of experimental samples was established. The results show that, the effects of grade on the spectra of hematite and magnetite are different. The grade of hematite not only affects the reflectance spectra of samples, but also affects the shape of the reflectance spectra of samples. The grade of magnetite does not affect the shape of reflectance spectra of samples. It only affects the reflectance spectra of samples. The influence of hematite grade on reflectance spectra is not uniform at different bands. In 350~1 000 nm band, the reflectivity of samples is sensitive to grade. There is a significant linear negative correlation between reflectance and grade of hematite in this band. In 1 000~1 250 nm band, the slope of reflectance spectrum is sensitive to grade. There is a significant linear positive correlation between them. However, in 1 250~2 500 nm band, the reflectance spectra are slightly affected by grade. The quantitative relationship between the reflectance spectra and the grade of magnetite was analyzed. There is a significant negative correlation between grade and reflectance with the exponential function. The relationship is almost the same in the 350~2 500 nm band. Then, the grade inversion model of hematite and magnetite had been established. We tested and verified the practicality of the model. The error of these models is less than 1%. The prediction results of these models are ideal. In this paper, the influence of grade on reflectance spectra was clarified. The inversion model of the iron grade was established. It provides a new method for determination of iron grade by spectral analysis technology.
Oct. 01, 2020Vol. 40 Issue 10 3193 (2020)
Li-qin WANG, Yan-ni MA, Ya-xu ZHANG, Xing ZHAO, Qiu-ju HE, Jin-yi GUO, and Han-ting REN
Niche of Sakyamuni Eentering Nirvana (Sleeping Buddha) at Baoding mountain, Dazu District, Chongqing, is the largest statue in Dazu rock carvings, one of the world cultural heritage, and also the world’s largest Buddha statue featuring only the upper part of the body. Suffered from the influence of natural power and human factors for thousands of years, various diseases such as paint scaling and biological colonization appeared on the surface of the Sleeping Buddha. To achieve the conservation and restoration of “raw materials and original technology”, it is necessary to identify the pigments of the statue. The surface pigments and the priming coat material of the Buddha were identified by means of micro-Raman spectroscopy (μ-Raman) and other techniques. Furthermore, the possible sources of white and green pigments, the relationship between pigment types and mildew have been discussed. The experimental results have shown that the back of each surface pigment of the Sleeping Buddha based on white priming coat material. The Raman spectrum of the priming coat material shows an intense band at 1 006 cm-1 without other additional bands, which is the characteristic band of gypsum, that indicated the primer material is gypsum (CaSO4·2H2O) with high-purity. The surface of the statue is decorated with red, blue, white, and green pigments. The red was identified to be red ochre (Fe2O3), with stable property and widely used in various painted relics, such as murals and painted pottery. Combined analysis by polarized light microscopy, the blue was identified to be synthetic ultramarine blue (Na6-10Al6Si6O24S2-4), with uniform particles and averaging less than 5 μm in diameter. The white was identified to be a mixture of cerussite lead white (PbCO3) and mimetesite (Pb5(AsO4)3Cl). Among white pigments, lead white is common, while mimetesite is infrequent. In particular, mimetesite is discovered as pigment for the first time at Dazu rock carvings. The Raman spectrum of green pigment displays intense bands at 859 cm-1, attributed to the AsO4- stretching vibration. The green was identified to be lavendulan (NaCaCu5(AsO4)4Cl·5H2O). The green pigment lavendulan and white pigment Mimetesite belong to arsenate, which is a rare secondary mineral. These pigments may be converted from other pigments. Among these kinds of pigments of Sleeping Buddha, the blue and red pigments are apt to mildew, especially blue, while the green and white pigments containing lead, copper, and arsenic are almost free from mold. It is speculated that this phenomenon may be related to the strong toxicity of heavy metallic salts of lead, copper, and arsenic. It has been pointed out that there are differences in the effects of different pigments on microbial activity. The research provides a scientific basis for pigment identification, restoration material selection and scientific conservation of Dazu Rock Carvings.
Oct. 01, 2020Vol. 40 Issue 10 3199 (2020)
Xiao-peng SUN, Rui-jun MA, Yu CHEN, Huan-yi ZHEN, and Chuang-li MA
In this paper, different concentrations of trisodium phosphate solutions were used as research objects to explore the feasibility of UV/visible absorption spectra for detecting the concentration of trisodium phosphate solution in water. Three sets of absorbance measuring devices with different light sources and different optical path combinations were used to collect the spectral data of trisodium phosphate sample solution at different concentrations, and then the three groups of experimental data were pretreated by different pretreatment methods, the results of partial least squares (PLS) model showed that the best pretreatment method was Savitzky-Golay(S-G)convolution smoothing; then the method of Monte-Carlo cross validation (MCCV) was used to eliminate the singular samples in the calibration set, and the PLS model was established for the whole band data after the singular samples were removed, the results showed that MCCV method could improve the prediction performance of PLS models; finally, the main characteristic wavelengths of trisodium phosphate in three experiments were selected by correlation coefficient method, which were 214.099 8, 218.837 1 and 204.66 nm respectively, in order to establish a highly accurate and universal model for trisodium phosphate, the characteristic band of trisodium phosphate was selected from 200 to 222 nm based on the above three main characteristic wavelengths, and the corresponding characteristic band PLS models were established, the results showed that the model could be used quantitative analysis and prediction of trisodium phosphate concentration solution. Therefore, itis feasible to use hyperspectral technology to detect concentration of trisodium phosphate in water rapidly, and this study provides a theoretical basis for the development of instruments and equipment for the rapid detection of inorganic phosphorus concentration in water.
Oct. 01, 2020Vol. 40 Issue 10 3205 (2020)
Yao-bin HOU, Wei-wei FENG, Zong-qi CAI, Huan-qing WANG, and Zeng-dong LIU
Nitrate concentration is an important indicator for the marine ecosystem. Compared with laboratory chemical methods such as Cadmium-Reduction method, in-situ nitrate optical sensor is much faster and reagent-free in a long time and continuous monitoring. Partial Least Squares (PLS) method is often used in ultraviolet absorption spectrum modeling, which is difficult to optimize and has low generalization ability. The neural network can compel any no-linear function by any precision, which has high generalization ability in the modeling. A neural network model is established in the in-situ nitrate sensor to measure the nitrate concentration in seawater in which the nitrate concentration range is 30~750 μg·L-1. Double-hidden layer neural network model is determined to adopt by contrasting performance of single-hidden layer and double-hidden layer to measure nitrate concentration, the input layer is absorption spectrum from 200 to 275 nm, the output layer is nitrate concentration, and sigmoid function is used as the activation function. Gradient descent method is used to update weighting parameters for the neural network of each layer, after 55 000 times iteration, network training is conducted based on the learning rate of 0.26. After validation for the blind test of the model through 8-group randomized validation data, the nitrate concentration using double-hidden layer neural network model is higher in linear correlation to its actual concentration (R2=0.997) in which the Root Mean Squared Error is 10.864, average absolute error is 8.442 μg·L-1, average the relative error is 2.8%. Compared with single-hidden layer neural network model, the double-hidden layer neural network model has higher accuracy in which the average relative error is reduced by 4.92%, the Root Mean Squared Error of PLS is 4.58% using the same spectral data, while the mean relative error is 11.470. The result shows that the neural network model is much better than the Partial Least Squares model under certain conditions. It verifies the superiority of the neural network model applied to the nitrate concentration measurement by ultraviolet absorption spectrometry. The application test was carried out on the “Environmental Monitoring 01” monitoring vessel of the Ministry of Natural Resources, the measurement results are basically identical with the laboratory method in 11 stations, which is further proved from the reliability and practicality.
Oct. 01, 2020Vol. 40 Issue 10 3211 (2020)
Li-biao XIAO, Dian ZHANG, Qun-hu XUE, and Jian-feng HUANG
The concavity defects frequently appear at the surface of porcelain tile produced with the blank via SNCR (Selective Non-Catalytic Reduction) denitrification using urea reductant. The general chemical analysis of the blank cannot judge the causes of the defects. A multispectroscopy approach combining XRD, FTIR, TGA-FTIR adopted in this study reveals the forming mechanisms of the concavity. The results demonstrate that the blank denitrification by urea and that by ammonia mainly release CO2 and H2O during heating. However, the former release not only much gases than the latter but it can releases HNCO and NH3. The residual urea in the blank could augment the gas flow further. The blank denitrification by urea contains cyanic acid, isocyanic acid and their salts, which could decompose beyond 500 ℃ and release additional CO2. In the high temperature stage of sintering, the massive liquid is formed and seals the surface pore of the body. The cyanate and isocyanate in the blank decompose continuously and produce excessive gases, which cannot escape from the body and congregates to be bubbles in the liquid. During the cooling stage after sintering, the bubbles break or collapse, resulting in a concavity at the surface of porcelain tile. Using the multispectroscopy approach and adopting characteristic parameters such as the peak of sodium cyanate at 17.80° in XRD pattern, absorbance peak of cyanate radical at 2 226 cm-1 in FTIR spectrum and absorbance peak of gaseous cyanic acid at 2 241 cm-1 in TGA-FTIR spectrum as the criterion, the quality of the blank could be valued previously and thus the porcelain tile yield could be promoted.
Oct. 01, 2020Vol. 40 Issue 10 3217 (2020)
Zong-bao SUN, Tian-zhen WANG, Xiao-yu LIU, Xiao-bo ZOU, Li-ming LIANG, Jun-kui LI, Zeng NIU, and Yun-long GAO
When the freshprepared steaks exceed the shelf life, its putrid odour is easily masked by the seasoning odour, making it difficult for consumers to distinguish. Total volatile basic nitrogen (TVB-N) is an effective indicator of meat freshness. Due to the chemical method of TVB-N content determination was cumbersome and time-consuming, TVB-N content in freshlyprepared steaks were predicted by hyperspectral imaging technique in this study. Furthermore, the influence of different wavelengths selection algorithms on the prediction effect of the model was discussed. Fresh prepared steaks were taken out on day 0, 2, 4, 6, 8 respectively for hyperspectral data collection and TVB-N content determination. The spectral data were pretreated by six methods, first derivative (1st Der), second derivative (2nd Der), mean centering (MC), multiplicative scatter correction (MSC), Savitzky-Golay (SG), standard normal variate transformation (SNVT), which established the Partial least squares model of TVB-N content and obtained the optimum pretreatment method by comparison. After the optimum pre-processing method, the characteristic wavelengths were selected by competitive adaptive reweighted sampling (CARS), variables combination population analysis(VCPA), interval random frog (iRF), iRF-CARS, iRF-VCPA, the prediction effects of models were evaluated on different selection wavelengths methods. CARS and VCPA were run 50 times repeatedly to assess their stability, and higher frequency wavelengths were selected to establish the PLS model to compare with a single run. The results suggested that 1st Der was the best spectral pretreatment method among the six methods. 21 and 11 wavelengths were selected by CARS and VCPA single run respectively, and the prediction model by VCPA wavelengths selection method had better effect, with the RC and RP at 0.944 and 0.931 respectively, while RMSECV and RMSEP at 1.12 and 1.28 mg·(100 g)-1 respectively. The selected frequency for each wavelength when CARS and VCPA were run 50 times repeatedly indicated that VCPA had better stability because its binary matrix sampling method provided the same sampling opportunity for each variable. At the same time, it was found that the two methods have important common wavelengths: 694.9, 696.6, 761.8, 763.5, 811.5 and 813.3 nm, etc. The performance of the model established byhigher frequency wavelengths was poor.IRF was combined with CARS and VCPA respectively for wavelengths selection, and iRF-CARS showed good predictive performance. The prediction model by iRF-CARS was established using 24 wavelengths, with the RC and RP at 0.966 and 0.938 respectively, while RMSECV and RMSEP at 0.91 and 1.22 mg·(100 g)-1 respectively. The results suggested that the combination of wavelengths interval selection and wavelengths point selection couldrealize their complementary advantages. The research suggested that hyperspectral imaging technique combined with wavelengths selection method can predict TVB-N content in prepared steaks well, which provides a theoretical reference for hybrid variable selection strategy and rapid detection of the freshness of prepared steaks.
Oct. 01, 2020Vol. 40 Issue 10 3224 (2020)
Zhe WANG, Chen-xi LI, Rui QIAN, Rong LIU, Wen-liang CHEN, and Ke-xin XU
The research on classifying different kinds of vegetable oil is very important for food safety and quality supervision. The near-infrared spectroscopy could achieve a qualitative and quantitative analysis of samples with complex components. It has been widely applied to classifying different kinds of vegetable oil. The classification method based on two-dimensional correlation near-infrared spectroscopy is applied to recognize typical vegetable oil in this research. Two-dimensional correlation analysis was carried out with the concentration of n-hexane as the disturbance factor. Then the two-dimensional correlation analysis is calculated within the range of 6 001~6 063 cm-1, in which the absorption features of different kinds of vegetable oils is obvious. And these feature information is reflected in a large number of data points (two-dimensional correlation synchronization spectrum matrix), so further extraction is needed to reduce the variable dimension. The diagonal elements of the two-dimensional synchro spectrum, that is, its autocorrelation spectrum, is always positive, representing the extent to which the spectral intensity varies with the disturbance factor at different wavelengths. Taking advantage of features extracting and data dimensions reduction, the principal component analysis is adapted to extract the feature of the autocorrelation spectrum. The Euclidean distance of principal components is calculated to classify different types of vegetable oil. The experimental results indicated that the proposed method is a benefit for automatic recognition and classification of typical vegetable oil. The PCA algorithm can effectively improve the recognition efficiency and robustness of the model. It provides a new concept for the analysis and processing of food quality sensing spectroscopy.
Oct. 01, 2020Vol. 40 Issue 10 3230 (2020)
Jia-feng PANG, Chen TANG, Yan-kun LI, Chong-ran XU, and Xi-hui BIAN
The content of protein in milk powder is an important factor to determine the quality of milk powder. The value of protein in milk powder can be falsely increased by adulterating melamine, which endangers the health of consumers seriously. In this study, melamine in the milk powder was identified quickly by Fourier transform mid-infrared (FTIR) spectroscopy combined with pattern recognition method (model). The objective analysis of the infrared spectrum is achieved with the help of pattern recognition technology, which overcomes the limitation, complexity and subjectivity of identification through spectra comparison. Pure milk powder samples and adulterated milk powder samples with different mass concentrations (0.01‰~0.2%) of melamine were prepared respectively. After collecting the mid-infrared transmission spectrum data of the samples, the original data were firstly normalized and then comprehensively analyzed using multiple pattern recognition (classification) models including unsupervised (clustering) and supervised (discriminating) methods. Among them, traditional principal component analysis (PCA), distance discrimination (Euclidean distance and Pearson correlation coefficient) and non-negative matrix factorization (NMF) unsupervised pattern recognition methods can not accurately identify pure milk powder and melamine-containing milk powder samples. The recognition sensitivity and specificity of the supervised model of partial least squares discriminant analysis (PLS-DA) method were also low. Finally, linear discriminant analysis (LDA) and non-correlated linear discriminant analysis (ULDA) were used, the identification of melamine-containing milk powder was successfully achieved, and the sensitivity and specificity of recognition were both 100%. In particularly, the ULDA method maximizes the distance between the two types of samples, selects the feature variables containing the best classification information, and distinguishes the samples with only one discriminant vector. Furthermore, the ULDA method was used to select the important variables (characteristic wavelengths) of the infrared spectra. The relationship between the retained variables and recognition accuracy was investigated. The identification of pure milk powder and melamine-containing milk powder was realized with fewer variables. The recognition concentration of melamine in milk powder can be as low as 0.01‰. Therefore, it is proposed to identify a small amount of melamine in the milk powder with simple and rapid way based on MIR spectroscopy, which has advantages over traditional chemical analysis methods and provides an effective way for the adulteration recognition and quality control of milk powder. The method is expected to extend to apply in the identification of other foods.
Oct. 01, 2020Vol. 40 Issue 10 3235 (2020)
Yan-de LIU, Yu RAO, Xun-dong SUN, Xiao-gang JIANG, Hai XU, Xiong LI, Guan-tian WANG, and Jia XU
Brix is one of the important indicators for evaluating the internal quality of navel orange. Due to the difference in the size of the fruit itself, the sugar content prediction model is poor in robustness and the prediction accuracy is not high. Therefore, eliminating the influence of fruit size effect is of great significance for improving the accuracy of fruit sorting model. The diffuse transmission, multi-point emission and reception, and circular emission and reception diffuse reflectance spectra of navel orange were compared and analyzed. Among different detection platforms, the spectral energy of the big fruit was stronger than that of the small fruit due to the difference of optical path difference, and the circular emission was obtained. The energy of the diffuse reflection spectrum is stronger than that of the other two spectra. The diffuse transmission spectrum energy is the weakest, and the peaks and troughs are roughly the same. The prediction model of orange navel size under different detection methods is established respectively. Among them, the prediction coefficient of the size prediction model under the diffuse transmission detection mode is 0.60, the root mean square error of the prediction set is 3.95 mm, and the size of the multi-point transmission and reception diffuse reflection detection mode. The prediction set correlation coefficient of the prediction model is 0.97. The prediction set RMS error is 1.46 mm, and the prediction set correlation coefficient of the small fruit prediction model under the ring emission and reception diffuse reflection detection mode is 0.96, and the prediction set RMS error is 1.73 mm. The mixed fructose prediction models of large fruit, small fruit, mixed fruit and multi-scattering correction pretreatment were established under three different detection methods. The precision of the sugar content prediction model of small fruit was higher than that of large fruit and mixed fruit, and diffuse transmission detection The correlation coefficient of the prediction set of the small fruit prediction model is 0.76, the root means square error of the prediction set is 0.81°Brix, and the correlation coefficient of the prediction set of the small fruit prediction model under the multi-point transmission and reception diffuse reflection detection mode is 0.72. The square root error is 0.97°Brix, and the prediction set correlation coefficient of the small fruit prediction model under the ring emission and reception diffuse reflection detection mode is 0.72, and the prediction set RMS error is 0.93°Brix. After multi-scattering correction pre-processing spectra, the hybrid fruit model of near-infrared diffuse transmission spectrum is better than the small fruit model. The correlation coefficient of the model prediction set is 0.84, and the root means square error of the prediction set is 0.64°Brix. In the diffuse reflection detection mode, the accuracy of the multi-mixed fruit model is reduced. The experimental results show that in the diffuse transmission detection method, the multi-scatter correction pre-processing spectrum can eliminate the effect of the size effect. In the diffuse reflection detection method, the size sorting is performed first, followed by the sugar separation, which can also avoid the size effect. This study provides reference and theoretical support for the rapid online sorting of bulk fruits.
Oct. 01, 2020Vol. 40 Issue 10 3241 (2020)
Jian-hu WU, Gui-feng LI, Yan-kun PENG, Jun-jie DU, Jian-guo XU, and Gang GAO
Gelatinization is one of the most important processing properties of millet, which has an important influence on the processing performance and product quality of millet. In this study, a rapid non-destructive detection method for the gelatinization characteristics of millet was proposed based on visible/near infrared spectroscopy technology which was used to detect the gelatinization properties of millet without crushing millet granules. Firstly, the VIS/NIR diffuse reflectance spectrum of millet in the range of 370~1 020 nm was collected, and crushed the millet into millet flour subsequently, then seven gelatinization characteristics such as the peak viscosity (PV), trough viscosity (TV), breakdown(BD), final viscosity (FV), setback (SB), pasting temperature (GT) and peak time (PT) were determined by RAV rapid viscosity analyzer. After that, the reflectance spectrum was preprocessed by Savitzkye-Golay smoothing (SG), multivariate scattering correction (MSC) and first derivative method (1-D). Finally, combined different preprocessed spectra and millet gelatinization characteristics, the calibration sets and validations set of the samples were determined by Sample set partitioning based on joint x distances (SPXY), and then based on the Successive projections algorithm(SPA) the optimal wavelengths were selected, the multivariate linear regression (MLR) prediction models of millet gelatinization characteristic were established using optimal wavelength reflection spectral signal, and the validation set samples were used to verify the prediction accuracy of the MLR model. MLR models prediction results: for the parameters of PV, TV and SB, after MSC pretreatment, the MLR model established by 9, 17 and 18 optimal wavelengths was the best, the predicted correlation coefficients (Rp) were 0.934 7, 0.825 5 and 0.874 6 respectively, and the standard error of predicted residual (SEP) were 174.039 7, 67.220 3 and 74.281 8 respectively; for BD value, the MLR model with 14 optimal wavelengths after S-G pretreatment was the best with the Rp was 0.924 4, and the SEP was 178.020 1; in addition, for the FV parameters, after 1-D pretreatment, the prediction Rp and SEP of MLR model based on 16 optimal wavelengths were 0.853 1 and 132.166 7 respectively. The results show that it is feasible to detect the gelatinization properties of millet without crushing millet by using VIS/NIR diffuse reflectance spectroscopy combined with SPXY and SPA algorithm. This study provides a new technical means for millet products enterprises to determine the gelatinization characteristics of millet raw materials in the early stage of production rapidly and evaluate the processing quality of millet products, which has a high practical application potential.
Oct. 01, 2020Vol. 40 Issue 10 3247 (2020)
Li YUAN, Bin SHI, Jian-cheng YU, Tian-yu TANG, Yuan YUAN, and Yan-lin TANG
Moving window smoothing ensemble CARS (MWS-ECARS) is a stable algorithm for extracting characteristic variables. Based on the previous studies, two improved MWS-ECARS are proposed to reduce the dimension of black tea spectrum based on different window smoothing algorithms in this paper, and compared with the original MWS-ECARS, the commonly used successive projections algorithm (SPA), the competitive adaptive reweighting algorithm (CARS) and the moving window partial least squares method (MWPLS). A partial least square regression model (PLSR) was established to select the best black tea grade discrimination model. Two improved MWS-ECARS methods are Gaussian filter ECARS (GF-ECARS) and Median filter smoothing ECARS (MF-ECARS), respectively. The CARS algorithm runs n times (n=1 000 in this paper). The wavelength and its corresponding selected frequency are sorted out and different window smoothing algorithms are used to smooth the selection frequency. The window widths are all 3~31, and the window step sizes are all 2. The threshold is set through the selection frequency smoothed by different window widths and smoothing algorithm, and the starting threshold and step size are both 20. Finally, the wavelength whose selection frequency is higher than the threshold is selected and the PLSR model is established. The correlation coefficient of prediction set (Rp2) is taken as the judgment factor. The closer Rp2 is to 1, the more accurate the established model is. The results show that the black tea grade discrimination model established by the extracted characteristic variables with the improved GF-ECARS algorithm is the best. The Rp2 reaches 0.969 2. The reason is that the amplitude difference of each point on the curve will become smaller in the window Gaussian filtering smoothing algorithm as the window width increases. In the weighted average process of Gaussian algorithm, it is not easy to associate the low frequency wavelength with the high weight. In practical applications, the selection frequency of effective band is often low, which can be smoothed by selecting a Gaussian filter with narrow window width. In addition, due to the characteristics of the Gaussian curve, the Gaussian filtering algorithm can well protect the details of the window edge image. Although the modeling result of the MF-ECARS algorithm is slightly worse than the original MWS-ECARS, its Rp2 still reaches over 0.96. This shows that the improved algorithm can improve the prediction ability of the original model. MWS-ECARS extraction feature variables are different based on different window smoothing algorithms. However, as the smoothing window width increases, the continuity of the extracted characteristic variables is enhanced and the number of extracted characteristic variables is reduced. The Rp2 of the three MWS-ECARS algorithms all show that they are more effective and stable than the commonly SPA, CARS and MWPRS algorithms. This study can provide ideas for selective dimensionality reduction of spectral data.
Oct. 01, 2020Vol. 40 Issue 10 3254 (2020)
Yi-lin LIU, Hai-yan ZHANG, Hai-gen PENG, Long-lian ZHAO, Xiao-qiu TAO, and Jun-hui LI
The application of near-infrared spectroscopy technology for the rapid and accurate identification of attributes such as the origin and quality grade of agricultural products can play an important role in the acquisition and processing of agricultural products. However, the practical application of near-infrared technology for qualitative identification is rare because of certain problems related to the reliable of the model. Taking tobacco leaf samples with different parts (grades) in Sichuan Province, China as an example, this paper discusses a method for determining whether it is reliable to a grade identification model according to the main chemical composition, near-infrared spectroscopy and qualitative discrimination results; and a method for analyzing tobacco leaves grade characteristics according to main chemical composition and near-infrared spectroscopy. Within a certain ecological production area, a reliable leaf grade recognition model can be established, and the consistency of the material information base and the model identification results can verify the reliability of the model. By exploring the chemical composition and spectral characteristics, the possible grade characteristics of tobacco leaves in Sichuan Province are analyzed: the upper tobacco leaves have low total sugar, high nicotine, high total nitrogen, high cellulose and high amide content; the middle have high total sugar, middle nicotine, middle total nitrogen, middle cellulose and middle amide content; the lower has a high total sugar, low nicotine, low total nitrogen, low cellulose and low amide content. The methods used herein, such as the method for determining the reliability of qualitative models based on the material information basis and the method for analyzing the characteristics of tobacco grades based on the chemical composition and spectral characteristics, have reference value for modeling the attributes and chemical composition analysis of other agricultural products.
Oct. 01, 2020Vol. 40 Issue 10 3260 (2020)
Xiong LI, Yan-de LIU, Xu-dong SUN, Ai-guo OUYANG, Xiao-gang JIANG, Guan-tian WANG, and Yu-ping OUYANG
Corresponding to the internal chemical basic information of the fruit and the spectral information is the key to improve the model. For the current large thickness and a large volume of fruit, the visible/near infrared is poor in light transmission in the flesh region, the light refraction angle is difficult to determine, and the basic chemical information is not Accurate, resulting in poor quality prediction. In this paper, watermelon is the research object, and the intrinsic relationship between soluble solids and quality attributes in different regions of watermelon is discussed. Three hundred sixty samples are purchased in the fruit market. The parameters of the online detection device are divided into old parameters: integration time 100 ms, current 8.0 A and new parameters. The integration time is 150 ms, the current is 8.15 A to collect the watermelon spectrum, and the spectral absorption peak intensity is higher under the new parameters of the device. When the content of soluble solids in watermelon was determined, the watermelon was divided into 8 parts, and the heart sugar, medium sugar, peripheral sugar, base sugar (SSC) and mixed sugar (SSC) were determined respectively. The soluble solids in different parts of the pulp were large. The difference is that the most recent heart sugar value is the closest to the fruit center, and the lower the sugar value is, the closer it is to the melon skin area. Taking soluble solids in different regions of watermelon as the dependent variable, the new and old parameters of convolution smoothing (S-G) degraded spectral noise was used to establish a soluble solids partial least squares prediction model with independent variables, with 270 modeling sets and 90 prediction sets. The comparison model found that the new parameters improved the integration time of the sorting device and the tungsten halogen lamp current, which increased the prediction accuracy of the soluble solid model; while the soluble solids in the local area as the model’s dependent variable prediction effect was also higher than the mixed sugar. The model established by the variable, the bottom sugar region of the region close to the melon skin, due to visible/near-infrared incidence, and then a certain angle of refraction inside the melon, which indicates more watermelon fruit information, the modeling effect is the best, the prediction set the correlation coefficient is 0.89, and the root mean square error is 0.24. However, the internal information of watermelon fruit characterized by medium sugar and peripheral sugar region is less, and the modeling effect is poor. Therefore, the bottom edge of the watermelon is the best soluble solids collection area. This study reveals the characteristics of fruit light scattering and its intrinsic relationship with quality attributes, and realizes online updating of spectral database and analytical model.
Oct. 01, 2020Vol. 40 Issue 10 3265 (2020)
Lu WANG, Hai-ou GUAN, Wei-kai LI, Zhi-chao ZHANG, Ming ZHENG, Song YU, and Yu-long HOU
Salinity-alkalinity stress is one of the important of adversity factors that affect the kidney bean production and quality, the research of crop salinity-alkalinity stress is commonly by conventional chemical milling extraction method, the operation is complicated and time-consuming and destructive, such as for kidney bean canopy under salinity stress near-infrared (NIR) spectrum feature extraction, and quick nondestructive testing its salinity-alkalinity stress degree research rarely reported. In order to solve the problem of rapid detection of salt and alkali stress of kidney bean at the seedling stage, a new method for analyzing and detecting the NIR spectral characteristics of the canopy of kidney bean under salt and alkali stress was proposed based on near-infrared spectroscopy to study the characteristics of healthy and multi-grade salt and alkali stress of kidney bean at the seedling stage. Firstly, the spectral data of kidney bean canopy with healthy seeding stage and saline-alkali stress in the range of 990~2 452 nm with strong absorbance value were selected for study, and the original spectral data were pre-processed by using the automatic fitting detrend algorithm (DT) with a quadratic polynomial. Then a competitive adaptive reweighted sampling algorithm (CARS) was selected to extract 95 characteristic wavelengths sensitive to saline-alkali stress from the pre-processed data. The radial basis function was used as the hidden neuron to construct a three-layer feedforward neural network structure of type 95-282-7 (RBF). The network parameters were determined through the training set of samples, and the forward output value of the network was coded as a binary vector. Finally, the output vector was analyzed to the saline-alkali stress degree and the rapid detection method of saline-alkali stress degree of a kidney bean at the seeding stage was completed. The results showed that: (1) the original spectral curve was preprocessed in a variety of ways, and the correlation range of the study results was 0.339 4~0.946 1, the correlation range of DT pretreatment spectrum was 0.943 3~0.946 1, and the mean value was only 0.944 7, which could improve the accuracy of rapid detection of salt and alkali stress of kidney bean. (2) aiming at the near-infrared spectrum curve of kidney bean canopy pretreated by DT, CARS algorithm was optimized to extract the spectral characteristic wavelength vector of 95 dimensions. The total wavelength of kidney bean was reduced by 93.51%, effectively preserving the characteristic information source sensitive to salt and alkali stress. (3) application of CARS - RBF model for automatic rapid detection of kidney bean salinity-alkalinity stress degree in the study of 282 times, the mean square error (MSE) is 0.009 938 59, model checking accuracy reached 97.73%, so, this method is a new way of rapid non-destructive detection of saline-alkali stress degree of kidney bean, and can provide a technical reference for the rapid non-destructive detection of the saline-alkali stress degree of other crops.
Oct. 01, 2020Vol. 40 Issue 10 3271 (2020)
Cai-xia JIAO, Guang-hui ZHENG, Xian-li XIE, Xue-feng CUI, and Gang SHANG
Soil organic matter (SOM) is a crucial indicator of soil fertility and an important form of global soil carbon. It is the premise and basis of ensuring food security and assessing climate change to estimate SOM content and its changes rapidly. The traditional method of SOM determination is time-consuming with the high cost and environmental risks. Soil reflectance spectroscopy can be faster and cheaper than the conventional method, do not generate chemical residues and are non-destructive to the samples. However, spatial interpolation technique was still needed to map SOM after estimation of SOM in a point soil sample by reflectance spectroscopy. Imaging spectroscopy (also known as hyperspectral imaging) collects a spectral curve for each pixel, which enlarges the envelope of point spectrometry into a spatial domain and provides a technical basis for spatial mapping of SOM. This novel technique has not yet been fully utilized for SOM mapping. Therefore, the spectral index established by laboratory visible-short near-infrared imaging spectroscopy data can be used to estimate SOM and explore the mechanism, which lays a theoretical foundation for SOM mapping of remote sensing. In this study, a spectral index, named deviation of an arch (DOA), was established using the information of three wavelengths. The correlation between DOA and SOM was analyzed by the scatter diagram. Then, the samples were randomly split into training and validation data sets for 1 000 times. Nonlinear regression and partial least square regression (PLSR) were used to calibrate DOA or spectroscopy to SOM, respectively. The performances were compared to explore the feasibility of SOM estimation using imaging spectroscopy. The results indicate that the SOM content in the study area was relatively low, and its variation range was large. There was a significant logarithmic relationship between DOA and SOM. Logarithm function can be used to model DOA and SOM and provide reasonable and stable results. The performance of DOA regression is better than PLSR. The possible reason is that the spectral data used by PLSR contains some information unrelated to SOM, which affects the accuracy of PLSR. We can conclude that this spectral index, DOA, can be used for SOM mapping, although it is deduced from three wavelengths. It provides a new idea and methods for SOM mapping based on satellite remote sensing data in the future.
Oct. 01, 2020Vol. 40 Issue 10 3277 (2020)
Xiao-mei LIN, Si-yu TAO, Jing-jun LIN, Yu-tao HUANG, Chang-jin CHE, and Hao-ran SUN
In order to improve the stability of the characteristic spectral lines of laser-induced breakdown spectra of heavy metals in soil and the accuracy of soil quantitative analysis, the image optimization technology and laser-induced plasma technology were combined to analyze element Cu in soil. The two characteristics lines, Cu Ⅰ 324.75 nm and Cu Ⅰ 327.40 nm, were compared and analyzed by experiments. Finally, Cu Ⅰ 324.75 nm was selected as the analytical spectral line. The method of wavelet transform was used to denoise the spectrum, which eliminates the influence of matrix effect on the results and improves the stability of the spectral. Then the real-time acquisition of plasma images with different delays was carried out. The influence of delays on spot area and spectral intensity was analyzed, and the optimal delay was determined to be 900 ns. The RSD of different concentrations with the image optimization model was compared with that without optimization at the optimal delay time and the same energy. The optimal plasma image was selected by the image optimization model to calculate the RSD. It was found that RSD with improved greatly. The RSD of each concentration without optimization was 5.39%, 6.22%, 7.56%, 8.42% and 9.63%, respectively. The RSD with optimization was 3.24%, 4.47%, 5.32%, 6.13% and 7.21%, respectively. The method of image optimization effectively suppresses the continuous background radiation and improves the stability and repeatability of the spectrum. Compared with the data without image optimization, the RSD with optimization decreased by 2.15%, 1.75%, 2.24%, 2.29% and 2.42%, respectively. The date proved that the stability of detecting the content of copper in soil was greatly improved. Finally, the standard internal method was used to analyze the heavy metals in soil quantitatvely. Compared with the non-optimal condition, the accuracy and stability of the calibration model under the optimal condition were improved. The R2 increased from 0.978 to 0.995. It can be seen from the data above that image optimization technology greatly improves the spectral stability. The image optimization technology can greatly improve the quantitative analysis ability in soil heavy metal detection using LIBS.
Oct. 01, 2020Vol. 40 Issue 10 3282 (2020)
Peng WANG, Di SUN, Mei-rui MU, Hai-xue LIU, Ke-qiang ZHANG, Xiang-hui MENG, Ren-jie YANG, and Run ZHAO
In order to achieve on-site, rapid and relatively accurate acquire the total nitrogen (TN) content of manure in the large-scale dairy farm that is going through the whole sections from the barn to the farmland before, 111 manure samples during the whole process (collection-separation-stacking) were collected from a typical large-scale dairy farm in Tianjin lasting for 6 consecutive days. All samples were dried using electrothermal blast dryer, rushed and sifted through 18 meshes. The total nitrogen contents were measured by Kjeldahl nitrogen analyzer, and the range of concentration is 0.20%~3.86%. Near-infrared (NIR) diffuse reflectance spectra of all samples were collected in the range of 4 000~12 000 cm-1 using the PerkinElmer Fourier NIR spectrometer. 17 outlier samples were removed based on Monte Carlo cross validation method. The NIR diffuse reflectance spectra of the remaining 94 samples were pretreated by SG first derivative and denoising. Then, the principal component analysis was adopted to obtain the variation of samples in the whole process of fecal treatment in large-scale dairy farm. The first two principal components (PCA) can explain 89% of the total variance. The results of PCA showed that the properties and components of fresh feces of dairy cows in different reproductive ages were similar. From feces to manure, the properties and components of fresh feces were not changed any more. However, the properties and components were greatly changed in the bedding stage. Therefore, it is necessary to establish a global TN quantitative analysis model suitable for the whole process of fecal treatment for realizing the real-time and rapid detection of TN in the whole process of fecal treatment in large-scale dairy farms. 94 samples were divided into calibration and prediction sets based on K-S method. 63 samples, including 24 fresh manure samples, 28 mixed manure samples and 11 cushion samples, were used as calibration set to construct a calibration set. The partial least squares model for quantitative analysis of TN was established in the whole process of fecal treatment in large-scale dairy farms. 31 unknown samples, including 12 fresh manure samples, 9 mixed manure samples and 10 cushion samples, were predicted by the established global model. The correlation coefficient (R) between the predicted concentration and its actual concentration was 0.91, and the root means square error of prediction (RMSEP) was 0.151%. The research showed that it was fully feasible to determine the TN contents in the manure of large-scale dairy farms integrated the near infrared diffuse reflectance spectroscopy with chemometrics, not only providing the theoretical and experimental basis for the development and field application of a near-infrared instrument for rapid detection of TN in the manure, but also the support for quantitatively recycling the manure to the farmland.
Oct. 01, 2020Vol. 40 Issue 10 3287 (2020)
Peng-fei DING, Yu-zhu LIU, Qi-hang ZHANG, Yi-hui YAN, Wen-yi YIN, and Yu CHEN
The burning of straw has great harm to the atmospheric environment. During the combustion process, heavy metal elements will float into the air along with the smoke, causing a certain degree of pollution to the atmospheric environment. Therefore, it is of great significance to detect the heavy metal elements that spread into the air with the smoke of straw combustion. Laser Induced breakdown Spectroscopy (LIBS) is used to detect the straw smoke, and to analyze the heavy metal. The experimental setup consists of Nd:YAG single pulse laser (wavelength: 1 064 nm, laser energy: 290 mJ·pulse-1, frequency: 10 Hz), Avantes spectrometer (AvasSpec-ULS2048-4Channel-usb2.0, spectral range: 200~890 nm, resolution: 0.13 nm), reflector, focusing lens (focal length: 150 mm), pulse delay generator. The delay time of spectrometer was set at 6 μs. The laser beam is focused on the smoke by the lens, and generates high-temperature plasma. The LIBS spectrum signal is obtained by the spectrometer. The samples were mature rice stems and leaves in east China. For the LIBS detection of air, N, O, Hα, and Hβ elements can be observed in the spectra. Under the same experimental conditions, the smoke of the burning straw was detected by LIBS and the spectrum demonstrates that the smoke consists of C, Mg, Ca, Mn, Na, K and other elements. The observation of the heavy metal element Mn verifies the feasibility of the LIBS detection of heavy metal elements in smoke of burning straw. At the same time, the molecular spectrum of CN radical was observed in the smoke spectrum. CO2 molecules generated in the combustion process of straw could react with N2 in the air under the irradiation of laser to form CN molecules. Then the detection of the breathing of human by LIBS was carried out under the same condition, and CN emission bands were also observed in the obtained spectra. What’s more, LIFEBASE software is used to fit the emission bands of the CN molecule. Moreover, the result shows that the vibration temperature and rotation temperature of CN molecules are 8 000 and 7 700 K, respectively. Straw samples containing Pb were prepared by using lead acetate solution. Two samples of the same quality were soaked in different concentrations of Pb solution and dried. Online in situ LIBS detection was carried out on the two samples, and the spectra were obtained. By comparing the straw samples containing Pb with the original straw samples, five spectral lines with wavelengths of 357.261, 363.898, 368.370, 373.945 and 405.747 nm were found in the spectrum of the straw samples containing Pb. Compared with the NIST database, it is found that the five spectral lines are all characteristic spectral lines of Pb. Taking CaⅡ(393.329 nm)as a reference line in the signal normalization process, the intensity of Pb line in the sample with the high concentration of Pb is significantly higher than that in the sample with the lower concentration of Pb. It verifies that the online in situ LIBS detection is promising to apply to the semi-quantitative analysis of heavy metals of straw combustion and soot.
Oct. 01, 2020Vol. 40 Issue 10 3292 (2020)
Bin JIANG, Mei-xia QU, Qing-wei LI, Shu-hua CAO, and Yun-peng ZHONG
White dwarf main sequence binary star (WDMS) is a kind of binary star system, the main star is a white dwarf star, and the companion star is a small mass main-sequence star.WDMS has an important meaning to study the evolution of close binary stars, especially the evolution of the common envelope. Many physical parameters, such as effective temperature, metal abundance, and surface gravity acceleration can be obtained by studying the spectra of WDMS. The accurate measurement of these physical parameters can not only solve the classification problem of WDMS but also provide basic data for the study of binary star theoretical model.The spectra of WDMS is synthetic spectra, which consists of the spectra of the main star and companion star. WDMS spectra have two major limitations, one is noise interference, and the second is that the blue and red parts are suppressed by the spectral characteristics of the host and companion stars respectively.It is very meaningful to obtain the spectra of white dwarf and companion star by analyzing the spectra of WDMS. At present, the main decomposition method is to use a large number of the white dwarf and M-type star template spectra to fit the WDMS spectra and use the best combination of a group of spectra to represent the spectra of white dwarf and companion star, so as to obtain various physical parameters of stars. This method needs to traverse all spectral combinations and will consume many computing resources due to the matching by the template. Generative adversarial network (GAN) has a good effect and application in signal reconstruction.Based on GAN, this paper constructs a neural network to decompose the spectra of WDMS and directly generates the spectra of white dwarf and companion star through the network. The network model in this paper is an unsupervised learning model, and only three kinds of spectra including WDMS spectra, white dwarf and M-type template spectra, are required for model training, without the intermediate results of other decomposition methods.The model proposed in this paper is easy to be optimized, and some network models can be replaced by CNN and RNN etc. The improvement and optimization methods that can be used to the neural network are also applicable to the network model in this paper.The experimental model in this paper was built with PyTorch deep learning framework and use GPU for accelerated training.This method is used to decompose 1 746 WDMS spectra of SDSS. Compared with other methods, the results show that the trained network model can give similar results with less computational resources. It proves that this model has a good ability to decompose spectra. This method can also be applied to the decomposition of other binary star spectra.
Oct. 01, 2020Vol. 40 Issue 10 3298 (2020)
© Copyright 2018-2021 | Chinese Laser Press.
All Rights Reserved 沪ICP备15018463号-20