


Please enter the answer below before you can view the full text.


2020
Volume: 39 Issue 6
15 Article(s)

Jianhua MA, Changxu HAN, and Yuling JIANG
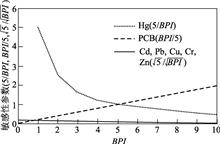
Through reviewing 2323 papers on the potential ecological risk index (RI) proposed by H?kanson during 2001-2018, especially focusing on 203 papers published in some famous journals at home and abroad since 2008, the following problems were found: (1) H?kanson's RI is an ecological risk assessment method based on the theory of water environment sedimentology. Therefore it is not suitable to be applied to soil, especially not to water solute, atmospheric particulate matter, surface dust, plant or crop, etc. However, 49.29% of the 2323 papers have misplaced evaluation objects. (2) The grading criteria of potential ecological risk factor (Er) and RI proposed by H?kanson can not be mechanically copied. So, it should be adjusted according to the specific types and quantities of pollutants studied. The limit value of the first level of Er should be the maximum value of toxic coefficient (Stmax) of all the evaluated pollutants, and the limit value of the first level of RI can be obtained by ∑St i×1.13 with ten integers. However, most of the studies ignored the types and quantities of the pollutants, and copied indiscriminatingly the Er and RI classification criteria of H?kanson, which led to incorrect conclusions. The papers used the incorrect criteria of Er and RI, taking up 49.01% and 61.40% of the 203 papers, respectively. Although some researchers had adjusted the RI classification criteria according to the types and quantities of pollutants, only 23.81% of the papers are correct. (3) When only single ecological risk of Hg or comprehensive ecological risk of multiple heavy metals including Hg are evaluated, the StHg can not be replaced by TrHg.
Jun. 20, 2020Vol. 39 Issue 6 1233 (2020)
Xi JIANG, Wenqi CHEN, Fan NING, Jun ZHENG, Weijun LOU, and Yong ZHOU
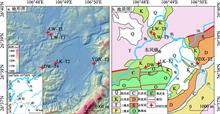
Studying river terrace is an important way to explore regional evolution of hydrology, paleoclimate and geomorphology. There is few reports about terraces of Guizhou because intense weathering results in poor profile preservation in this area. In Wudang Basin, a typical intermountain basin located in central Guizhou, Neotectonic movement resulted in a well-preserved sequence of four terraces, which indicates the regional crustal uplift and basin evolution clearly. In this article, measurements on gravel fabric and grain size of sediments are used to analyze the sedimentary environment of terraces. And then, combined with optical luminescence (OSL) dating, the discussion is focused on evolution age and process of Wudang Basin. The results show that in the study area, the gravels are poorly sorted and varying roundness but well orientated with river flows. The fact that lithology of gravels possess distinct inheritance indicates that they come from the surrounding stratum. Based on the gravel fabric analysis, it is concluded that the basin experienced an intense erosion during tectonic uplift. Grain size measurements on floodplain sediments present that dynamics of the rivers have an increasing tendency, which indicates regional climatic changes during a relatively tectonic stable stage. In stages of T4 and T3, there was erosion and denudation in Wudang Basin, which formed the embryo of the modern geomorphology. OSL dating shows that the age of T2 terrace is from 177.4 ka to 87.6 ka, which is consistent with the last interglacial in the sequence of Chinese glaciations and MIS5 (125 to 75 ka). So it is held that in stage of T2, warm and humid climate was important for terrace deposit up to a 10-m thickness. Based on sediment characteristics and time series, it is believed that at the late stage of Middle Pleistocene, there was a sedimentary leveling lasting for tens of thousands of years before Wudang Basin basically formed. The age of T1 terrace is about 25 ka, indicating the last tectonic uplift of Guizhou and the final shaping of Wudang Basin.
Jun. 20, 2020Vol. 39 Issue 6 1242 (2020)
Hui GU, Guoping TANG, and Tao JIANG
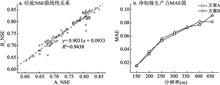
This study used CHESS (The Coupled Hydrology and Ecology Simulation System) to explore (1) how the model's parametrization scenarios affect model simulation driven by forcing data of different spatial resolutions; (ii) how the spatial resolutions of model-forcing data affect model results; and (iii) how the selection of drainage area threshold affects model simulations. Eight sets of driving data of different spatial resolutions, two independent parameterization schemes A and B as well as nine sets of drainage area thresholds are developed in this study for analyses. As for the parameterization scenarios, the scheme A/B first parameterizes the model based on high-resolution/low-resolution forcing data. Then, the parameterization results are applied to simulations driven by low-resolution/high-resolution data. Based on the results from the parameterization scenario B, the effects of spatial resolution of model driving data on simulated land-surface eco-hydrological processes are investigated. Our results indicate that the simulated eco-hydrological variables between schemes A and B are strongly correlated and their differences are minimal. This indicates that the model's parameterization is not sensitive to the resolutions of model driving data. Additionally, the resolution of model driving data has little effect on the land cover and soil types but it greatly affects the elevation and slope of the study catchment. With the decrease in spatial resolution of model driving data, the elevation and slope of the catchment decrease, the micro terrains suffer from loss, and the terrain becomes flatter. Through the statistical analysis of simulated eco-hydrological variables, we found that the mean value of simulated runoff decreases, the peak value increases, and the value of ecological variable increases with the decrease in the resolution of the driving data. Besides, there is no significant interaction between the resolution of driving data and the selection of drainage area thresholds. With the increase in drainage area threshold, the mean and peak values of runoff decrease and so do the magnitudes of modeled ecological variables. Nevertheless, the selection of drainage area thresholds does not affect the peak time of runoff.
Jun. 20, 2020Vol. 39 Issue 6 1255 (2020)
Shibing ZHU, Zhiqiang LI, Huiling ZHANG, Chunhua ZENG, and Haiyin CHEN
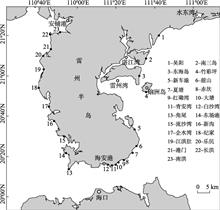
Beach morphodynamic provides a theoretical framework for understanding the beach morphology and coastal dynamic environment, and has important guiding significance in beach protection and development. In order to determine the beach classification on the Leizhou Peninsula, 7 quantifiable beach characteristics about geological background, beach morphology, beach sedimentation and coastal dynamic factors were selected. Results show that: (1) beaches on the Leizhou Peninsula coast can be divided into 6 groups: reflective group, low tide terrace/reflective group (with rip current), sand bar-trough/middle state group, barred dissipative group, ultra-dissipative group and low tide terrace/reflective group (without rip current). (2) Wave, tide, sediment characteristics and coastal background of geological structure have different effects on the beach state in the study area. Factors have different influences on different coastal sections on Leizhou Peninsula. Geological background is an important factor in beach classification. (3) Because the Ω-RTR model is more focused on dynamic and sedimentary factors in identifying beach state, classification results derived from Ω-RTR model are slightly different from those from cluster analysis. As a whole, the Ω-RTR model can effectively distinguish beach state type and is an effective means to understand beach morphodynamic system.
Jun. 20, 2020Vol. 39 Issue 6 1269 (2020)
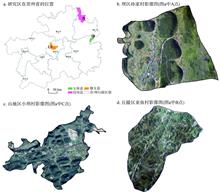
Hongyu REN, Yuluan ZHAO, Xiubin LI, and Yujuan GE
Studying the scale effect of cultivated land fragmentation is of great significance for remote sensing monitoring, remediation and sustainable use of cultivated land in mountainous areas. This paper selects three types of typical landforms with different geomorphological backgrounds as the case area, namely, Sunjia village in the dam area, Yayu village in the hilly area and Xiaoba village in the mountain area. The fragmentation measurement model is constructed to quantitatively analyze the scale effect of the degree of cultivated land fragmentation at the five resolutions of 0.1 m, 1 m, 2 m, 5 m and 10 m in Guizhou mountainous areas. The main conclusions are as follows: (1) with the decrease of image resolution, the characteristics of cultivated plots under different landscapes have obvious scale effects. (2) There are differences in the degree of cultivated land fragmentation under different geomorphological backgrounds. The fineness of the hilly area is the highest, followed by the dam area, and the mountain area is the lowest. The degree of cultivated land fragmentation at different image resolutions has obvious scale effect, and the index of cultivated farmland fragmentation in all the three typical villages show a power function decline. In addition, the degree of cultivated farmland fragmentation with different geomorphological backgrounds is different in response to scale changes. The grain size response of cultivated land in the dam area is the strongest, followed by the hilly area and that of the mountain area is the weakest. (3) With the previous scale as a reference to calculate the loss accuracy, the degree of cultivated land fragmentation in the dam and hilly areas is the most sensitive when the image resolution is changed from 2 m to 5 m, while the sensitivity of the mountain area to the scale change is increasing. When the basic scale is used as the reference, the degree of cultivated land fragmentation in the hilly area is the most sensitive to the scale change, followed by the mountain area, and the lowest is in the dam area. The study aims to provide reference for the investigation, evaluation and treatment of cultivated land fragmentation in mountainous areas.
Jun. 20, 2020Vol. 39 Issue 6 1283 (2020)
Dan WANG, Bin FANG, and Xin LI
Spatial association is fundamental in understanding the theory and reality of the city-industry integration. This paper investigated the association between residential and industrial space based on historical maps and other data. Hot spot analysis and honeycomb grid method were used to quantify the association. The association was also analyzed at micro level to reveal its general mechanisms, and long-term and micro-level pattern. The results show that: (1) there is significant spatio-temporal association between the residential and industrial space, which experienced an evolution process featured by a strong-week-strong pattern. The two kinds of space were highly integrated before 1949 and planned economy period, but were gradually separated during the double-track period and the market economy. There is a new trend of the city-industry integration of residential, industrial and service space during the last decade driven by industrial upgrading. (2) The spatial pattern of the residential-industrial association transformed from arbitrary and irregular to consistent and regular, which reflected the transforming process of the residential space from industry-dependent to residence-dominant. (3) The evolution of the spatial association between residential and industrial space was driven by four major factors: the main body of residential space construction, industrial types, commuting conditions, and the influence of external space.
Jun. 20, 2020Vol. 39 Issue 6 1295 (2020)
Na LI, and Shidai WU
China is one of the major countries attracting FDI. However, there is a structural discrepancy between low-cost-oriented FDI and the upgrade of manufacturing industry agglomeration. Against this backdrop, attention is focused on reshaping regional competitiveness so that manufacturing industry agglomeration can enhance an effective use of external resources, overcome the predicament of the structural discrepancy, and accelerate the transformation and upgrading of the industrial structure. However, current research looks at the problem between the endogenous growth power and the innovative space of FDI and agglomeration in isolation, and it cannot clearly recognize the effect of the transformation of FDI based on agglomeration, which limits the understanding of the two-way effect and evolution of organized production during FDI and agglomeration. Therefore, this paper takes the technological transformation of FDI as a new perspective to analyse the mechanism of this transformation and the path of the innovative spatial response based on manufacturing industry agglomeration by setting up a stochastic frontier production function model, a cross-item model and the spatial Doberman model and by using data covering 264 cities in China over the period 1999-2015. The results show the following: (1) The technological transformation of FDI is an important driving force for the innovation of manufacturing industry agglomeration. (2) The analysis based on Marshallian externalities finds that the dual role based on the scale effect of manufacturing industry agglomeration and the diffusion effect of FDI is a functionary mechanism for the technological transformation of FDI. (3) The analysis from the region, industry and location perspectives reveals that the embeddedness of FDI helps to push the formation of the link of the trans-regional production network, promotes the transmission of spillovers from technological progress through the network platform, and then pushes the formation of an innovation network for production. The formation of the regional innovation network withnesses a rapid increase in TFP for adjacent spaces, alleviates the polarization in regional development, and promotes balanced regional development. This paper implies that China should continue to implement the basic national policy of opening wider to the outside world, absorb foreign investment through cooperative industrial development policy, and promote clustering from single polarization to chain cooperation. This study makes an effort to provide scientific evidence and policy implications for boosting China's opening up and building its innovative system and for promoting the agglomeration of the manufacturing industry and the high-quality development of the regional economy.
Jun. 20, 2020Vol. 39 Issue 6 1311 (2020)
Hu WEN, Qiangguo ZHANG, and Xu SU
Internet has exerted a tremendous influence on the spatial distribution and organization of the Chinese television industry. In this paper, 318 of the most representative works in each section, including internet and television dramas, are selected as research samples from 2016 to 2017. By virtue of both the relationship data and geographic information of enterprise cooperation in three value chain links (teleplay production, shooting and post-production), we construct the internet drama production network (IDPN) and the television drama production network (TDPN) in two dimensions of enterprise and city, respectively. Then, the structural differences of the two networks are mainly analyzed by using social network analysis. After that we reveal the impact of the Internet on the spatial distribution and organizational operation of the Chinese television industry. The research result can be shown as follows. (1) From the perspective of spatial distribution, enterprises producing Internet dramas are more concentrated in space than those producing television dramas, especially in cities of Beijing-Tianjin-Hebei region and Yangtze River Delta. (2) Compared with the TDPN, the core city nodes and strong ties between cities in the IDPN are focused more in eastern China. Concretely, in the former network, only 6 of the top 10 core city nodes in centrality degree are located in the eastern coastal area, that is, only 5 pairs are involved in the tie strength linking Beijing and the other 5 eastern cities, accounting for a small portion (25.92%) of the total tie strength. However, in the latter network, the corresponding data cover 9 nodes located in the eastern cities, namely 8 pairs (Beijing and the other 8 eastern cities) with a percentage of 51.20% of the total tie strength. (1) From the perspective of organizational structure, the IDPN has less enterprise nodes (1002) and non-repetitive connections (4189) compared with the TDPN (1530 and 14087), and their network densities are 0.84% and 1.20%, respectively. It implies that compared with the IDPN, the TDPN has smaller scale but more flexible inter-firm division of labor. (2) The centralization of the IDPN (2.70%) is lower than that of the TDPN (3.47%). In addition, the ownership attributes of the core enterprise nodes are different. The IDPN presents a pattern of tripartite confrontation among three private internet film and television enterprises, while the state-owned CCTV is in a dominant situation in the TDPN. (3) Compared with the TDPN, small business groups with the strongest cohesion in the IDPN are more geographically open and institutionally inclusive. Contrary to the conclusion that the internet will bring about "the death of distance" and "the end of geography", our results support the academic viewpoint that the internet will reshape the value chain of cultural and creative industries and further impact the power pattern among enterprises.
Jun. 20, 2020Vol. 39 Issue 6 1329 (2020)
Guojun YU, Canfei HE, and Shengjun ZHU
How the regional economy resists external shocks and redevelops is a research hotspot in economic geography in recent years. Taking industrial cluster as the starting point, this paper criticizes the existing regional resilience theory based on the evolutionary economic geography, and proposes a Technology-Relation-Market trinity understanding framework which is applicable to understand the cluster resilience. Taking the D oil drilling equipment cluster in S province as a case, the process of resisting and re-development of the cluster after two external shocks was scrutinized. Through interviews with government departments, key enterprises, and analysis of various texts, it is found that cluster resilience is expressed through three ways: Technological innovation, relational governance, and market diversification. The conclusion challenges the regional resilience theory based on the evolutionary economic geography which emphasizes external technological innovation. It believes that internal technological innovation is also an important source of regional resilience. What is more, relational governance and market diversification are two other important dimensions to regional resilience.
Jun. 20, 2020Vol. 39 Issue 6 1343 (2020)
Tingting YU, Bing ZUO, Yuxiang SONG, and Yuanyuan WU
The development of tourism has gradually strengthened its correlation and driving effect on the national economy. Tourism is an important part of the service industry, and the increase of its share means the growth of non-essential consumption, which provides a strong market driver for China's overall economic development. The government emphasizes the driving effect of tourism on economic development. According to the 13th Five-Year Plan (2016-2020) for tourism development, tourism should be developed as an important force in economic transformation. Based on the panel data of 283 prefecture-level cities in China from 2002 to 2016, this study adopts DEA model to measure the comprehensive efficiency, technical efficiency, and scale efficiency of each prefecture-level city. It then establishes spatial-econometric models to investigate the impacts of tourism development on comprehensive efficiency of economy. The main findings are as follows: (1) Overall, the comprehensive efficiency of the sample cities shows a tendency of rising first and then falling, and input-output efficiency is at a low level. Only a few cities achieve the optimal efficiency. The comprehensive efficiency is roughly equivalent in the eastern and central regions, while that of the western region is relatively low. (2) Tourism development can significantly improve the comprehensive efficiency of the cities, which is reflected in the positive change of 0.064% for every 1% increase in tourism revenue. And its effect on the overall efficiency of the economy is significantly higher than that of human capital, proportion of output value of secondary production, number of employees in secondary and tertiary industries, and proportion of government fiscal expenditure. (3) There are regional differences of tourism in improving comprehensive efficiency in China. The effect of tourism development on comprehensive efficiency in the western region is larger than that in the eastern and central regions. This can be attributed to the different development stages of different regions in China. The western region is at the stage of increasing returns to scale, while northeast and central regions, especially their large cities, have entered the mature stage of development, featuring constant marginal returns or decreasing marginal returns.
Jun. 20, 2020Vol. 39 Issue 6 1357 (2020)
Zhicai WU, Lingyuan ZHANG, and Shihui HUANG
In this study, we use the modified gravity model and social network theory to analyze the spatial structure and characteristics of the tourism economic connections among cities in the Guangdong-Hong Kong-Macao Greater Bay Area from 2008 to 2016 and propose a new cooperation model and some strategies to enhance the tourism economy in the region. The results show that first, the number of tourism economic links in the Guangdong-Hong Kong-Macao Greater Bay Area grew rapidly, and the links between particular cities strengthened, especially those between Guangzhou and Foshan, Macao and Zhuhai, and Hong Kong and Shenzhen. Second, the node centrality of the overall tourism economic network in the study area increased, indicating that the tourism economic network among the 11 cities in the Greater Bay Area gradually shifted from a multi-core structure toward a network structure. In terms of the direction of flow of tourism economy, Guangdong, Hong Kong, and Macao are outflow cities of tourism resources, while the other eight cities are inflow cities, indicating that the diffusion effect exceeds the linkage effect over the entire network. Third, the tourism economic links in the Greater Bay Area increased in strength, resulting in increased network density. There are obvious hierarchical differences between the core and edge areas in the network structure, which can be divided into three agglomerating subgroups: Guangzhou-Foshan, Hong Kong-Shenzhen-Dongguan, and Zhuhai-Zhongshan-Macao. Finally, based on the concept of "collaborative hierarchical network development", we propose a "tourism city center-tourism city cooperation circle-tourism global destination network" path to enhance tourism economic cooperation in the study area. In practice, we need to recognize the key roles that Guangzhou, Hong Kong, Macao, and other key cities played in the tourism-based economy, and focus on the transformation of the population, capital, and flow factors of other cities in relation to tourism development to strengthen the tourism foundations in this emerging region. Tourism can also result in ecological, economic, and environmental costs, and thus it is also necessary to focus on whether the policy of subsidizing tourism has a positive overall impact on the economic growth of the Greater Bay Area and its surrounding cities. How to maintain a positive relationship between economic growth and tourism should also be the focus of further research.
Jun. 20, 2020Vol. 39 Issue 6 1370 (2020)
Rulong ZHUANG, Guangqin LI, Longwu LIANG, and Kena MI
Turning counties into districts (TCID) is a policy of administrative division adjustment in order to alleviate the strain on land resources, promote urbanization and speed up regional economic integration. But its multidimensional impact on regional economy and its mechanism remains to be further investigated and verified. Therefore, under the help of Difference-in-Difference Method, the paper takes Guangdong province as the research area and uses the panel data of 79 counties (cities) from 2000 to 2015 to analyze and solve the above problems. The results show that: TCID significantly promotes the regional economic growth. Generally, its contribution to the regional economic growth rate was 0.48%; the policy effect performed better in the Pearl River Delta and less stably in other regions. The embodiment of policy dividend has time lag, and generally and emerges in the third or four year. In addition, TCID can get the infrastructure, planning, policies and other strong support. Meanwhile, increasing financial revenue and investment in fixed assets helps the development of secondary industries and related industries. Finally, it is effective to promote regional economic growth by raising employment rates and stimulating consumption. The policy recommendations of this article aim to, with the opportunity to reform the administrative system, organically combine the development of industry with the service industry, especially the productive service industry, speed up the optimization and upgrading of the local industrial structure so as to promote the sustained, healthy and rapid development of the regional economy.
Jun. 20, 2020Vol. 39 Issue 6 1386 (2020)
Qiong LI, Yang ZHAO, Songlin LI, and Xiangling LI
Entropy method, coupling coordination model, standard deviation ellipse model, spatial autocorrelation, etc., were used to measure the coupling coordination degree of social security and economic development in China from 2002-2017, and examine its spatio-temporal differentiation. At the same time, the influence degree and driving force were analyzed by grey correlation degree model and Pearson correlation coefficient. The results show that: (1) in terms of time series, the coupling coordination between social security and economic development in China is increasing, but lags behind the development of social security and the economy. The average annual coupling degree of the four major regions is Eastern region > Northeast region > Central region > Western region. (2) As for spatial aspects, the pattern of coupling and coordination between social security and economic development is solidified and dynamically changing, mainly due to the alternation of general maladjustment and forced coupling and coordination, and its spatial distribution has a tendency of aggregation. (3) In terms of driving force, five factors, namely, per capita disposable income of urban residents, per capita net income of rural residents, per capita GDP, urbanization rate and employment number of private economy, are the important driving forces of the coupling and coordination pattern of social security and economic development.
Jun. 20, 2020Vol. 39 Issue 6 1401 (2020)
Kaihua WU, Chaokui LI, Junjie LIU, and Haojie HAO
Accurately identifying the boundary of the core areas in the process of urban agglomeration construction is an important part of urban agglomeration research. In this paper, a method of extracting urban agglomeration growth boundary is proposed: using spatial syntax to analyze urban agglomeration road network, fusing the four analysis indicators into a new index "urban agglomeration cluster degree", and putting forward the "urban agglomeration cluster degree" contour and "urban agglomeration cluster degree" curve, finding the best threshold through mathematical calculation, thus extracting the urban agglomeration core area growth boundary. This paper takes the Changsha-Zhuzhou-Xiangtan urban agglomeration as an example. The research results of this method are compared with those of the classical method. After the data quality factor is removed, the growth boundary recognition error of the core areas of urban agglomeration is expected to be controlled within 10%. Experiments show that the urban agglomeration core area growth boundary recognition method based on spatial syntax theory is easy to obtain research data, and has a wide application range and high reliability. The research content and methods proposed in this paper can provide a new idea for urban and urban agglomeration research.
Jun. 20, 2020Vol. 39 Issue 6 1418 (2020)
Dongya CHENG, and Xudong LI
The Wujiang River Watershed in Guizhou province is one of the most important plateau mountain basin in Southwest China. It is of great significance to examine the relationship between population distribution and topography of this watershed. This paper can help to understand the impact of the geographical environment of the study area on population distribution. The article selects digital elevation model (DEM) data and population raster data, and uses digital elevation model (DEM) to extract topographic factors such as altitude, slope, and topographic relief. Then, it studies the relationship between topographic factors and population distribution. Some conclusions can be drawn as follows. (1) The population of the study area is inportantly distributed between 800 and 1400 m, accounting for more than 60%, and the highest population density is found between 1000 and 1200 m. (2) As the slope increases, the population and population density are in a downward trend. When the slope is less than 5 o, the population density is more than 500 people/km 2. It is also shown, to a certain extent, that the slope has a restrictive effect on human activities and is one of the key topographic factors that affect the population distribution. (3) With the rise of topographic relief, the population density generally shows a downward trend. When the topographic relief is less than 50 m, the population density exceeds 1000 people/km 2. Topographic relief is an important factor affecting population distribution. The results could provide a reference for the local government to formulate policies on population and eco-environment protection so as to achieve harmony between nature and people. In addition, this article can be further expanded in the following aspects: (1) using the latest population raster data to analyze the relationship between population and topography, and explore the characteristics and laws of population changes in the watershed in the background of rapid economic development in Guizhou province in recent years; (2) using the digital elevation model (DEM) with a lower accuracy to analyze the relationship between population and topography.
Jun. 20, 2020Vol. 39 Issue 6 1427 (2020)
© Copyright 2018-2021 | Chinese Laser Press.
All Rights Reserved 沪ICP备15018463号-20