


Please enter the answer below before you can view the full text.
8+2=
Place is a very important geographical concept. Scholars especially geographers have conducted extensive studies on place. Focusing on the issues and theories of place, this article explores how to couple human geography with Geographic Information System (GIS), with a focus on geographic issues in large-scale urban space and small-scale communities. This is particularly critical for geographic study in China. The main title of this article, "rebuild place", has three meanings. First, it is necessary to break disciplinary boundaries in order to rediscover the new field of "place", especially based on complex and changing theories and practice of place. Second, we should strive to change the "place" in everyday life according to the new theories. Last but not least, rebuilding place in our lives or minds will be achieved by means of coupling theories and practice, thoughts and technology, as well as human geography and GIS. Through using volunteered geographic information (VGI), 3D-VQGIS, and other new GIS methods, the theories and methods on place research can be enriched with big data and other types of data. The combination of human geography and GIS not only has practical significance, but also helps developing new methodologies. Place and scale are complex in reality and in research. For instance, issues in community and in city interact and can be transformed because some micro-scale individual or community events can affect the whole city or urban culture. Interactions at city level or community level are the same to some extent but often different. In the study of China's urbanization and rural-urban relations, it is urgent to introduce, use, and recreate the theories on place with GIS and multi-scale cases. In terms of methodology, combining human geography with GIS will reshape geography. In addition to being an indispensable concept of geography, place is also closely related to everyday life. Dealing with the challenges from evolving globalization and information and communication technologies, place is changing, and the concepts on place or placelessness are also evolving correspondingly. It is significant in geographic research and practice to couple human geography with GIS and explore the way to apply the methodology to explain changing issues in the real world with different temporal, spatial, and social scales, so as to rebuild the place theoretically and practically.
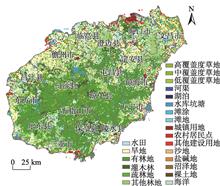
Quantitative assessment of regional human activity intensity can reflect the relationship between people and environment, which can provide a scientific basis for landuse-related decision making and eco-environment construction. Based on the land use/land cover data with 1 km resolution, we quantitatively evaluated the spatial-temporal features of human activity intensity in Hainan Island from 1980 to 2018. On this basis, we analyzed the overall change and spatial correlation of human activity intensity and explored its driving mechanism. The results showed that: 1) The main types of land use were woodland and farmland in the study area in 2018, accounting for 62.85% and 25.27%, respectively. Only bulit-up land increased sharply, and areas of all other land use types reduced from 1980 to 2018. The areal reductions of farmland and grassland were the largest and the decreases were 397.81 km2 and 303.02 km2, respectively. 2) Human activity intensity gradually increased from 10.54% (1980) to 12.86% (2018), risen by 22.01%. Before 2000, it was relatively stable and after that, it grew fast. 3) The spatial distribution of human activity intensity was high in the coastal areas and low in the central part of the island. Human activity intensity showed significant spatial agglomeration effect and the hotspots were concentrated mainly in areas of rapid urban development, such as Haikou City and Sanya City. 4) The human activity intensity in Hainan Island was mainly driven by government policy, rapid population growth, economic development, and so on.
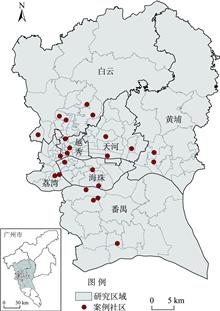
As China enters the stage of "New Normal" development, promoting people's subject well-being has become an important target of the new-type urbanization. Meanwhile, improving the living environment is considered an inevitable requirement for improving the quality of urbanization. Although a substantial body of literature has focused on the linkage between the neighborhood environment and subjective well-being, only a few studies have attempted to unravel the intermediate mechanism of the relationship. Additionally, previous research mostly evaluated neighborhood built environment based on the administrative jurisdiction, rather than the real activity space of residents, ignoring the modifiable areal unit problem (MAUP). Using the survey data collected in 23 residential communities between June and August 2015 in Guangzhou City, China, this study explored the built environment factors that affect subjective well-being with a multilevel linear regression model, paying special attention to the impact of buffer zone redrawing on the analysis results. Mediation analysis was also adopted to reveal the mediating effect of residential satisfaction, while stratified analysis was applied to explore the impact of respondents' objective socioeconomic status heterogeneity on the relationship between built environment and subjective well-being. Several conclusions were drawn as follows: 1) Compared with the indices extracted from administrative jurisdiction and 1000 m buffer, the indices extracted from 15-minute walking distance have higher correlation with residents' subjective well-being. 2) Per capita green space area and point of interest (POI) density are positively correlated with residents' subjective well-being, while population density is negatively correlated. 3) Mediation analysis indicated that residential satisfaction fully mediates the relationship between POI density and subjective well-being. 4) The correlation between neighborhood built environment and subjective well-being is significantly different due to heterogeneity of individual socioeconomic characteristics (that is, hukou status, housing tenure, and employment status). Our findings reaffirm the significant role of the real neighborhood environment in supporting subjective well-being, provide some insights for urban planners and policymakers on how to interweave well-being promotion into urban environments. It is suggested that the needs of people with different socioeconomic characteristics should be taken into account to develop targeted 15-minute community life circle planning. Additionally, strengthening green infrastructure construction also matters.
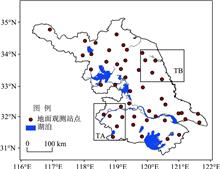
Surface temperature plays a key role in physical and biological processes on Earth, and it is an important index for evaluating surface thermal environment. Understanding the temporal and spatial variations of surface temperature is of great significance for urban heat island monitoring and ecological quality evaluation. Current land surface temperature products derived from satellite remote sensing suffer from partial coverage or cloud-cover blockage problems, which have potential limitations on the study of climate and ecological environment. The recently developed NOAA satellites High-Resolution Infrared Radiation Sounder (HIRS) land surface temperature (LST) product is among the longest LST records. To examine the spatiotemporal distribution of LST in Jiangsu Province and data performance of HIRS LST at different temporal scales, we evaluated the HIRS LST and in situ measurement correlation coefficient (R), bias, and unbiased root mean square difference (ubRMSD) using the daily, annual, and seasonal mean values, together with the long-term linear trend during 30 years in the province. Great consistency between the two products is observed. Their correlation coefficients are higher than 0.98 for all stations, and those for daily anomalies range from 0.65 to 0.80 across the region. The bias and the ubRMSD indicate that the HIRS data have generally underestimated the LST across the northern and some southern areas, mainly because of its large underestimation of the occurrences of temperature higher than 32 ℃. Nevertheless, the HIRS LST has largely overestimated the occurrences of summer days with temperature ranging from 20-30 ℃. As for the intraannual variations, the HIRS LST shows highest correlation with in situ measurements in the spring, but the correlation is lowest in the winter. Trend test shows that both sets of data show significant increasing trends with similar patterns in the spring, autumn, and winter. However, the long-term trends are significantly overestimated across the region in the summer, and underestimated in other seasons in the HIRS LST data.
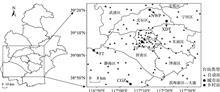
The urban heat island (UHI) effect has had an important impact on building energy demand in big cities. It is of great significance, therefore, to evaluate the impact of the UHI on building energy demand in a metropolis in order to save energy for existing buildings and to better design for future buildings. Based on the hourly data from automatic weather stations and four representative rural weather stations selected by satellite remote-sensing method, the impacts of urban heat island intensity (IUHI) on building heating and cooling loads of different time scales (annual, daily, and hourly) in Tianjing City were evaluated by simulating hour-by-hour loads of the typical residential buildings. The results show that: 1) The heating loads decreased and the cooling loads increased with the increase of the IUHI in the past nine years. The decreased magnitude of the yearly heating load was larger than the increased magnitude of the yearly cooling load. When the IUHI increased by 1 ℃, the annual mean heating loads decreased by 4.01 kWh/m2 and the annual mean cooling loads increased by 1.05 kWh/m2 in the urban areas compared to the rural areas. 2) The heating loads were the highest in the period from late December to late January of the following year, and the daily mean loads in the urban areas were about 10% lower than that in the rural areas. The cooling loads were the highest from late July to early August, and the daily mean loads in urban areas were about 6% higher than that in the rural areas. 3) Both heating and cooling loads were higher during the nighttime than daytime. The period from 18:00 to 07:00 Beijing Time was the high load stage in the urban and rural areas, regardless of heating period or cooling period. From 11:00 to 15:00 Beijing Time, however, the loads were low in the heating period but high in the cooling period, which may have been caused by changing temperature and the different heating or cooling demand of the urban residents. Therefore, the impact of UHI on hourly and daily building loads should be fully considered to promote the effective management of urban heating and cooling operation for reducing building energy consumption in big cities of northern China like Tianjin.
Females are important force in promoting social development. As the most direct way for women to participate in social and economic developments, employment has always been an important topic in scientific research. Taking the old industrial bases in Northeast China as an example, this study explored the spatial and temporal characteristics and driving mechanism of urban female employment level by means of spatial analysis. The results show that: 1) The level of urban female employment in the old industrial bases in Northeast China from 2000 to 2015 was generally low, mainly at medium and low levels; the medium level was mainly found in the central and southern regions, and the lower level was mainly distributed in the north. 2) From the analysis of influencing factors, it can be seen that higher education, convenient transportation, developed industries, the proportion of women with spouses, the proportion of the elderly aged 65 and above, and the proportion of households with three or more generations had a positive effect on the level of urban female employment, while demographic pressure had a negative effect on female employment level. Obviously, a complete family plays an extremely important role in female employment. 3) The government should integrate all sectors of society, encourage social capital to participate in the development of the elderly and childcare, and provide more and better quality services to families with strong needs for elderly care and childcare. In addition, promote the "family" culture of "respecting the old, loving the young, and being friendly with neighbors", encourage family members to participate in housework together, build an equal relationship between men and women in housework, create a harmonious family environment and social atmosphere, and relieve women conflict between work and housework.
This study conducted field investigations in the Guanting Basin of the north shore of the Yellow River. A Holocene complete soil profile was identified over the Erfangcun Ruins, which is situated to the east side of the Lajia Ruins and has preserved multiple records of the information of aeolian loess and palaeosol and evolution of land resources, catastrophic surface processes, and human activities during the period of the Xindian culture. Sediment samples were taken from the profile systematically on the basis of field pedo-sedimentological observation. We established the basic pedo-stratigraphic sequence by using optically-stimulated luminescence (OSL) dating and physicochemical indices. The stratigraphic sequence of the Erfangcun profile from the top to the bottom is listed as modern soil (MS)-late Holocene aeolian loess (L0)-Middle Holocene palaeosol (S0)-early Holocene transitional aeolian (Lt). The most significant feature of this sequence is that the deposit of flashfloods and mudflows with a thickness of 1.2-1.5 m have split the Chernozem soil into two sublayers, which was the result of the catastrophic land surface processes and the climatic and environment changes. Optically-stimulated luminescence dating results suggest that enormous flashfloods and mudflows burst out during OSL age 3940-3780 a, equivalent to14C age 3850-3600a BP. They ran over the valley and deposited in the front of the paleo-alluvial-pluvial fans of the second terrace of the Yellow River. The deposit of the flows was covered by the ashes of the Xindian culture (3600-3400 a BP). The barren land formed by the flashfloods and mudflows caused the decline of agriculture and gave birth to stockbreeding. This soil layer is in sharp contrast to the fertile and loose soil during the period of the Qijia culture (4150-3850 a BP). Overall, the results of the study revealed that prehistoric human agricultural land use pattern in the area of the Lajia and Erfangcun Ruins in the Guanting Basin was changed by the degradation of soil caused by the catastrophic floods and climate change. It may have implications for further insights into prehistoric land use and the changes of environment in the transitional area of the Tibet Plateau and the Loess Plateau.
The risk of famine and food insecurity in the process of socioeconomic development is an important issue. This study examined the trend of famines in the Jiangsu and Shanghai region in the Qing Dynasty during 1644-1911. Based on the 1487 famine records extracted from local chronicles and other historical materials, this study first reconstructed two annual sequences of famines (frequency of counties affected by famine and its weighted index) by using the semantic differential method and weighted index. Then, the study quantitatively explored the spatial-temporal variations of the famines and their causes from different factors and their combinations during the Qing Dynasty, using multiple statistical tools such as wavelet analysis and kernel density estimation. The results show that: 1) Famines were very frequent in the Jiangsu and Shanghai area throughout the Qing Dynasty, with an average of one famine per 1.2 years and six counties affected annually by famines, but the vast majority of famine years were dominated by mild famines (grade 1) and moderate famines (grade 2). The frequency and intensity of the famines in the study area displayed clear patterns of phasic, periodic, seasonal, and intermittent explosive changes. The most serious periods were the mid-late part of the prosperous Kangxi-Qianlong times, and the periods during the reigns of Daoguang and Xianfeng when the Qing Dynasty turned from prosperity to decline. In addition to the increasing frequency of extreme droughts and floods in these two periods, it might also be related to the significant increase in the exposure and vulnerability of the social system to disasters and famines at those times. 2) The spatial distribution of famines is characterized by a pattern of "two-zones and multi-nucleus" from southeast to northwest. The areas along the banks of the Yangtze River, around the Taihu Lake and the Gaoyou Lake, the old Yellow River course and the Hongze Lake were famine-prone areas. Besides the social factors like population and economic development, the geographic environment, especially the distribution of water bodies, had an important impact on the distribution of famine-prone areas. 3) The main environmental factors that caused famine were flooding, followed by droughts and storm surges, and other disasters accounted for only a small part. The combination of different disaster-causing factors would have different effects on famine. The proportion of famines caused by a single environmental factor accounted for the vast majority. With regard to the severity of famine, the mean famine index values corresponding to those caused by a combination of two and three environmental factors were both larger than that of a single factor. The distribution of famines related to floods and droughts determined the overall distribution pattern of famines in the Jiangsu-Shanghai region during 1644-1911. The above understanding can provide some valuable reference for identifying high-risk areas of famine in Jiangsu and Shanghai and exploring the impact of regional natural hazards on famine and protection mechanisms of food security in the future.
As a tool of natural capital accounting, ecological footprint models have been used to quantitatively estimate a region's sustainability. Three-dimensional ecological footprint is a new approach in the field of natural capital accounting around the world. Given the modern background of the Belt and Road initiative, the construction of ecological civilization, and the development of the western regions of China, it is significant for the Guanzhong region—an important area on the Silk Road—to choose a sustainable development path in the future. Based on the revised three-dimensional ecological footprint model, this study used three scales including product, land use type, and region to quantitatively calculate the land use ecological footprint size and footprint depth of the Guanzhong region and its respective municipalities from 1995 to 2015. Moreover, Gini coefficient of footprint size and other indicators were added to more clearly analyze the occupancy of natural capital flows and the consumption of natural capital stocks in the study area. Lastly, it evaluated the sustainability of natural capital use of the Guanzhong region and its municipalities. The main conclusions of the study are as follows: 1) From 1995 to 2015, the land use ecological footprint of the Guanzhong region showed a trend of increasing first and then decreasing. The land carrying capacity decreased year by year and the ecological deficit increased year by year, which is not conducive to the sustainable development of the region. 2) The five large cities in the Guanzhong region were in the situation of ecological deficit, and their footprint depth were all more than 1. Consuming stock capital to make up for the shortage of flow capital has become a normal social development pattern in the region. 3) Cropland and construction land were the main land use types occupied by natural capital flows, while grassland, cropland, and construction land were the main land use types of natural capital stocks. 4) Inequality of natural capital flow occupation in the region was gradually increasing. If no reasonable measures are taken, it will reach a relatively unbalanced state in 2025 and a highly unbalanced state in 2030. This study focused on the "actual footprint", comprehensively revealed the land use benefits in the Guanzhong region, and provided a scientific reference for the sustainable development of the region.
Digital urban management systems have accumulated a large amount of historical data of urban management cases, but there is a general lack of research on the overall spatial pattern and cause of urban management cases. Therefore, it is necessary to fully explore the spatial distribution pattern and cause mechanism behind the incidents of urban management, which could provide decision support for the urban management departments to prevent and control the cases. Taking street order, urban environment, and publicity advertising urban management cases as an example and considering the points of interest (POI) data, this study used the Log Gaussian Cox Processes (LGCP) model to analyze the differences of spatial distribution and influencing factors between street order cases, urban environment cases, and publicity advertising cases in P district of H city, Northwest China. The study found that: 1) All the three types of urban management cases present obvious spatially aggregated distribution, and no spatial correlation is believed to exist beyond 924 meters. 2) The spatial features of the agglomeration space are different. The street order cases are close to the main trunk roads in the urban area, resembling a road network. The urban environment cases tend to cluster as blocks around the center of the district, while more scattered and dispersed in the peripheral areas of the district. The publicity advertising cases are in elongated distribution near the main traffic lines, but clustered as blocks in the commercial areas of the city. 3) Different types of POI in the study area have different impacts. Shopping services, health care, and residential areas show the most significant attractiveness, indicating that the flow and density of people in specific areas are the most important factors that affect the distribution of urban management cases, and increased flow and concentration of the crowd will sharply increase the number of urban management incidents. The results of this study include spatial hotspot identification and cause analysis, which can meet the urban management departments' needs.
Since the implementation of the reform and opening up policy, driven by the export-oriented developmental pattern, China has deeply joined the globalization process and quickly realized industrial upgrading. However, since the beginning of the twenty-first century, China's manufacturing industry has faced many crises and challenges such as rising costs and institutional changes. In response to these challenges, China's manufacturing industry has begun a new round of industrial upgrading, which fundamentally reshapes the industrial space and organizational structure of the manufacturing industry, changing the function, role, and influence of China's manufacturing in regional and global export markets. Focusing on industrial upgrading, this article first reviewed the research on industrial upgrading pattern, and divided it into industrial value chain upgrading and spatial upgrading. Then, it examined the industrial upgrading mechanism from multiple scales: global, national, regional, local, and enterprise, and drew the following main conclusions: 1) Value chain upgrading and spatial upgrading are two sides of industrial upgrading. Value chain upgrading focuses on organizational restructuring, and spatial upgrading emphasizes geographical restructuring. Spatial upgrading has four types: localization, delocalization, relocalization, and regionalization, which are coupling and interacting with value chain upgrading. An analysis framework combining both can comprehensively reflect the status of industrial upgrading in China. 2) Considering the complex and diverse upgrading phenomena in China, the existing literature on industrial upgrading pattern is relatively simple, and it is necessary to pay more attention to the cross-upgrading path and the non-linear, complex, and diverse nature of China's industrial upgrading in the future. 3) China's industrial upgrading process is driven by the forces from multiple scales of global, national, regional, local, and enterprise. We propose a multi-scale integration perspective that abandons single-perspective, top-down, and hierarchical ways of thinking. Using the multi-scale analysis framework to investigate the upgrading mechanisms can help us to better understand the development and the catching up path of China's industry.
Spatial configuration has a significant impact on the efficient and balanced development of cities and regions. Following the rapid expansion of urban areas and the development of transportation and communication technologies, polycentricity has become the dominant trend of spatial restructuring in many cities and regions. Meanwhile, it has been adopted widely as an important tool of spatial configuration in urban and regional planning. However, the concept of "polycentricity", despite its wide usage in the literature, remains to be confusing and needs to be clarified. Moreover, there is no consensus on the prevalence and advantages of the polycentric form of city and regional spatial structure compared with those of the monocentric counterpart. This article reviewed the research related to polycentricity in Chinese and international literature to get a systematic comprehension of this concept. First, it analyzed the connotation of intra-city and inter-city polycentricity, morphological and functional polycentricity based on the definition of research scale and importance of centers. Second, this article reviewed the evolution mechanism of polycentric city and urban region from the perspectives of the generation of new centers and the integration of existing centers. Third, it summarized the various tools of identifying and measuring polycentricity, the development trend and performance of city and regional spatial structure. Finally, the future research prospects are proposed: 1) Defining polycentricity clearly and measuring it appropriately with some new data and tools to make the results more accurate and comparable. 2) Comparing the variation of city and regional spatial structures and analyzing the causes from the perspectives of agent's decisions and the comprehensive effect of the spatial distribution of various economic factors. 3) Evaluating the performance of polycentricity comprehensively, which means taking the environment and socioeconomic background of cities and regions into consideration when exploring the advantages and disadvantages of polycentricity in multiple perspectives.
The studies on the space of flow play an important role in understanding the structure and change of urban networks. The rapid development of big data provides new opportunities and challenges for the studies on the space of flow in recent years. This article systematically reviewed the research progress on the space of flow based on big data. First, we retrospect the background and history of the studies on the space of flow, then summarized the themes, the types of big data, the methods used for the studies and the major findings, as well as discussed the research challenges. We found an exponential growth of studies on the space of flow using big data after 2011. The annual number of published papers increased from 11 to 106 during 2011-2018. Big data deepen the research on the space of flow by providing new data sources, inspiring new analytical methods, and new research perspectives. Four types of big data—mobile phone, social media, smart card, and taxi trajectory data are commonly used in the studies on the space of flow, which can provide information on spatiotemporal flows (such as population flow, material flow, and information flow) directly. Research methods have also evolved from distance-based gravity models to network analysis. In the future, the research on the space of flow using big data can be further improved by validating the effectiveness and representativeness of the big data, the integration of big data and traditional data, and the information mining from big data using new methods such as deep learning and cloud computing.