


Measuring magnetic fields in plasmas is vital for a proper understanding of plasma dynamics, but such measurements are often difficult to implement. Among the diagnostics commonly used in laser–plasma experiments[
High Power Laser Science and Engineering, Volume. 6, Issue 3, 03000e49(2018)
Implementation of a Faraday rotation diagnostic at the OMEGA laser facility

Magnetic field measurements in turbulent plasmas are often difficult to perform. Here we show that for  kG magnetic fields, a time-resolved Faraday rotation measurement can be made at the OMEGA laser facility. This diagnostic has been implemented using the Thomson scattering probe beam and the resultant path-integrated magnetic field has been compared with that of proton radiography. Accurate measurement of magnetic fields is essential for satisfying the scientific goals of many current laser–plasma experiments.
Keywords
1 Introduction
Here we describe an implementation of a Faraday rotation measurement that has a much higher sensitivity and can be used together with proton radiography for accurate field measurements. The diagnostic makes use of the Thomson scattering probe beam and so causes little disruption to the currently available diagnostics on OMEGA. The requirement is that  , where
  is the magnetic field,
  the electron density, and
  the path length of the probe beam through the sample.
2 Setup
The Faraday rotation measurement was implemented on a low-density turbulent plasma. The experimental setup is shown in Figure  chlorine-doped plastic foils were each irradiated with 351 nm, 5 kJ drive lasers in either a
  or 10 ns pulse. This generated two counter-propagating plasma flows, each of which then passed through a plastic grid, and collided with one another
  after the start of the laser drive. The velocity of these flows prior to their collisions is
  . The turbulence that resulted from this collision is expected to produce dynamically significant magnetic fields through the turbulent dynamo mechanism[
Sign up for High Power Laser Science and Engineering TOC Get the latest issue of High Power Laser Science and Engineering delivered right to you!Sign up now
The Faraday rotation measurement is built alongside the Thomson scattering diagnostics[ region. To implement a Faraday rotation measurement, a Wollaston prism was inserted into the Thomson scattering collection optics, as shown in Figure
Proton radiography is implemented at the OMEGA laser facility using a D He capsule and CR-39 nuclear track detectors. Protons are generated by fusion reactions occurring by laser-driven implosion of a spherical capsule containing D
 He gas[
 and 15 MeV (accounting for Doppler shift). The protons are emitted isotropically, and thus illuminate the interaction region of the two plasma jets (see Ref. [
3 Analysis
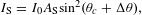
Both the IAW and EPW diagnostics can be analyzed in a similar manner. The difference in intensity of the two polarizations depends on three different factors. First of all, in the absence of any magnetic fields, the intensity of the S and P polarizations is determined by the relative angle between the polarization of the light and the axis of the Wollaston prism. We denote this angle by  . In addition, the difference in intensity between the two polarizations also depends on the unequal response of the optics, detector, etc. Finally, when a magnetized plasma is present in the path, the induced rotation of the polarization angle changes the angle at which the light enters the prism and thus the ratio of the two polarizations when there is no magnetic field. The intensity of the two polarizations can be written as follows:
 (1)
(1) (2)
(2) and
and  are the intensities of the S and P polarizations,
  is the initial Thomson scattering laser intensity,
  and
and  are the distinct transmission factors for each polarization and
  is the rotation due to the magnetic fields. Taking the ratio of Equations (
 (3)
(3)Using Equation ( ) can be determined, provided that the calibration angle
  , the ratio of
  to
to  and the ratio of
  to
to  are known. To determine the ratio of
  to
to  , a measurement with no (or weak) magnetic field was used. A half wave plate in front of the Wollaston prism is set such that incoming polarization at the prism is
  . The axis of the Wollaston is set so that the two images from each polarization are separated along the streak camera input slit. The intensity of each polarization,
  and
and  , is found by integrating over the total signal for each polarization.
As always, there is some stray light entering the detector. This must not be included in the Faraday rotation analysis, since it has not been scattered and so has not been influenced by the magnetic fields within the plasma. The IAW data is spectrally resolved, and since the stray light occurs at the same wavelength as the probe beam, it can be separated from the Thomson scattered signal, which instead is shifted in wavelength as the probe photons interact with the plasma. In practice, however, isolating the stray light from the scattered signal is not always possible, if for example, the frequency shifts are such that there is still a large overlap between the two. Conversely, as the EPW measurement is not spectrally resolved, there is no obvious way to disentangle the stray light from the scattering measurement. In this case, the approach is to minimize as much as possible the stray light. It is thus important to minimize stray light for both the Thomson scattering and Faraday rotation diagnostic. For Thomson scattering with IAW, the requirement is that stray light remains spectrally separated and distinguishable from the IAW peaks. Given the limited dynamic range of a streak camera, this means the stray light signal must always be of the same order (ideally smaller) than the IAW signal. These requirements become even more stringent for Faraday rotation using EPW since, as mentioned above, the signal is not spectrally resolved and so stray light directly overlaps with the scattering signal (and it is an additional source of uncertainty in the data). For EPW, we have estimated the stray light contribution by measuring the signal before and after the Thomson scattering probe laser is fired.
While the IAW and EPW data should give the same rotation angle, there are other effects that could make the two measurements differ from one another. We have already mentioned stray light. Additionally, the IAW data (being spectrally resolved) tends to be a lot noisier than the EPW data, and so the error in the measurement is larger.
4 Calibration and data shots
The calibration shot used here was a single plasma flow (where only one foil is irradiated and so there is no collision). The only magnetic fields present for this case are those from the seed fields generated from misaligned temperature and density gradients. These seed fields are small,  [
[ ns of the shot, the signal is reliable and has an excellent signal-to-noise ratio but the contribution from stray light cannot be easily assessed, as shown in Figure
Figure  obtained from Equation (
 ). By requiring that
  , this allows us to find the ratio
  for both the IAW and EPW channels. This gives
  and
and  , where the values have been averaged over 1 ns. The difference between the calibration from IAW and EPW is likely due to the amount of stray light and intrinsic noise associated with the two channels.
In this section we will apply the Faraday rotation angle measurements to a few different shots in order to measure the magnetic field during and after the collision of the two plasma flows. Data from shot 1, taken 29.5 ns after the drive lasers were fired with a 10 ns pulse, is shown in Figure  ) obtained from the IAW and EPW signals. There is a significant difference between the two curves. As mentioned, this is likely due to saturation of the IAW signal on the streak camera.
Shot 2, taken  ns after the drive lasers have been fired with a 5 ns pulse, also uses a 1 ns long probe beam and it is shown in Figure
  .
.
The Faraday rotation angle is given (in SI units) by[
 (4)
(4) is the path length,
  is the electron density and
  is the component of the magnetic field along the path. The incident laser’s wavelength is
  , and so implies
 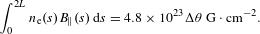 (5)
(5) of rotation and so the requirement for the diagnostic to capture a change in magnetic field is
  .
.In this experiment, the magnetic field is expected to be turbulent. This implies that, on average, the Faraday rotation measurement would give a null result since the mean magnetic field along the path is zero. However, while the Faraday rotation is zero on average, every single measurement must be understood in terms of a random walk through a random magnetic field, and thus the Faraday rotation value corresponds to the standard deviation of the line integral. This can be estimated by assuming a field with a correlation length,  , equal to the grid size,
  , and so the typical deviation is that acquired across one structure multiplied by the square root of the number,
  , of such structures encountered,
  . We thus obtain
 (6)
(6)To determine the electron density, we have employed a full photometric calibration of the IAW channel, as shown in Figure  fiducial laser was used. The amount of light coupled through the Thomson scattering telescope was measured using an energy meter and then cross referenced to a pick-off monitor at the start of the laser path. Laser pulses were then recorded on the Thomson scattering system and the energy measured through the cross calibrated energy meter. The transmission of the Thomson scattering probe beam through the Faraday rotation package was characterized separately as
  and then included in the final calibration. The counts registered on the IAW spectrometer could then be converted to a value for the total scattered power as
  ADU/pJ.
The total scattered power can be used to determine the electron density via
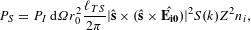 (7)
(7) is the scattered power,
  the incident power of the probe beam,
  the collecting solid angle,
 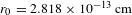 the classical electron radius,
  the interaction length,
  the unit Poynting vector,
  the probe beam’s electric field unit vector,
  the spectral density function,
  the mean ion charge and
  the ion density. The incident power is provided by the on-shot calorimetry performed at the OMEGA laser facility. The effective f-number of the collection optics was
  , giving a solid angle of
  . The spectral density function is[
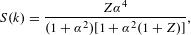 (8)
(8) is
is  , where
  is the Debye length. An average ionization of
  is expected for CH plasmas (that is, both species are fully ionized). From this photometric calibration the electron density is found to be
 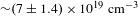 . On a similar experimental setup where no Faraday rotation diagnostic was present and so the electron features could be spectrally resolved, the electron density could be determined by fitting the Thomson scattering spectrum to the position of the EPWs, as shown in Figure
 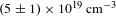 , similar to the value found from the photometric calibration.
Having determined the electron density and rotation angle, the path-integrated magnetic field from the Faraday rotation measurement can be calculated using Equation ( cm, is equal to the scale length of the electron density, as inferred from the measured self-emission X-ray images[
 kG, path length
  cm and electron density
  then gives a rotation angle
  .
.
5 Comparison with proton radiography
The accuracy of the Faraday rotation diagnostic can be characterized through comparison with proton radiography, a diagnostic already commissioned at the OMEGA laser facility[ ns, which is much shorter than the hydrodynamic eddy turnover times at the largest scale, and so they both probe the same magnetic field structures. The path-integrated magnetic field reconstruction[
 area sampled by the Faraday rotation diagnostic, as shown in Figures
  square region. This region is the extent that the two
  plasma jets could travel within the
  ns difference in diagnostic timing. Additionally, because of the geometry of the experimental setup, the Thomson scattering beam experiences about twice the path length that the protons encounter. Accordingly, to fairly compare the two diagnostics, the path-integrated magnetic field measured by the Faraday rotation diagnostic is reduced by a factor of
  from Equation (
Both the mean path-integrated magnetic field within the Thomson scattering region and the maximum path-integrated magnetic field as calculated from proton radiography are plotted in Figure  ns of signal.
The error bars in the proton radiography inferred mean path-integrated field are found by sampling different 0.4 mm square regions throughout the reconstructed radiograph. There is an additional error of around  inherent in the reconstruction algorithm which we include; this uncertainty is the result of approximations employed in the derivation of the algorithm[
 . While the small difference in timing between the two diagnostics allows for changes within the path-integrated magnetic field to occur, there is a close similarity between the mean path-integrated field inferred from the two diagnostics. Additionally, the mean path-integrated field calculated from Faraday rotation is consistently smaller than the maximum path-integrated field found from the proton radiography reconstructions, as expected. The similarity in the mean magnetic field as calculated from the two diagnostics gives confidence in the results of both diagnostics, suggesting that Faraday rotation can indeed be used for on-shot analysis throughout a shot day at the OMEGA laser facility.
6 Conclusion
We have fielded a new Faraday rotation diagnostic at the OMEGA laser facility. The analysis of the results has been described and a comparison made with the results from proton radiography. The Faraday rotation results are similar to those from proton radiography. One substantial advantage of this diagnostics is the fact that it does not rely on films or passive detectors (as CR-39). As such, analysis can be performed immediately after the shot, allowing for temporally resolved magnetic field measurements to be performed in real time during the experiment.
[1] C. K. Li, F. H. Séguin, J. A. Frenje, J. R. Rygg, R. D. Petrasso, R. P. J. Town, P. A. Amendt, S. P. Hatchett, O. L. Landen, A. J. Mackinnon, P. K. Patel, V. A. Smalyuk, T. C. Sangster, J. P. Knauer. Phys. Rev. Lett., 97(2006).
[10] D. H. Froula, J. S. Ross, L. Divol, S. H. Glenzer. Rev. Sci. Instrum., 77(2006).
[11] C. K. Li, F. H. Séguin, J. R. Rygg, J. A. Frenje, M. Manuel, R. D. Petrasso, R. Betti, J. Delettrez, J. P. Knauer, F. Marshall, D. D. Meyerhofer, D. Shvarts, V. A. Smalyuk, C. Stoeckl, O. L. Landen, R. P. J. Town, C. A. Back, J. D. Kilkenny. Phys. Rev. Lett., 100(2008).
[12] C. K. Li, F. H. Séguin, J. A. Frenje, J. R. Rygg, R. D. Petrasso, R. P. J. Town, P. A. Amendt, S. P. Hatchett, O. L. Landen, A. J. Mackinnon, P. K. Patel, V. A. Smalyuk, J. P. Knauer, T. C. Sangster, C. Stoeckl. Rev. Sci. Instrum., 77(2006).
Tools
Get Citation
Copy Citation Text
A. Rigby, J. Katz, A. F. A. Bott, T. G. White, P. Tzeferacos, D. Q. Lamb, D. H. Froula, G. Gregori. Implementation of a Faraday rotation diagnostic at the OMEGA laser facility[J]. High Power Laser Science and Engineering, 2018, 6(3): 03000e49
Paper Information
Special Issue: LABORATORY ASTROPHYSICS
Received: Jan. 30, 2018
Accepted: Jul. 2, 2018
Published Online: Aug. 22, 2018
The Author Email: A. Rigby (alexandra.rigby@physics.ox.ac.uk)

© Copyright 2018-2021 | Chinese Laser Press.
All Rights Reserved 沪ICP备15018463号-20