


Laser–plasma accelerators (LPAs)[1,2] can produce electric acceleration fields of the order of tens to hundreds of GV/m[3,4], making them attractive as compact particle accelerators. This mechanism makes it is possible to reduce the distance required to generate GeV-level electron beams from kilometers to centimeters[5–8]. Thus, it promises to increase the availability of the important resource, highly relativistic, high-brightness electron beams as an essential tool for fundamental and application research, at significantly reduced size and cost. Over the past decade, milestone experiments have verified the key principles of LPAs and the possibility to generate high-brightness beams, featuring electron bunches of low emittance[9,10], multi-femtosecond length and kiloampere peak current[11–13]. These results show that LPAs are, in principle, capable of generating electron beams with competitive beam quality. In particular, significant progress has been made on LPAs yielding quasi-monoenergetic electron beams[14–16] with the highest energy record in three steps from 1 to 7.8 GeV by an ultra-intense laser pulse guided in multi-cm-long gas-filled capillary discharge waveguides[6–8]. In the preformed plasma density channels, the propagation distance of a laser pulse can reach tens of times larger than the Rayleigh length. Experimental studies and solutions of an efficient approach to coupling laser pulses with high mode quality to a preformed plasma channel waveguide have made important contributions to advancing the field of LPAs.
High Power Laser Science and Engineering, Volume. 11, Issue 6, 06000e85(2023)
Measurements of plasma density profile evolutions with a channel-guided laser
The discharged capillary plasma channel has been extensively studied as a high-gradient particle acceleration and transmission medium. A novel measurement method of plasma channel density profiles has been employed, where the role of plasma channels guiding the advantages of lasers has shown strong appeal. Here, we have studied the high-order transverse plasma density profile distribution using a channel-guided laser, and made detailed measurements of its evolution under various parameters. The paraxial wave equation in a plasma channel with high-order density profile components is analyzed, and the approximate propagation process based on the Gaussian profile laser is obtained on this basis, which agrees well with the simulation under phase conditions. In the experiments, by measuring the integrated transverse laser intensities at the outlet of the channels, the radial quartic density profiles of the plasma channels have been obtained. By precisely synchronizing the detection laser pulses and the plasma channels at various moments, the reconstructed density profile shows an evolution from the radial quartic profile to the quasi-parabolic profile, and the high-order component is indicated as an exponential decline tendency over time. Factors affecting the evolution rate were investigated by varying the incentive source and capillary parameters. It can be found that the discharge voltages and currents are positive factors quickening the evolution, while the electron-ion heating, capillary radii and pressures are negative ones. One plausible explanation is that quartic profile contributions may be linked to plasma heating. This work helps one to understand the mechanisms of the formation, the evolutions of the guiding channel electron-density profiles and their dependences on the external controllable parameters. It provides support and reflection for physical research on discharged capillary plasma and optimizing plasma channels in various applications.
Keywords
1 Introduction
For the application, it is highly desirable that the laser pulse should propagate extended distances (many Rayleigh lengths) at high intensity. In the absence of an optical guiding mechanism, the propagation distance is limited to approximately a Rayleigh (diffraction) length
Furthermore, advanced concepts with capillary discharges have demonstrated novel injection techniques[27–31], the generation of plasma-driven X-ray pulses[32,33], synchrotron radiations[34] and high harmonics[35], cascade acceleration schemes[36–38], energy dechirpers[39–41] and the transport of LPA electron[35,42–50] and proton beams[51,52] as novel active plasma lenses (APLs). In particular, APLs have a focus gradient of up to several kT/m. Combined with the laser–plasma acceleration, it is hoped to realize the miniaturization of particle accelerators. However, the quality of beam transports would be degraded in APLs with non-uniform current densities, which are closely related to the plasma electron-density profiles. In addition, for all the applications above, gas-filled capillaries offer the ability to continuously tune the plasma pressure and long device lifetimes. Furthermore, in the case of gas-filled capillaries, the plasma channel may be fully ionized, which minimizes spectral or temporal distortion, which is helpful for sensitivity of measurement. For both channel-guided lasers and beams, the measurements of plasma channel density profiles are important evidence.
Sign up for High Power Laser Science and Engineering TOC Get the latest issue of High Power Laser Science and Engineering delivered right to you!Sign up now
In general, refractive guiding of optical pulses can occur when the transverse (radial) profile of the index of refraction
In the gas-filled capillary discharge, the plasma channel is formed by the temperature profile during discharge, which is higher in the center as a result of the ohmic heating effect of plasma and drops radially because the heating is balanced by heat conduction to the capillary wall[67,68]. Measurements of the transverse electron-density profile in a hydrogen-filled device have shown that a quasi-parabolic plasma channel is indeed formed[69]. In the outer edge of a plasma channel, the density profile described by a parabola alone is not sufficient, because the quasi-thermal equilibrium conditions may be violated due to large temperature gradients and violent particle collisions. It is worth paying attention to the impact of experimental non-ideal parabolic density distributions on applications, since the density dominates the plasma response time, self-injection threshold, accelerating field strength, electron beam dephasing length[3], beam-driven wakefield effects[44], spatial distribution of the discharge current density, phase space development of charged particles during transport[43,44] and radiation generating phase matching conditions[70].
Different application scenarios need to adapt to the density distribution under different time windows. For instance, the time window of the plasma channel as the best matching guide waveguide is only less than tens of nanoseconds. Knowledge of the plasma density profile evolution is of critical importance to optimizing the performance of the channel. Current techniques for measuring the density channel profiles in a gas-filled capillary discharge waveguide are inadequate. Longitudinal interferometry experiments with a Mach–Zehnder interferometer require the capillary length to be less than a few millimeters, resulting in measurement error associated with end effects[69,71,72]. Transverse interferometry measurements require capillaries that are square, necessitating strong assumptions about the symmetry of the profile[73–78] and flat optical side windows to provide the optical path. The well-known spectroscopic method using the Stark broadening effect loses the ability to spatially resolve[79–81]. An alternative way to detect the plasma density, based on the shock waves produced by gas discharge in a capillary[82], yields only integrated axial distribution information and must be calibrated by other methods. Spot size measurements at the output of the capillary have also been used to deduce channel depth[83,84], but this technique requires several plasma channels with different lengths while keeping other parameters consistent. Another method employs the observation of Raman shifts in the guided laser spectrum, but this requires high laser power[85,86]. The group velocity delay[87] of a laser pulse and the common-path two-color interferometer[88,89] can only be correlated with the on-axis plasma density. Extensive research has been carried out to gather more details on the shape of the channel and accurate diagnostics of the paraxial plasma channel depth by the method of measuring laser centroid oscillations[90], and the quartic density distribution of plasma channels is first introduced into measurement research[90,91]. On the other hand, in order to assist the development of this channel, important simulations[67,68,92] of the plasma dynamics of a hydrogen-filled capillary discharge have been studied to understand the mechanisms by which the guiding electron-density profile is formed and how its properties depend on the external, controllable parameters.
In this paper, we report the measurement of the temporal evolution of the electron-density profile, in particular, including marginal higher-order distributions in a gas-filled discharge capillary by distinguishing channel-guided laser mode quality. Adopting a collimated laser eliminates the influence of the divergence angle of the probe laser to ensure accuracy. The intensity was kept low (
2 Heuristic theory of channel-guided propagation
In this paper, the mathematical model for describing laser pulse evolution is based on the wave equation:
where
where
where
The propagation of an ultrashort laser pulse in a preformed plasma channel will be considered. Propagation is considered in the limits of low power
where
![]()
Figure 1.Calculated plasma electron-density profiles  as a function of radial position
  with axis density
 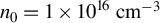 and matched spot size
 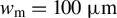 for a parabolic channel (black line) compared with a channel with an
  component with
  at the same
  (blue line) and a channel at the same
  (red line), respectively.
To analyze the behavior of the pulse radius, consider the local normalized-intensity-weighted mean-squared radius
We say that a laser propagating in a plasma channel satisfies a quasi-matched propagation condition if its second-order
Equation (6) gives the general matched spot size for applicable densities, besides the parabolic density profiles. High-order contributions should be introduced for a complete depiction of density profiles. One model provides an excellent description, as shown in Figure 1, with quartic terms of the outer edge density profile for
For
Approximate forms for the envelope equations describing laser pulse evolution, that is, a solution to the paraxial wave equation (Equation (4)) can be found by the method of the heuristic theory, considering a Gaussian model laser beam with the following form:
where
where the matched beam spot size
Note that the high-order density profile component contributes to a mismatched spot as mathematical equivalence:
where
We can get the radial intensity profile evolution as follows:
where
to denote the rate of contributions of the
The above proof illustrates the impact of the
3 Simulation of laser propagation in plasma channels
Actually, it is important to specify the laser mode injected into the plasma channel. In our experiments, the collimated laser used with a particularly large
![]()
Figure 2.(a) The cylindrical 2D-vector integral transform calculation result of an input plane wave electric field  with wavelength
  diffraction propagation by an ideal scattering boundary in a
  domain, where the data on the negative side of the radial axis are obtained by mirroring. (b) The normalized transverse
  profile at
 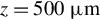 from calculation data (black line) and fitting the profile with the theoretical function
  (blue line) and the approximate Gaussian function (red line) for the channel-guided laser requirement.
The wavefront can be represented approximately as a Gaussian mode:
as shown in Figure 2(b), where
In order to check the applicability of the aforementioned heuristic theory introduced, we have performed cylindrical particle-in-cell (PIC) simulations by the Smilei[64] code. The simulated transport domain is 500 μm
![]()
Figure 3.(a) The cylindrical PIC simulation result of a laser with wavelength  propagating in plasma with ideal matched spot size
 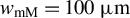 and
and  , where the data on the negative side of the radial axis are obtained by mirroring. The simulation domain corresponds to plasma channel radius
  and length
  cm. (b) The coupling parameter
  varying along the
  position in the solid blue line and the calculation values of
One of the simulation results is given in Figure 3(a). It is obvious that the laser evolves complex models due to introducing a quartic density profile contribution. We fitted the laser intensity profiles along
4 Experimental setup and methods
Figure 4(a) provides a schematic overview of the experimental setup. We used a laser probe pulse to characterize the plasma channel properties. Laser pulses with a wavelength of 798 nm and spot radius of 4 mm were produced by the front end of the new developed terawatt laser system at Peking University as an upgrade part of the Compact LAser Plasma Accelerator (CLAPA)[96]. Collimated laser pulses are exported to the experiment area through a 50:50 beam-splitter downstream of the regenerative amplifier. The pulse energy is less than 0.2 mJ, which is low enough to not modify the channel profile.
The capillary is placed on a motorized hexapod stage that can help to precisely adjust the alignment between a capillary and collimated laser pulses, which will affect the output laser profile. For this paper, the length of all used capillaries is 3 cm and the radii are 150, 250 and 350 μm. The off-axis deviation can be reduced to
![]()
Figure 4.(a) Schematic overview of the experimental setup. Laser pulses propagate from right to left along a capillary as the axis in the  (the upper subfigure) and
  (the lower one). (c) Discharge phenomenon of a gas-filled capillary viewed from the side.
A simple lens imaging system is set for this detection. The distance between the lens with a focal length of 25 cm and the capillary outlet is about 30 cm. The transverse, time-integrated laser pulse profile was imaged with a charge-coupled device (CCD) camera, which has
A DG645 device was used to achieve laser pulses with a repetition rate of 1 kHz propagating through discharged plasma channels at various times, by allocating delay times of the thyratron switch trigger signal referring to the regenerative amplifier trigger signal. The thyratron switch in the incentive source is triggered to close with several ns time jitter. Helmholtz coils are set around current transform cables to get the discharge current time-evolving waveforms and a photodiode was used to get signals when the laser pulses arrived. Both can be measured by an oscilloscope at the same time. The relative time difference between the timing moments of two waveforms is the basis for the time relationship between a laser pulse and a plasma channel.
All the experimental parameter groups are listed in Table 1. As an example, the result of the No. 9 experiment will be analyzed as follows, and is shown in Figure 5. The technique adopted in our example is the simple RLC circuit. The selectable ranges of the resistance (

Table 1. Parameters for all experimental groups.
Table 1. Parameters for all experimental groups.
Number Voltage Gas Waveform style Diameter Pressure Decline rate $\varsigma$ 1 15 kV He Style 3 500 μm 100 Torr 12.06 ${\unicode{x3bc} \mathrm{s}}^{-1}$ 2 20 kV He Style 3 500 μm 100 Torr 15.43 ${\unicode{x3bc} \mathrm{s}}^{-1}$ 3 25 kV He Style 3 500 μm 100 Torr 16.51 ${\unicode{x3bc} \mathrm{s}}^{-1}$ 4 28 kV He Style 3 500 μm 100 Torr 20.96 ${\unicode{x3bc} \mathrm{s}}^{-1}$ 5 15 kV Ar Style 3 500 μm 100 Torr 12.92 ${\unicode{x3bc} \mathrm{s}}^{-1}$ 6 20 kV Ar Style 3 500 μm 100 Torr 17.85 ${\unicode{x3bc} \mathrm{s}}^{-1}$ 7 25 kV Ar Style 3 500 μm 100 Torr 18.61 ${\unicode{x3bc} \mathrm{s}}^{-1}$ 8 28 kV Ar Style 3 500 μm 100 Torr 24.00 ${\unicode{x3bc} \mathrm{s}}^{-1}$ 9 20 kV He Style 1 500 μm 100 Torr 5.72 ${\unicode{x3bc} \mathrm{s}}^{-1}$ 10 18 kV He Style 2 500 μm 100 Torr 9.28 ${\unicode{x3bc} \mathrm{s}}^{-1}$ 11 20 kV He Style 1 300 μm 100 Torr 34.47 $\unicode{x3bc} {\mathrm{s}}^{-1}$ 12 20 kV He Style 1 700 μm 100 Torr 5.29 ${\unicode{x3bc} \mathrm{s}}^{-1}$ 13 20 kV He Style 1 500 μm 80 Torr 20.41 ${\unicode{x3bc} \mathrm{s}}^{-1}$ 14 20 kV He Style 1 500 μm 90 Torr 14.52 ${\unicode{x3bc} \mathrm{s}}^{-1}$
![]()
Figure 5.Current waveform measured in the No. 9 experiment shown with a solid red line and fitting results with the waveform based on Equation (19) shown with a broken red line, reconstructed evolution of  from experimental data shown with blue triangle marks and an exponential decline tendency of
  evolution shown with a dotted blue line. Both of the red curves above have the
  -axis on the right in red. Both of the blue curves have the
  -axis on the left in blue. Subfigure groups made up of a lower one, a measured profile and an upper one, a reconstructed profile via fitting results, in the same column from left to right, correspond to a laser pulse propagating through plasma channels at 245, 343, 458, 537 and 644 ns, respectively. All subfigures are under the unified ruler and color bar placed in the upper right corner inside.
where
5 Experimental results and discussion
In previous work, the impact of discharge voltages and avalanche processes[99] on the development of subsequent plasma channels was rarely considered. Here, we evaluated the influence of the discharge voltages on plasma density evolution with quartic distributions by three styles of waveforms with different current pulse widths keeping the peak currents the same as much as possible, as shown in Figure 6(a). The three different styles of waveforms are obtained by adjusting circuit parameters
![]()
Figure 6.(a) Measured (solid lines) and fitting (broken lines) current waveforms of Style 1 in red, Style 2 in blue and Style 3 in black with  ,
,  and
and  respectively in the No. 9, No. 10 and No. 1 experiments correspondingly. (b) Reconstructed evolutions of density profile coefficient
  shown with triangle marks and exponential decline tendencies shown with broken lines with various styles of waveforms in No. 9 (red), No. 10 (blue) and No. 1 (black) experiments.
At the rising edge of the current, the gas is rapidly broken down and transformed into almost fully ionized plasma. Discharge voltages positively push the process via more electron emissions[99]. From around the current peak moment, the non-uniform plasma profile is formed and begins to evolve. The evolution process is positively correlated with the current, resulting in the heating effect. In order to evaluate the impact of the breakdown on the evolution, we manipulated the incentive source to generate plasma in a waveform with a higher voltage but a smaller heating current, that is, a steeper falling edge of the current. The decline
![]()
Figure 7.Reconstructed evolutions of density profile coefficient  shown with triangle marks and exponential decline tendencies shown with broken lines (a) with various high voltages
  , 20, 25 and 28 kV for He plasma in the No. 1 (red), No. 2 (blue), No. 3 (black) and No. 4 (green) experiments, (b) with various high voltages
  , 20, 25 and 28 kV for Ar plasma in the No. 5 (red), No. 6 (blue), No. 7 (black) and No. 8 (green) experiments. (c) Scaling of the exponential decline rate
  with high voltages for He plasma shown with the light-blue line and Ar plasma shown with the light-red line. The circle marks are in colors corresponding to those in (a) and (b).
For the same style of waveform with almost the same oscillation scale
In order to clarify the influence of the experimental conditions on the profile evolutions, we adopt the control variable method for group comparisons listed in Table 1. Figure 7(a) shows reconstructed profile evolutions with triangle marks and exponential decline tendencies with broken lines with various high voltages
Figure 8(a) shows reconstructed profile evolutions with triangle marks and exponential decline tendencies with broken lines with various capillary diameters
![]()
Figure 8.Reconstructed evolutions of the density profile coefficient  shown with triangle marks and exponential decline tendencies shown with broken lines (a) with various capillary diameters
  ,
,  and
and  in the No. 11 (red), No. 9 (blue) and No. 12 (black) experiments, and (b) with various pressures
  , 90 and 100 Torr in the No. 13 (red), No. 14 (blue) and No. 9 (black) experiments. (c) Scaling of the exponential decline rate
  with diameters. The circle marks are in colors corresponding to those in (a). (d) Scaling of the exponential decline rate
  with pressures. The circle marks are in colors corresponding to those in (b).
From the experimental results, we can roughly describe the phenomenon of the plasma channel evolution. Previous research work[67,68,92] has described the ohmic heating model of plasmas under quasi-thermal equilibrium conditions. It is the basis on which the
So far, the quartic density profile evolution at the outer edge of the channel has not been succinctly described as a brief model. We suspect that this has a great deal to do with heat conduction, nonlocal thermal equilibrium, potential balance and particle collisions and diffusion with the wall material. Probably, it is a reasonable explanation to associate quartic density profile contributions with the plasma presheath of arc discharges[100]. Due to the conservation of particle numbers, the density at the outer edge of channels is positively correlated with the plasma temperature in the central channel region. Obviously, the same goes for the temperature at the edge. Thus, the thickness of the presheath is negatively correlated with temperature. In this way, the profile evolution process is linked to the initial temperature rise of the central plasma. To a certain extent,
The density profile evolution offers additional ideas for optimizing the plasma channel. For applications of capillaries such as guiding ultra-intense laser pulses and laser–plasma acceleration, ideal parabolic density profiles seem to require sufficient plasma heating but within larger temperature gradients. The laser–plasma relativistic interactions considering quartic profile contributions remain unstudied. For charged particle beam transports with plasma channels as APLs, the current density profile is a crucial factor. Plasma with almost entirely parabolic distributions and large temperature gradients is not conducive to maintaining beam emittance. Far from quasi-thermal equilibrium conditions, the impact of quartic profile contributions on the current density profile is unknown. A balance should be found on whether to change circuit parameters or to choose different plasma synchronous moments when searching for the desired currents.
One more experiment was carried out with the same contributions but with laser wavelength
![]()
Figure 9.Reconstructed profile evolutions shown with triangle marks and exponential decline tendencies shown with broken lines from measurements with laser wavelength  nm of the front (red) end and
  nm of a
6 Conclusions
Inspired by previous research, we study the channel-guided laser propagation in plasma channels with quartic density profiles. For a given plasma distribution, an approximate intensity evolution of the channel-guided laser is concluded. Under the assumption in the presence of the longitudinal flow and axisymmetric distribution, the laser intensity distribution at the outlet of the fixed-length plasma channel corresponds to the density profile information. The evolution process of a plasma density profile would be given by measurements of transverse, time-integrated laser intensity profiles at various times. We define a characteristic coefficient that is appropriate to describe the problem. In particular, the evolution processes of channel plasma density profiles with quartic density profile contributions may be described as an exponential decline tendency of the coefficients over time. The factors influencing the decline rate that characterized the profile evolution speed, including but not limited to circuit parameters, capillary diameters, types of gases injected and pressures, were studied experimentally. It can be found that voltages and currents are positive factors to quicken plasma evolutions when parameters of the filled gas are held constant, and electron-ion heat conduction, radii and pressures are negative ones, when parameters of the incentive source are held constant. The experimental results in this paper provide support and reflection for the physical research on discharged capillary plasma and optimizing plasma channels in various applications.
[1] T. Tajima, J. M. Dawson. Phys. Rev. Lett., 43, 267(1979).
[2] E. Esarey, P. Sprangle, J. Krall, A. Ting.
[3] E. Esarey, C. B. Schroeder, W. P. Leemans. Rev. Mod. Phys., 81, 1229(2009).
[4] S. M. Hooker. Nat. Photonics, 7, 775(2013).
[5] X. Wang, R. Zgadzaj, N. Fazel, Z. Li, S. A. Yi, X. Zhang, W. Henderson, Y.-Y. Chang, R. Korzekwa, H.-E. Tsai, C.-H. Pai, H. Quevedo, G. Dyer, E. Gaul, M. Martinez, A. C. Bernstein, T. Borger, M. Spinks, M. Donovan, V. Khudik, G. Shvets, T. Ditmire, M. C. Downer. Nat. Commun., 4(2013).
[6] W. P. Leemans, B. Nagler, A. J. Gonsalves, Cs. Tóth, K. Nakamura, C. G. R. Geddes, E. Esarey, C. B. Schroeder, S. M. Hooker. Nat. Phys., 2, 696(2006).
[7] W. P. Leemans, A. J. Gonsalves, H.-S. Mao, K. Nakamura, C. Benedetti, C. B. Schroeder, Cs. Tóth, J. Daniels, D. E. Mittelberger, S. S. Bulanov, J.-L. Vay, C. G. R. Geddes, E. Esarey. Phys. Rev. Lett., 113, 245002(2014).
[8] A. J. Gonsalves, K. Nakamura, J. Daniels, C. Benedetti, C. Pieronek, T. C. H. de Raadt, S. Steinke, J. H. Bin, S. S. Bulanov, J. van Tilborg, C. G. R. Geddes, C. B. Schroeder, Cs. Tóth, E. Esarey, K. Swanson, L. Fan-Chiang, G. Bagdasarov, N. Bobrova, V. Gasilov, G. Korn, P. Sasorov, W. P. Leemans. Phys. Rev. Lett., 122, 084801(2019).
[9] R. Weingartner, S. Raith, A. Popp, S. Chou, J. Wenz, K. Khrennikov, M. Heigoldt, A. R. Maier, N. Kajumba, M. Fuchs, B. Zeitler, F. Krausz, S. Karsch, F. Grüner. Phys. Rev. Spec. Top. Accel. Beams, 15, 111302(2012).
[10] G. R. Plateau, C. G. R. Geddes, D. B. Thorn, M. Chen, C. Benedetti, E. Esarey, A. J. Gonsalves, N. H. Matlis, K. Nakamura, C. B. Schroeder, S. Shiraishi, T. Sokollik, J. van Tilborg, Cs. Toth, S. Trotsenko, T. S. Kim, M. Battaglia, Th. Stöhlker, W. P. Leemans. Phys. Rev. Lett., 109, 064802(2012).
[11] O. Lundh, J. Lim, C. Rechatin, L. Ammoura, A. Ben-Ismaïl, X. Davoine, G. Gallot, J.-P. Goddet, E. Lefebvre, V. Malka, J. Faure. Nat. Phys., 7, 219(2011).
[12] A. Buck, M. Nicolai, K. Schmid, C. M. S. Sears, A. Sävert, J. M. Mikhailova, F. Krausz, M. C. Kaluza, L. Veisz. Nat. Phys., 7, 543(2011).
[13] J. P. Couperus, R. Pausch, A. Köhler, O. Zarini, J. M. Krämer, M. Garten, A. Huebl, R. Gebhardt, U. Helbig, S. Bock, K. Zeil, A. Debus, M. Bussmann, U. Schramm, A. Irman. Nat. Commun., 8, 487(2017).
[14] C. G. R. Geddes, Cs. Toth, J. van Tilborg, E. Esarey, C. B. Schroeder, D. Bruhwiler, C. Nieter, J. Cary, W. P. Leemans. Nature, 431, 538(2004).
[15] J. Faure, Y. Glinec, A. Pukhov, S. Kiselev, S. Gordienko, E. Lefebvre, J.-P. Rousseau, F. Burgy, V. Malka. Nature, 431, 541(2004).
[16] S. P. D. Mangles, C. D. Murphy, Z. Najmudin, A. G. R. Thomas, J. L. Collier, A. E. Dangor, E. J. Divall, P. S. Foster, J. G. Gallacher, C. J. Hooker, D. A. Jaroszynski, A. J. Langley, W. B. Mori, P. A. Norreys, F. S. Tsung, R. Viskup, B. R. Walton, K. Krushelnick. Nature, 431, 535(2004).
[17] A. Zigler, Y. Ehrlich, C. Cohen, J. Krall, P. Sprangle. J. Opt. Soc. Am. B, 13, 68(1996).
[18] Y. Ehrlich, C. Cohen, A. Zigler, J. Krall, P. Sprangle, E. Esarey. Phys. Rev. Lett., 77, 4186(1996).
[19] Y. Ehrlich, C. Cohen, D. Kaganovich, A. Zigler, R. F. Hubbard, P. Sprangle, E. Esarey. J. Opt. Soc. Am. B, 15, 2416(1998).
[20] D. Kaganovich, P. V. Sasorov, Y. Ehrlich, C. Cohen, A. Zigler. Appl. Phys. Lett., 71, 2925(1997).
[21] D. Kaganovich, A. Ting, C. I. Moore, A. Zigler, H. R. Burris, Y. Ehrlich, R. Hubbard, P. Sprangle. Phys. Rev. E, 59, R4769(1999).
[22] R. F. Hubbard, Y. Ehrlich, D. Kaganovich, C. Cohen, C. I. Moore, P. Sprangle, A. Ting, A. Zigler. AIP Conf. Proc., 472, 394(1999).
[23] D. Kaganovich, P. Sasorov, C. Cohen, A. Zigler. Appl. Phys. Lett., 75, 772(1999).
[24] T. Hosokai, M. Kando, H. Dewa, H. Kotaki, S. Kondo, N. Hasegawa, K. Nakajima, K. Horioka. Opt. Lett., 25, 10(2000).
[25] E. Esarey, J. Krall, P. Sprangle. Phys. Rev. Lett., 72, 2887(1994).
[26] E. Esarey, P. Sprangle, J. Krall, A. Ting. IEEE J. Quantum Electron., 33, 1879(1997).
[27] A. J. Gonsalves, K. Nakamura, C. Lin, D. Panasenko, S. Shiraishi, T. Sokollik, C. Benedetti, C. B. Schroeder, C. G. R. Geddes, J. van Tilborg, J. Osterhoff, E. Esarey, C. Toth, W. P. Leemans. Nat. Phys., 7, 862(2011).
[28] M. Kirchen, S. Jalas, P. Messner, P. Winkler, T. Eichner, L. Hübner, T. Hülsenbusch, L. Jeppe, T. Parikh, M. Schnepp, A. R. Maier. Phys. Rev. Lett., 126, 174801(2021).
[29] N. H. Matlis, A. J. Gonsalves, S. Steinke, J. van Tilborg, B. Shaw, D. E. Mittelberger, C. G. R. Geddes, W. P. Leemans. J. Appl. Phys., 119, 074501(2016).
[30] L. Schaper, L. Goldberg, T. Kleinwächter, J.-P. Schwinkendorf, J. Osterhoff. Nucl. Instrum. Methods Phys. Res. Sect. A, 740, 208(2014).
[31] N. H. Matlis, A. J. Gonsalves, S. Steinke, J. van Tilborg, E. H. Matlis, B. Shaw, D. E. Mittelberger, C. G. R. Geddes, W. P. Leemans. J. Appl. Phys., 118, 204506(2015).
[32] M. Fuchs, R. Weingartner, A. Popp, Z. Major, S. Becker, J. Osterhoff, I. Cortrie, B. Zeitler, R. Hörlein, G. D. Tsakiris, U. Schramm, T. P. Rowlands-Rees, S. M. Hooker, D. Habs, F. Krausz, S. Karsch, F. Grüner. Nat. Phys., 5, 826(2009).
[33] A. Butler, A. J. Gonsalves, C. M. McKenna, D. J. Spence, S. M. Hooker, S. Sebban, T. Mocek, I. Bettaibi, B. Cros. Phys. Rev. Lett., 91, 205001(2003).
[34] M. Chen, J. Luo, F.-Y. Li, F. Liu, Z.-M. Sheng, J. Zhang. Light Sci. Appl., 5, e16015(2016).
[35] E. A. Gibson, X. Zhang, T. Popmintchev, A. Paul, N. Wagner, A. Lytle, I. P. Christov, M. M. Murnane, H. C. Kapteyn. IEEE J. Select. Top. Quantum Electron., 10, 1339(2004).
[36] J. Luo, M. Chen, W. Y. Wu, S. M. Weng, Z. M. Sheng, C. B. Schroeder, D. A. Jaroszynski, E. Esarey, W. P. Leemans, W. B. Mori, J. Zhang. Phys. Rev. Lett., 120, 154801(2018).
[37] K. Nakajima. Light Sci. Appl., 7, 21(2018).
[38] A. Zigler, M. Botton, Y. Ferber, G. Johansson, O. Pollak, E. Dekel, F. Filippi, M. P. Anania, F. Bisesto, R. Pompili, M. Ferrario. Appl. Phys. Lett., 113, 183505(2018).
[39] V. Shpakov, M. P. Anania, M. Bellaveglia, A. Biagioni, F. Bisesto, F. Cardelli, M. Cesarini, E. Chiadroni, A. Cianchi, G. Costa, M. Croia, A. Del Dotto, D. Di Giovenale, M. Diomede, M. Ferrario, F. Filippi, A. Giribono, V. Lollo, M. Marongiu, V. Martinelli, A. Mostacci, L. Piersanti, G. Di Pirro, R. Pompili, S. Romeo, J. Scifo, C. Vaccarezza, F. Villa, A. Zigler. Phys. Rev. Lett., 122, 114801(2019).
[40] R. D'Arcy, S. Wesch, A. Aschikhin, S. Bohlen, C. Behrens, M. J. Garland, L. Goldberg, P. Gonzalez, A. Knetsch, V. Libov, A. Martinez de la Ossa, M. Meisel, T. J. Mehrling, P. Niknejadi, K. Poder, J.-H. Röckemann, L. Schaper, B. Schmidt, S. Schröder, C. Palmer, J.-P. Schwinkendorf, B. Sheeran, M. J. V. Streeter, G. Tauscher, V. Wacker, J. Osterhoff. Phys. Rev. Lett., 122, 034801(2019).
[41] R. Pompili, D. Alesini, M. P. Anania, M. Behtouei, M. Bellaveglia, A. Biagioni, F. G. Bisesto, M. Cesarini, E. Chiadroni, A. Cianchi, G. Costa, M. Croia, A. Del Dotto, D. Di Giovenale, M. Diomede, F. Dipace, M. Ferrario, A. Giribono, V. Lollo, L. Magnisi, M. Marongiu, A. Mostacci, L. Piersanti, G. Di Pirro, S. Romeo, A. R. Rossi, J. Scifo, V. Shpakov, C. Vaccarezza, F. Villa, A. Zigler. Nat. Phys., 17, 499(2021).
[42] J. van Tilborg, S. Steinke, C. G. R. Geddes, N. H. Matlis, B. H. Shaw, A. J. Gonsalves, J. V. Huijts, K. Nakamura, J. Daniels, C. B. Schroeder, C. Benedetti, E. Esarey, S. S. Bulanov, N. A. Bobrova, P. V. Sasorov, W. P. Leemans. Phys. Rev. Lett., 115, 184802(2015).
[43] R. Pompili, M. P. Anania, M. Bellaveglia, A. Biagioni, S. Bini, F. Bisesto, E. Brentegani, G. Castorina, E. Chiadroni, A. Cianchi, M. Croia, D. Di Giovenale, M. Ferrario, F. Filippi, A. Giribono, V. Lollo, A. Marocchino, M. Marongiu, A. Mostacci, G. Di Pirro, S. Romeo, A. R. Rossi, J. Scifo, V. Shpakov, C. Vaccarezza, F. Villa, A. Zigler. Appl. Phys. Lett., 110, 104101(2017).
[44] J. van Tilborg, S. K. Barber, C. Benedetti, C. B. Schroeder, F. Isono, H.-E. Tsai, C. G. R. Geddes, W. P. Leemans. Phys. Plasmas, 25, 056702(2018).
[45] C. A. Lindstrøm, E. Adli, G. Boyle, R. Corsini, A. E. Dyson, W. Farabolini, S. M. Hooker, M. Meisel, J. Osterhoff, J.-H. Röckemann, L. Schaper, K. N. Sjobak. Phys. Rev. Lett., 121, 194801(2018).
[46] R. Pompili, M. Anania, M. Bellaveglia, A. Biagioni, S. Bini, F. Bisesto, E. Brentegani, F. Cardelli, G. Castorina, E. Chiadroni, A. Cianchi, O. Coiro, G. Costa, M. Croia, D. Di Giovenale, M. Ferrario, F. Filippi, A. Giribono, V. Lollo, A. Marocchino, M. Marongiu, V. Martinelli, A. Mostacci, D. Pellegrini, L. Piersanti, G. Di Pirro, S. Romeo, A. Rossi, J. Scifo, V. Shpakov, A. Stella, C. Vaccarezza, F. Villa, A. Zigler. Phys. Rev. Lett., 121, 174801(2018).
[47] R. Pompili, G. Castorina, M. Ferrario, A. Marocchino, A. Zigler. AIP Adv., 8, 015326(2018).
[48] A. F. Pousa, A. Martinez de la Ossa, R. Brinkmann, R. W. Assmann. Phys. Rev. Lett., 123, 054801(2019).
[49] R. Pompili, E. Chiadroni, A. Cianchi, A. Del Dotto, L. Faillace, M. Ferrario, P. Iovine, M. R. Masullo. Phys. Rev. Accel. Beams, 22, 121302(2019).
[50] S. K. Barber, J. H. Bin, A. J. Gonsalves, F. Isono, J. van Tilborg, S. Steinke, K. Nakamura, A. Zingale, N. A. Czapla, D. Schumacher, C. B. Schroeder, C. G. R. Geddes, W. P. Leemans, E. Esarey. Appl. Phys. Lett., 116, 234108(2020).
[51] T. Yang, H. Cheng, Y. Yan, M. Wu, D. Li, Y. Li, Y. Xia, C. Lin, X. Yan. Phys. Rev. Accel. Beams, 24, 031301(2021).
[52] J. Bin, L. Obst-Huebl, J.-H. Mao, K. Nakamura, L. D. Geulig, H. Chang, Q. Ji, L. He, J. De Chant, Z. Kober, A. J. Gonsalves, S. Bulanov, S. E. Celniker, C. B. Schroeder, C. G. R. Geddes, E. Esarey, B. A. Simmons, T. Schenkel, E. A. Blakely, S. Steinke, A. M. Snijders. Sci. Rep., 12, 1484(2022).
[53] P. Sprangle, E. Esarey. Phys. Fluids B, 4, 2241(1992).
[54] P. Sprangle, E. Esarey, J. Krall, G. Joyce. Phys. Rev. Lett., 69, 2200(1992).
[55] P. Sprangle, B. Hafizi, J. R. Peñano. Phys. Rev. E, 61, 4381(2000).
[56] P. Jha, N. Wadhwani, A. K. Upadhyaya, G. Raj. Phys. Plasmas, 11, 3259(2004).
[57] E. Esarey, C. B. Schroeder, B. A. Shadwick, J. S. Wurtele, W. P. Leemans. Phys. Rev. Lett., 84, 3081(2000).
[58] C. Ren, B. J. Duda, R. G. Hemker, W. B. Mori, T. Katsouleas, T. M. Antonsen, P. Mora. Phys. Rev. E, 63, 026411(2001).
[59] P. Sprangle, J. R. Peñano, B. Hafizi. Phys. Rev. E, 66, 046418(2002).
[60] A. K. Upadhyay, G. Raj, R. K. Mishra, A. Malviya, P. Jha. Phys. Plasmas, 14, 093107(2007).
[61] A. K. Upadhyay, G. Raj, R. K. Mishra, P. Jha. Phys. Plasmas, 14, 113105(2007).
[62] P. Sprangle, A. Ting, C. M. Tang. Phys. Rev. Lett., 59, 202(1987).
[63] P. Sprangle, A. Ting, C. M. Tang. Phys. Rev. A, 36, 2773(1987).
[64] C. Benedetti, C. B. Schroeder, E. Esarey, W. P. Leemans. Phys. Plasmas, 19, 053101(2012).
[65] E. Esarey, W. P. Leemans. Phys. Rev. E, 59, 1082(1999).
[66] L. Yu, H. M. Zhao, Q. Cao, X. Z. Zhu, J. L. Li, B. Y. Li, F. Liu, M. Chen, Z. M. Sheng. Plasma Phys. Control. Fusion, 64, 075009(2022).
[67] N. A. Bobrova, A. A. Esaulov, J.-I. Sakai, P. V. Sasorov, D. J. Spence, A. Butler, S. M. Hooker, S. V. Bulanov. Phys. Rev. E, 65, 016407(2001).
[68] B. H. P. Broks, K. Garloff, J. J. A. M. van der Mullen. Phys. Rev. E, 71, 016401(2005).
[69] D. J. Spence, S. M. Hooker. Phys. Rev. E, 63, 015401(2000).
[70] D. M. Gaudiosi, B. Reagan, T. Popmintchev, M. Grisham, M. Berrill, O. Cohen, B. C. Walker, M. M. Murnane, H. C. Kapteyn, J. J. Rocca. Phys. Rev. Lett., 96, 203001(2006).
[71] D. J. Spence, P. D. S. Burnett, S. M. Hooker. Opt. Lett., 24, 993(1999).
[72] F. Brandi, L. A. Gizzi. High Power Laser Sci. Eng., 7, e26(2019).
[73] A. J. Gonsalves, T. P. Rowlands-Rees, B. H. P. Broks, J. J. A. M. van der Mullen, S. M. Hooker. Phys. Rev. Lett., 98, 025002(2007).
[74] T. G. Jones, A. Ting, D. Kaganovich, C. I. Moore, P. Sprangle. Phys. Plasmas, 10, 4504(2003).
[75] J. Kim, V. L. J. Phung, K. Roh, M. Kim, K. Kang, H. Suk. Rev. Sci. Instrum., 92, 023511(2021).
[76] Y. Ping, I. Geltner, A. Morozov, S. Suckewer. Phys. Plasmas, 9, 4756(2002).
[77] H. S. Uhm, D. G. Jang, M. S. Kim, H. Suk. Phys. Plasmas, 19, 024501(2012).
[78] G. Bagdasarov, P. Sasorov, A. Boldarev, O. Olkhovskaya, V. Gasilov, A. J. Gonsalves, S. Barber, S. S. Bulanov, C. B. Schroeder, J. van Tilborg, E. Esarey, W. P. Leemans, T. Levato, D. Margarone, G. Korn, S. V. Bulanov. Phys. Plasmas, 24, 053111(2017).
[79] J. M. Garland, G. Tauscher, S. Bohlen, G. J. Boyle, R. D’Arcy, L. Goldberg, K. Põder, L. Schaper, B. Schmidt, J. Osterhoff. Rev. Sci. Instrum., 92, 013505(2021).
[80] A. Curcio, F. Bisesto, G. Costa, A. Biagioni, M. P. Anania, R. Pompili, M. Ferrario, M. Petrarca. Phys. Rev. E, 100, 053202(2019).
[81] X.-Z. Zhu, B.-Y. Li, F. Liu, J.-L. Li, Z.-W. Bi, L. Lu, X.-H. Yuan, W.-C. Yan, M. Chen, L.-M. Chen, Z.-M. Sheng, J. Zhang. Acta Phys. Sin., 71, 095202(2022).
[82] A. Biagioni, M.P. Anania, M. Bellaveglia, E. Chiadroni, A. Cianchi, D. Di Giovenale, G. Di Pirro, M. Ferrario, F. Filippi, A. Mostacci, R. Pompili, V. Shpakov, C. Vaccarezza, F. Villa, A. Zigler. J. Instrum., 11, C08003(2016).
[83] P. S. Antsiferov, M. R. Akdim, H. T. van Dam. Rev. Sci. Instrum., 78, 123107(2007).
[84] J. Liu, W. Li, J. Liu, Z. Qin, W. Wang, R. Qi, Z. Zhang, C. Yu, M. Fang, K. Feng, Y. Wu, C. Wang, R. Li. AIP Adv., 8, 105204(2018).
[85] T. P. Rowlands-Rees, C. Kamperidis, S. Kneip, A. J. Gonsalves, S. P. D. Mangles, J. G. Gallacher, E. Brunetti, T. Ibbotson, C. D. Murphy, P. S. Foster, M. J. V. Streeter, F. Budde, P. A. Norreys, D. A. Jaroszynski, K. Krushelnick, Z. Najmudin, S. M. Hooker. Phys. Rev. Lett., 100, 105005(2008).
[86] T. G. Jones, K. Krushelnick, A. Ting, D. Kaganovich, C. I. Moore, A. Morozov. Rev. Sci. Instrum., 73, 2259-2265(2002).
[87] J. Daniels, J. van Tilborg, A. J. Gonsalves, C. B. Schroeder, C. Benedetti, E. Esarey, W. P. Leemans. Phys. Plasmas, 22, 073112(2015).
[88] J. van Tilborg, A. J. Gonsalves, E. H. Esarey, C. B. Schroeder, W. P. Leemans. Opt. Lett., 43, 2776(2018).
[89] J. van Tilborg, A. J. Gonsalves, E. Esarey, C. B. Schroeder, W. P. Leemans. Phys. Plasmas, 26, 023106(2019).
[90] A. J. Gonsalves, K. Nakamura, C. Lin, J. Osterhoff, S. Shiraishi, C. B. Schroeder, C. G. R. Geddes, E. Esarey Cs. Tóth, W. P. Leemans. Phys. Plasmas, 17(2010).
[91] M. Turner, A. J. Gonsalves, S. S. Bulanov, C. Benedetti, N. A. Bobrova, V. A. Gasilov, P. V. Sasorov, G. Korn, K. Nakamura, J. van Tilborg, C. G. Geddes, C. B. Schroeder, E. Esarey. High Power Laser Sci. Eng., 9, e17(2021).
[92] B. Broks, J. van Dijk, H. Bastiaens, K. Boller, J. van der Mullen. J. Phys. D, 39, 2384(2006).
[93] V. V. Kotlyar, A. A. Kovalev.
[94] A. E. Siegman. Lasers(1986).
[95] A. D. Buckingham, C. Graham. Proc. R. Soc. Lond. Ser. A, 337, 275(1974).
[96] J. G. Zhu, M. J. Wu, Q. Liao, Y. X. Geng, K. Zhu, C. C. Li, X. H. Xu, D. Y. Li, Y. R. Shou, T. Yang, P. J. Wang, D. H. Wang, J. J. Wang, C. E. Chen, X. T. He, Y. Y. Zhao, W. J. Ma, H. Y. Lu, T. Tajima, C. Lin, X. Q. Yan. Phys. Rev. Accel. Beams, 22, 061302(2019).
[97] R. Fletcher. Practical Methods of Optimization: Unconstrained Optimization(1980).
[98] X. Yuan, Y. Xu, R. Zhao, X. Hong, R. Lu, X. Feng, Y. Chen, J. Zou, C. Zhang, Y. Qin, Y. Zhu. Optics, 2, 87(2021).
[99] M. J. Druyvesteyn, F. M. Penning. Rev. Mod. Phys., 12, 87(1940).
[100] B. Mancinelli, L. Prevosto, J. C. Chamorro, F. O. Minotti, H. Kelly. Plasma Chem. Plasma Process., 38, 147(2018).
[101] T. D. Arber, K. Bennett, C. S. Brady, A. Lawrence-Douglas, M. G. Ramsay, N. J. Sircombe, P. Gillies, R. G. Evans, H. Schmitz, A. R. Bell, C. P. Ridgers. Plasma Phys. Controll. Fusion, 57, 113001(2015).
Tools
Get Citation
Copy Citation Text
Tong Yang, Zhen Guo, Yang Yan, Minjian Wu, Yadong Xia, Qiangyou He, Hao Cheng, Yuze Li, Yanlv Fang, Yanying Zhao, Xueqing Yan, Chen Lin. Measurements of plasma density profile evolutions with a channel-guided laser[J]. High Power Laser Science and Engineering, 2023, 11(6): 06000e85
Paper Information
Special Issue:
Received: Jan. 5, 2023
Accepted: Jun. 7, 2023
Published Online: Dec. 6, 2023
The Author Email: Chen Lin (lc0812@pku.edu.cn)

© Copyright 2018-2021 | Chinese Laser Press.
All Rights Reserved 沪ICP备15018463号-20