


Optical remote sensing is extensively used in military[
Acta Photonica Sinica, Volume. 49, Issue 12, 138(2020)
An Effectiveness Evaluation Method for Space-based Optical Imaging Systems
A novel effectiveness evaluation method was proposed based on the Johnson criteria and minimum resolvable contrast to evaluate effectiveness. In this process, target and background contrast, atmospheric transmission, detectors, and human eyes, are considered comprehensively. The noise equivalent contrast is introduced to measure the noise level of the detector, and the detection efficiency is measured by the joint probability of contrast and resolution, which can quantitatively and intuitively evaluate the detection ability of space-based optical imaging system. Verification experiments are carried out based on aerial and GF-2 satellite images. In aerial images, the recognition probability of car is 46%, the identification probability of aircraft is 73%, and the NIIRS level is 4.23; in GF-2 satellite images, the recognition probability of truck is 67%, the detection probability of small ship is 63%, and the NIIRS level is 4.53. The results show that the probability calculated by our method is basically consistent with the subjective judgment of human eyes, which is basically consistent with the NIIRS. The results prove the effectiveness of the method. Our method is of great significance to the design of space-based imaging systems and the evaluation of the on-orbit satellite detection capability.
Keywords
0 Introduction
Therefore, on the basis of considering target and background contrast, atmospheric transmission, detectors and human eyes, and Noise Equivalent Contrast (NEC)[
1 Evaluation method for the effectiveness of a space-based optical imaging system
1.1 NEC
To facilitate the establishment of an MRC model, we introduce the concept of NEC. In the photoelectric imaging system, when the output signal of the reference electronic filter equals the root-mean-square of the noise of the system itself, the contrast between the target and the background is the noise equivalent contrast.
The SNR from the reference electronic filter can be expressed as
where is radiation flux difference between the target and background, R is the responsivity of the detector, s'(f) is the noise power spectrum of the detector,MTFe(f) is the MTF of the electronic filter.
where is the irradiance difference between the reflected light of target Et and background Eb at the entrance pupil, is the pixel area of the detector, τ is the transmittance of the optical system, D is the aperture, and f0' is the focal length.
According to the definition of NEC, Eq. (1) is assumed to be equal to unity,
where Δfnis the noise equivalent bandwidth,and F=D/f0'. In fact, the nature of NEC is to measure noise based on the intensity of the input signal. In the case of Charge-Coupled Device (CCD) Complementary Metal-Oxide Semiconductor (CMOS) detectors, in addition to the inherent shot noise that is related to the number of charges produced by photoelectric effect, the readout noise should also be considered.
On the basis of the NEC model, the MRC model is also deduced as described in the next subsection.
1.2 MRC
MRC is defined as the contrast between the target and the background when the observer can barely distinguish the bars at a specific spatial frequency. It is an evaluation parameter that can describe quantitatively the threshold contrast of the visible photoelectric imaging system. It includes the factors of sensitivity, noise, spatial frequency, and human eyes. It can fully reflect the detection ability of the photoelectric imaging system.
The process of MRC derivation is as follows. The SNR received by the system can be described as
where C is the contrast between the target and the background. The SNR of the image on the display is
where R(f) is the square wave response of the system, MTFm(f) is the modulation transfer function of the section behind the readout circuit, and s(f) is the noise power spectrum. According to the relationship between R(f) and MTFs(f), and based on the approximation of the first term,
When the observer observes the target, the human eye will modify the SNR according to the following four aspects[
1) The eye extracts the strip pattern. When the signal is distinguishable, the high-order harmonic is filtered out and the first-order harmonic is maintained. The peak value of the signal is then attenuated as follows
2) Because of the time integration, the signal will be sampled independently according to the integral time of the human eye (te= 0.2 s), while noise will be superimposed at the same time. Therefore, the SNR will be improved (tefp)1/2, whereby fp is the frame rate of display.
3) In the vertical direction, the eye will integrate the signal in the spatial domain, and will use the instantaneous vertical field-of-view β as the correlation length of the noise. Thus, the SNR will be improved according to
where L and W are the angle length and angle width of the strips, respectively, and ε0 = L/W, fT=1/(2W).
4) For the periodic rectangular strip target with frequency fT, the narrow-band spatial filtering effect of the human eye is equivalent to the matched filter whose transfer properties can be expressed as sinc2(π/2⋅f/fT)⋅MTF2s(f), where f represents the spatial frequency. Therefore, the integral response of the human eye can be converted into the noise bandwidth Δfeye considering the human eye matching filter according to the actual system bandwidth
where MTFeye(f) is the modulation transfer function of the human eye, and sinc(·) is the sine basis function. As fT goes to zero, Δfeye approaches the target frequency fT (assuming white noise)[
Combining the four aforementioned corrections with the SNRi, the visual SNR can be obtained as
Let SNRv be equal to the threshold SNR such that the human eye can distinguish the stripSNRDT. At this time, C is the MRC.
Based on practical applications, the MRC model needs to be modified:
1) Correction of ε0
The ratio of length to width of the common strips in laboratory is 7∶1 (or 5∶1). However, ε0 is not only related to the target itself, but it is also related to the number of cycles for 50% detection according to the Johnson criteria. Therefore, the ratio of the length-to-width after the correction ε is,
where n is the number of cycles for 50% detection, as shown in Table 1.

Table 1. Johnson criteria
Table 1. Johnson criteria
Discrimination measure Description One-dimensional (1-D) criteria (number cycles) n Two-dimensional (2-D) criteria (number cycles) n Detection Blob has a reasonable probability of being the sought object 1.0 0.75 Recognition Object discerned with sufficient clarity such that its specific class can be differentiated (tank, truck, man) 4.0 3.0 Identification Object discerned with sufficient clarity to specify the type within a class (T-62, T-72, M1 tanks) 8.0 6.0
2) Δfncorrection
In practice, only the dark current noise of the detector is considered, while the dark current noise has a fixed value, that is, NEC is only related to the irradiance of the target and background, but it is also affected by the integration time in practice. Therefore, it needs to be corrected. Herein, we used the multiple tn of integral time to improve SNR instead of Δfn.
The final MRC can be derived as
1.3 Detection efficiency evaluation method based on the combination of MRC and Johnson criteria
By substituting MRC and the contrast between the target and background C0 into the target transfer probability function[
where EC= 2.7+0.7(C0/MRC).
By substituting the resolvable cycles N across the target and n into the target transfer probability function, the resolution limited probability PJ is obtained.
where EJ= 2.7+0.7(N/n).
Finally, the probability of detection is
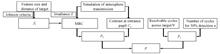
The flow diagram of the proposed method is shown in Fig.1.
2 Experimental verification and analysis
2.1 Experimental verification with aerial images
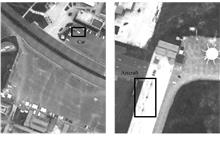
An aviation detection experiment was carried out in Jingmen, Hubei Province on May 20, 2019. The weather was clear on that day, the visibility was 23 km, the time was 9:30 a.m., and the solar altitude angle was 40°. The relevant parameters of the detector for the aviation detection experiment are shown in Table 2. The radiance values of the target (small vehicle) and background (cement pavement) obtained with the atmospheric transmission simulation software were Lt = 0.003 72 W/cm2/sr and Lb= 0.001 56 W/cm2/sr, respectively. The NEC was 0.003 2. The width and length of the target (a car is shown in Fig.2) were 4.8 m and 1.7 m, respectively. We used 2-D criteria in Table 1, n=[0.75 3 6], where the three numbers represented the levels of detection, recognition, and identification, respectively. We obtained the MRC=[0.0097 0.019 0.027] according to Eq. 15. According to Eqs. (16)~(17), we obtained PC=[1.00 1.00 1.00] and PJ=[1.00 0.46 0.10]. Finally, P=[1.00 0.46 0.10], therefore, the probabilities of detection, recognition, and identification, were 100%, 46%, and 10%, respectively. It was worth noting that the contrast-limited probability PC was [1.00 1.00 1.00]. This means that the contrast was adequate to visualize the target at this time. Accordingly, the contrast was not the main factor that affected the probability. Obviously, cars can be easily detected in the aerial image shown in Fig. 2 (the probability of detection was 100%). Furthermore, we can recognize it as a car (the probability of recognition was 46%) but we cannot identify the specific type of the car (the probability of identification was10%). At this point, the NIIRS was 4.23. Similarly, the probability of the aircraft in Fig.2(b) was [1.00 0.92 0.73], i.e., the aircraft can be detected, recognized, and identified. The PC and PJ were [1.00 0.92 0.73] and [1.00 1.00 0.98], the results showed that the resolution was good enough to visualize the target at this time. It can be observed in Fig.2(b) that the gray level values of the aircraft and the ground were almost the same, and the contrast was low. Thus, the contrast was the main factor responsible for probability changes. Our calculation results were consistent with the subjective observation and NIIRS. The results showed that our method was effective and accurate.
Table 2. The relevant parameters of aviation experiment
Table 2. The relevant parameters of aviation experiment
Parameter name Number Parameter name Number Diameter of aperture 20 mm Focal length 5 mm Transmittance of optical system 0.7 GSD 0.5 m Height 586 m SNRDT 2.25
2.2 Experimental verification with GF-2 satellite images
The GF-2 satellite is the first civil optical remote sensing satellite developed by China with a spatial resolution better than 1 m. The resolution of the sub-satellite point can reach a value of 0.8 m. The main technical parameters are shown in Table 3. We used the targets on the land and marine images of GF-2 to carry out the verification experiments.
Table 3. Main technical parameters of GF-2 satellite
Table 3. Main technical parameters of GF-2 satellite
Parameter name Number Parameter name Number Dynamic range ≥25 dB (θ=20°,ρ=0.05);≥46 dB (θ=70°,ρ=0.65) Relative aperture 1/15 MTF 0.12 Focal length 7.8 m GSD 0.8 m Orbital height 631 km SNRDT 2.25
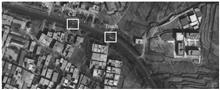
We selected a car and a truck as the targets in Fig.3. The size of the car is 4.8 m×1.7 m (length × width, the same below), and the probability P was [1.00 0.32 0.05]. In addition, the size of the truck is 17.5 m×1.8 m with probabilities P of [1.00 0.67 0.17]. It is worth noting that the observer had prior knowledge, therefore, sometimes even a small recognition probability can have profound effects. For example, when the recognition probability of a car is 0.32, the car can be hardly recognized. However, when it is on the road, it is easier to be recognized as a car. The NIIRS level of Fig.3 is 4.53, which is basically consistent with our method.
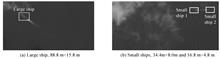
In the marine image, we chose large and small civilian ships as targets, as shown in Fig.4. The probability of the large ship 88.8 m×15.8 m was [1.00 1.00 1.00], while the probabilities of the small ships 1 34.4 m×8.0 m and 2 16.8 m×4.8 m were [0.98 0.63 0.31] and [0.62 0.14 0.03], respectively. The NIIRS level of Fig.4 is 4.53, which is basically consistent with our method.
In general, the detection probability calculated by our method is in good agreement with the subjective judgment of human eye observations.
3 Conclusions
In this study, a new effectiveness evaluation method was proposed for space-based optical imaging systems to evaluate the effectiveness of optical detection based on the Johnson criteria and MRC. Compared with traditional methods, our method took the characteristics of target and background, atmospheric transmission, detectors, and human eyes into considerations. Additionally, our method can calculate the probability of detection, recognition, and identification of targets in typical backgrounds based on given parameters in the design stage to guide the selection of the remote sensing detectors. Experimental results showed that the detection probability calculated by our method is in good agreement with the subjective judgment of human eye observation. We have prepared 100 subjective experiment sample bank of different scale targets, and will carry out a large number of subjective experiments in the future to verify the correctness of our method.
However, this method does not consider subjective factors, such as the experience and ability of observers, and thus needs to be improved by combining it with deep learning and artificial intelligence technologies. It is also necessary to study the noise types of different detectors and optimize the detection efficiency evaluation model. These constitute work-in-progress and are envisaged to constitute the topics of our future research publication.
[1] R S ALLISON, J M JOHNSTON, G CRAIG. Airborne optical and thermal remote sensing for wildfire detection and monitoring. Sensors, 16, 1310(2016).
[2] J VERRELST, G CAMPS-VALLS, J MUÑOZ-MARÍ. Optical remote sensing and the retrieval of terrestrial vegetation bio-geophysical properties–A review. ISPRS Journal of Photogrammetry and Remote Sensing, 108, 273-290(2015).
[3] S KHANAL, J FULTON, S SHEARER. An overview of current and potential applications of thermal remote sensing in precision agriculture. Computers and Electronics in Agriculture, 139, 22-32(2017).
[4] G CHENG, J HAN. A survey on object detection in optical remote sensing images. ISPRS Journal of Photogrammetry and Remote Sensing, 117, 11-28(2016).
[5] M VASSILEVA, F GIULIO TONOLO, P RICCARDI. Satellite SAR interferometric techniques in support to emergency mapping. European journal of remote sensing, 50, 464-477(2017).
[6] N JOSHI, M BAUMANN, A EHAMMER. A review of the application of optical and radar remote sensing data fusion to land use mapping and monitoring. Remote Sensing, 8, 70(2016).
[7] Song LIU, Wei-qi JIN, Li LI. Minimum resolvable contrast measurement of low illumination imaging module and simulation of its range. Acta Photonica Sinica, 45, 0312003(2016).
[8] Hua LUO, Yuan ZHANG. Evaluation of imaging quality of CCD cameras by measuring minimum resolvable contrast. Acta Photonica Sinica, 38, 681-684(2009).
[9] J A RATCHES. Static performance model for thermal imaging systems. Optical Engineering, 15, 156525(1976).
[10] M ABOLGHASEMI, D ABBASI-MOGHADAM. Conceptual design of remote sensing satellites based on statistical analysis and NIIRS criterion. Optical and Quantum Electronics, 47, 2899-2920(2015).
[11] T A SJAARDEMA, C S SMITH, G C BIRCH. History and evolution of the Johnson criteria, SAND-6368(2015).
[12] R G DRIGGERS, M KELLEY. National imagery interpretation rating system and the probabilities of detection, recognition, and identification. Optical Engineering, 36, 1952-1959(1997).
[13] M J DEWEERT, J B COLE, A W SPARKS. Photon transfer methods and results for electron multiplication CCDs, 5558, 248-259(2004).
[14] J M LLOYD. Thermal imaging systems. Springer Science & Business Media(2013).
[15] M C DUDZIK. Electro-optical systems design, analysis, and testing, 4, 245-298(1993).
Tools
Get Citation
Copy Citation Text
Xiao-tian LU, Feng LI, Bian XIAO, Xue YANG, Lei XIN, Ming LU, Zhi-jia LIU. An Effectiveness Evaluation Method for Space-based Optical Imaging Systems[J]. Acta Photonica Sinica, 2020, 49(12): 138

Paper Information
Category: Instrumentation, Measurement and Metrology
Received: Jul. 14, 2020
Accepted: Sep. 23, 2020
Published Online: Mar. 11, 2021
The Author Email:

© Copyright 2018-2021 | Chinese Laser Press.
All Rights Reserved 沪ICP备15018463号-20