


In direct-drive inertial confinement fusion (ICF), laser beams are focused onto the surface of a fusion capsule that is imploded to reach thermonuclear ignition[ )[
)[
High Power Laser Science and Engineering, Volume. 3, Issue 3, 03000001(2015)
Measurements of the ablation-front trajectory and low-mode nonuniformity in direct-drive implosions using x-ray self-emission shadowgraphy

Self-emission x-ray shadowgraphy provides a method to measure the ablation-front trajectory and low-mode nonuniformity of a target imploded by directly illuminating a fusion capsule with laser beams. The technique uses time-resolved images of soft x-rays (>1 keV) emitted from the coronal plasma of the target imaged onto an x-ray framing camera to determine the position of the ablation front. Methods used to accurately measure the ablation-front radius (δR=±1.15 μm), image-to-image timing (δ(Δt)=±2.5 ps) and absolute timing (δt=±10 ps) are presented. Angular averaging of the images provides an average radius measurement of δ(Rav=±0.15 μm and an error in velocity of δV/V= ±3%. This technique was applied on the Omega Laser Facility [Boehly et al., Opt. Commun. 133, 495 (1997)] and the National Ignition Facility [Campbell and Hogan, Plasma Phys. Control. Fusion 41, B39 (1999)].
Keywords
1. Introduction
A self-emission x-ray shadowgraphy (SES) technique[ keV, spectrally filtered using
  Be) emitted in the coronal plasma of an imploding target onto a four-strip x-ray framing camera (XRFC) to obtain 12 (three per strip) time-resolved images of an imploding target. The steep inner edge observed in the intensity profile of the image is used to determine the position of the ablation surface (Figures
This paper describes different methods used to characterize the diagnostic, showing that the accuracy of the measurement of the ablation front position is  . Two techniques were used to measure the image-to-image timing to within
  ps. The method used to time the images to the laser pulse (absolute timing) was demonstrated to have an accuracy of
  ps.
ps.
The SES technique is applied to symmetric implosions on the OMEGA Laser System and to polar-drive experiments on the NIF. The OMEGA Laser is configured for symmetric irradiation, while the beam geometry on the NIF is currently optimized for x-ray geometry with no beams located around the equator. Initial polar-direct-drive experiments repoint the beams toward the equator to generate a uniform ablation[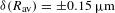 and velocity to within
  . In the symmetrically driven implosions, where the nonuniformity has a random phase, the amplitude and the phase of the modes are determined using a Fourier decomposition. In this case, the amplitude of mode 2 is measured to within
 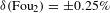 . In the polar-drive implosions, the dominant low-mode nonuniformities are axisymmetric around the polar axis, and the mode amplitudes are determined using a Legendre polynomial decomposition. With this method, the amplitudes of modes 2, 4 and 6 are determined to within
 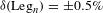 .
.
2. Characterization of the framing camera
The accuracy in the time-resolved measurements of the ablation-front trajectory, velocity and low-mode nonuniformity using the SES technique is determined by the precision in the measurement of the ablation-front position ( ), the accuracy of the image-to-image timing (
 ) and the absolute timing between the images and the laser pulse (
 )[
)[
2.1. Radial accuracy (pinhole imaging)
To optimize the resolution of the steep gradient generated by self-emission x-ray imaging, the optimal pinhole diameter was determined ( ) by setting the diameter of the geometric image of a point (
 , where
  is the diameter of the pinhole) equal to the diameter of the diffraction image of a point (
 , where
  is the magnification of the pinhole imaging system,
  is the x-ray wavelength and
  is the distance between the target and the pinhole). On OMEGA, this corresponds to
  when using
  ,
,  nm and
  mm. This configuration results in the point-spread function (PSF) shown in Figure
  ).
).
Figure
The center of the measured images was determined iteratively. Intensity profiles were taken along chords through the center of the image. The positions of the mid-intensity points on each profile were determined and a new center was calculated, fitting the points with a circle using a  analysis. This process was repeated until the center position changed by no more than
  .
.
The accuracy in the position of the mid-intensity point in the inner gradient of the measured profile can be determined using the intercept theorem 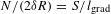 , where
  is the variation in the measured radius,
  and
and  is the standard deviation of the noise. The signal (
 ) is defined as the difference in x-ray intensities over the length of the inner gradient
  (Figure
  , where
  and
and  .
.
In spherical experiments, the position of the ablation front was determined by averaging the position of the mid-intensity point in the inner gradient over all angles. This improved the accuracy of the measured ablation-front position by a factor of  , where
  is the number of independent measurements,
  is the averaged radius and
  is the FWHM of the PSF. On OMEGA, this resulted in an accuracy in the
  angularly averaged radius of
  , where
  and
and  for
for  .
.
Figure  angularly averaged radius is
 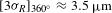 . This is consistent with the peak-to-valley variation in the measured radius calculated from the intercept theorem (
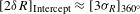 ).
).
2.2. Image-to-image timing (interstrip timing)
The XRFC uses four microchannel plates to time-resolve the pinhole images. The microchannel plates are activated by independently timed high-voltage pulses, and the accuracy in the timing between images on subsequent plates (interstrip timing) is given by the accuracy of the high-voltage pulsers (Figure
The interstrip timing was determined by using an 8 GHz oscilloscope to measure the time difference between the electrical pulses that come from different delay lines. The timing error between two channels was calibrated by splitting an electrical pulse and sending each pulse to two different inputs of the oscilloscope through two cables of the same length. The jitter between two pulsers was determined by repeating the measurements several times. The interstrip timing was measured for the XRFC setup used on the OMEGA Laser System (Figure  ps in the interstrip timing was inferred from the 8 ps of drift in the oscilloscope determined before and after the measurements. The standard deviation of the jitter between two pulsers of
  ps was determined by repeating each measurement five times. This resulted in a jitter of the interstrip timing of
  ps.
ps.
To verify the interstrip timing, the ablation-front trajectory was simultaneously measured using two XRFCs (Figure  ps was determined, where
  ps is the standard deviation of the measurement of the interstrip timing over multiple repeated shots. Excellent agreement was obtained between the two methods (Figure
2.3. Absolute timing
The variation of the absolute timing is determined on each shot by measuring the time difference between the electrical monitor pulse from the XRFC and the optical fiducial, which is a time reference for the laser pulse. To calibrate the absolute timing, the time difference between the laser and the XRFC was measured on a timing reference shot.
The timing reference shot used a 4-mm-diameter gold target with multiple laser pulses that rose over 100 ps to a 1-ns-long flattop intensity. The time-resolved x-ray intensities emitted by the gold plasmas were measured on the XRFC (see images in Figure  [
[ and
and  are the x-ray and laser intensities, respectively). The pulse shape measured by the XRFC was compared with the optical pulse shape (Figure
 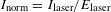 . To account for the variation in the sensitivity of the camera, a few beams were advanced in time by 400 ps to generate a constant x-ray flux (top images in Figure
 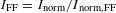 ). Figure
 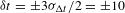 ps was determined, where
  is the standard deviation of the variation of the absolute-timing calibration number.
3. Application
The SES technique was applied to measure the ablation-front trajectory, velocity and nonuniformity of an imploding target in direct-drive implosions on the Omega Laser Facility and low-mode nonuniformities on the NIF.
3.1. Ablation-front trajectory and velocity on the OMEGA Laser System
The experiment employed 60 ultraviolet ( nm) laser beams at the Omega Laser facility. The laser beams uniformly illuminated the target and were smoothed by polarization smoothing[
 outer diameter with a
  -
- -thick CH ablator covered by
  of Al and filled with deuterium at 10.5 atm.
The images displayed at the top of Figure  ps[
ps[
Figure  ps) is given by
  , where
  ps is the error in the interstrip timing (dominated by the error in the measurement of
  (see Section
  . Simulations were performed with the 1D hydrodynamic code
3.2. Ablation-front nonuniformity on the OMEGA Laser System
To investigate the uniformity of the drive, the angular variation in the ablation surface was decomposed using a Fourier series. Figure  ).
).
For each radius, the amplitude of mode 2 is defined by 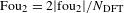 , where
  is the second coefficient of the Fourier transform of
  discretized over
  points equally spaced in angle around the contour,
 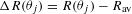 and
and  is the angle of the point
  . When the contour is not defined over all angles, an algorithm is used to determine the discrete Fourier transform[
A  accuracy in the mode 2 measurement was determined and corresponds to three times the standard deviation of the distance between the points and the best-fit line (Figure
  , which is slightly larger than the accuracy in the measurement of the averaged shell radius. The facts that the phase of the nonuniformity does not change significantly over the nine measurements and that a variation of this constant phase was observed among different shots show that the mode is not an artifact of the diagnostic (Figure
3.3. Ablation-front nonuniformity on the NIF
The SES technique was implemented on the NIF to measure the shell trajectory, velocity and low-mode nonuniformities in polar-direct-drive experiments (the experimental setup is detailed in Ref. [ ), which resulted in a
  FWHM of the PSF. In the polar-direct-drive configuration, the illumination is symmetric around the polar axis, so
  is decomposed using Legendre polynomials with their axes of symmetry adjusted to be the polar axes. Figure
Figures  , which corresponds to three times the standard deviation of the distance between the points and the best-fit curves. Simulations were conducted using the 2D hydrodynamic code
The decomposition over Legendre polynomials is defined by  , where
  is the Legendre polynomial
  ,
,  is the coefficient,
  is the Legendre mode and
  corresponds to the angle of the axis of symmetry (Figure
  . With this normalization factor for a symmetric signal, the amplitudes of the modes defined with the Legendre polynomial are similar to the amplitudes of the modes calculated using the Fourier decomposition.
4. Conclusion
In summary, different methods used to characterize the SES technique in the configuration used on the OMEGA Laser System have been presented. The precise calculation of the PSF made it possible to determine the position of the ablation front to within  . Two methods – one offline, one on a shot – were compared to measure the interstrip timing of the XRFC to within
  ps; excellent agreement was obtained. A method to measure the timing between the images and the laser pulse to within
  ps was presented. The SES technique was applied to measure the ablation-front trajectory, velocity and mode 2 nonuniformity on symmetric implosions on OMEGA to within
 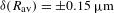 ,
,  and
and 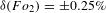 , respectively. Excellent agreement was obtained with 1D hydrodynamic simulations conducted with the code
[6] D. H. Froula, I. V. Igumenshchev, D. T. Michel, D. H. Edgell, R. Follett, V. Yu. Glebov, V. N. Goncharov, J. Kwiatkowski, F. J. Marshall, P. B. Radha, W. Seka, C. Sorce, S. Stagnitto, C. Stoeckl, T. C. Sangster. Phys. Rev. Lett., 108(2012).
[7] D. T. Michel, R. S. Craxton, A. K. Davis, R. Epstein, V. Yu. Glebov, V. N. Goncharov, S. X. Hu, I. V. Igumenshchev, D. D. Meyerhofer, P. B. Radha, T. C. Sangster, W. Seka, C. Stoeckl, D. H. Froula. Plasma Phys. Control. Fusion, 57(2015).
[24] V. Ya. Liepin’sh. Autom. Control Comput. Sci., 30, 27(1996).
[25] P. B. Radha, V. N. Goncharov, T. J. B. Collins, J. A. Delettrez, Y. Elbaz, V. Yu. Glebov, R. L. Keck, D. E. Keller, J. P. Knauer, J. A. Marozas, F. J. Marshall, P. W. McKenty, D. D. Meyerhofer, S. P. Regan, T. C. Sangster, D. Shvarts, S. Skupsky, Y. Srebro, R. P. J. Town, C. Stoeckl. Phys. Plasmas, 12(2005).
Tools
Get Citation
Copy Citation Text
[in Chinese], [in Chinese], [in Chinese], [in Chinese], [in Chinese], [in Chinese], [in Chinese], [in Chinese], [in Chinese], [in Chinese], [in Chinese], [in Chinese], [in Chinese], [in Chinese]. Measurements of the ablation-front trajectory and low-mode nonuniformity in direct-drive implosions using x-ray self-emission shadowgraphy[J]. High Power Laser Science and Engineering, 2015, 3(3): 03000001
Paper Information
Special Issue: PLASMA/LASER DIAGNOSTICS
Received: Feb. 28, 2015
Accepted: Apr. 7, 2015
Published Online: Jan. 7, 2016
The Author Email: (tmic@lle.rochester.edu)

© Copyright 2018-2021 | Chinese Laser Press.
All Rights Reserved 沪ICP备15018463号-20