


 View fulltext

2020
Volume: 30 Issue 6
10 Article(s)

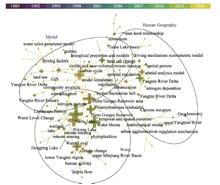
Yang GAO, Junjie JIA, Yao LU, Xiaomin SUN, Xuefa WEN, Nianpeng HE, and Tiantian YANG
Bibliometrics was used to statistically analyze key zones within the Yangtze River Basin (YRB) funded by the National Natural Science Foundation of China (NSFC) and national ministries over the past 20 years. This study determined that funds that derived from national ministries have mainly focused on issues related to environmental pollution, ecological security, technological water regulations, and river basin ecosystems, which offer a better understanding of the national requirements and the scientific knowledge of the YRB in combination with data from the NSFC. Under a background of bolstering the construction of green ecological corridors in the economic belt of the YRB, this study proposes future conceptual watershed research initiatives in this region as a study objective by reinforcing the implementation of the Chinese Ecosystem Research Network (CERN) and by emphasizing the use of new technologies, new methods, and new concepts for the prospective design of frontier research under the perspective of geoscience and earth system science. This study promotes large-scale scientific field and research objectives based on big science and big data.
Jun. 25, 2020Vol. 30 Issue 6 867 (2020)
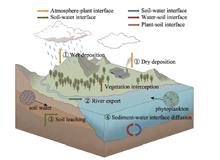
Yao LU, Yang GAO, and Tiantian YANG
The magnitude of mass flux is closely associated with biogeochemical watershed processes, which can generate a considerable amount of pertinent information. Moreover, both the accuracy and precision of mass flux estimation results directly affects the perception of the ecological environmental status, which in turn affects both the formulation and implementation of river basin management planning. In practical applications, the true value of flux is unknown and can only be estimated. Flux results obtained using different monitoring and estimation methods also differ significantly. However, in existing studies on mass flux associated with biogeochemical watershed interfaces, the application of monitoring and estimation methods lacks uniform criteria or references. Accordingly, this study summarizes and deconstructs results from recent studies on biogeochemical watershed interface processes and compares the advantages, disadvantages and applicability of the monitoring and estimation methods used by these studies. This particular study is intended to be used as a reference for the selection of flux calculation methods.
Jun. 25, 2020Vol. 30 Issue 6 881 (2020)
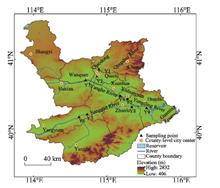
Tao WANG, Zhijiang SHAO, Hui YU, and Hamidou BAH
The excessive exposure to high concentrations of fluoride in drinking water can lead to a serious disease called fluorosis. The upstream region of the Yongding River is an ecological protection area for Beijing. Some studies have reported that there is a high concentration of fluoride in the groundwater in this area. However, there are few data on the distribution of fluoride in surface water and health risk assessments in this area. In this study, the fluoride concentrations were determined by using the spectrophotometric method using data from 2013 to 2017 from 9 surface water quality monitoring stations in the upper reaches of the Yongding River. The health risks of fluoride were assessed using the approach developed by the United States Environmental Protection Agency (US EPA). The results indicated that the fluoride content in the drinking water ranged from 0.30 to 1.50 mg L-1, with an average of 0.86 mg L-1. In total, 22.7% of the analyzed samples exceeded the Chinese limit of 1.0 mg L-1 for fluoride, and 5.5% of samples had less than the permissible limit of 0.5 mg L-1. Higher fluoride concentrations and fluorosis hotspots were found to be predominately located downstream of the Yanghe River close to the Guanting Reservoir, where 71.4% of samples exceeded the limit of 1.0 mg/L-1. The spatial distribution of high fluoride concentrations was found to be primarily determined by industry. The hazard quotient (HQ) index for children, teenagers and adults indicated that 19.6%, 15.6%, and 5.1% of the samples in the upper reaches of the Yongding River, respectively, posed health hazards to the associated groups. Furthermore, the HQ index more than 1 for children, teenagers and adults had values of 64.3%, 56.1%, and 19.4%, respectively, in samples from the downstream region of the Yanghe River. Therefore, there are potential risks of dental and skeletal fluorosis in the upper river reaches of the Yongding River. It is imperative to take measures to reduce the fluoride pollution in surface water and control fluorosis. Action should be taken to improve the disposal of industrial waste.
Jun. 25, 2020Vol. 30 Issue 6 908 (2020)
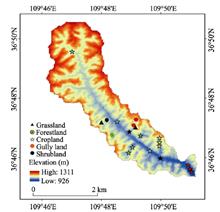
Xia YU, Weijian ZHOU, Yunqiang WANG, Peng CHENG, Yaoyao HOU, Xiaohu XIONG, Hua DU, Ling YANG, and Ya WANG
The vertical distribution and exchange mechanisms of soil organic and inorganic carbon (SOC, SIC) play an important role in assessing carbon (C) cycling and budgets. However, the impact of land use through time for deep soil C (below 100 cm) is not well known. To investigate deep C storage under different land uses and evaluate how it changes with time, we collected soil samples to a depth of 500 cm in a soil profile in the Gutun watershed on the Chinese Loess Plateau (CLP); and determined SOC, SIC, and bulk density. The magnitude of SOC stocks in the 0-500 cm depth range fell into the following ranking: shrubland (17.2 kg m-2) > grassland (16.3 kg m-2) > forestland (15.2 kg m-2) > cropland (14.1 kg m-2) > gully land (6.4 kg m-2). The ranking for SIC stocks were: grassland (104.1 kg m-2) > forestland (96.2 kg m-2) > shrubland (90.6 kg m-2) > cropland (82.4 kg m-2) > gully land (50.3 kg m-2). Respective SOC and SIC stocks were at least 1.6- and 2.1-fold higher within the 100-500 cm depth range, as compared to the 0-100 cm depth range. Overall SOC and SIC stocks decreased significantly from the 5th to the 15th year of cultivation in croplands, and generally increased up to the 70th year. Both SOC and SIC stocks showed a turning point at 15 years cultivation, which should be considered when evaluating soil C sequestration. Estimates of C stocks greatly depends on soil sampling depth, and understanding the influences of land use and time will improve soil productivity and conservation in regions with deep soils.
Jun. 25, 2020Vol. 30 Issue 6 921 (2020)
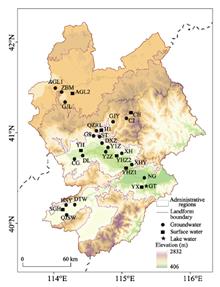
Qinghua ZHANG, Zhuanxi LUO, Wen LU, Zepp HARALD, Yufeng ZHAO, and Jialiang TANG
Despite the increasing depletion of the groundwater at the Zhangjiakou aquifer system in the northwest of Beijing-Tianjin-Hebei region, little information is available on the hydrological process of groundwater in this region. In this study, we utilized water isotopes composition (δ18O, δD and3H) of groundwater, river and precipitation to identify the characteristics of hydrochemistry, groundwater age and recharge rates in different watersheds of the Zhangjiakou area. Results showed that the river water and groundwater could be characterized as HCO3-Mg·Na, HCO3·Cl-Na and HCO3-Mg·Na, HCO3·Cl-Na, HCO3·Cl-Na·Mg types, respectively. The δD and δ18O values in precipitation were linearly correlated, which is similar to the Global Meteorological Water Line (GMWL). Furthermore, the decreasing values of the δD and δ18O from precipitation to surface water and groundwater indicate that groundwater is mainly recharged by atmospheric precipitation. In addition, the variation of3H concentration with depth suggests that groundwater shallower than around 100 m is generally modern water. In contrast, groundwater deeper around 100 m is a mixture of modern and old waters, which has longer residence times. Groundwater showed a relatively low tritium concentration in the confined aquifers, indicating the groundwater recharged might be relatively old groundwater of over 60 years. The flow velocity of the groundwater in the study area varied from 1.10 to 2.26 m/a, and the recharge rates ranged from 0.034 to 0.203 m/a. The obtained findings provide important insights into understanding the groundwater recharge sources and hydrochemistry in the Zhangjiakou area, in turn developing a sustainable groundwater management plan.
Jun. 25, 2020Vol. 30 Issue 6 935 (2020)
Muxing LIU, Qiuyue WANG, Li GUO, Jun YI, Henry LIN, Qing ZHU, Bihang FAN, and Hailin ZHANG
Rainfall provides essential water resource for vegetation growth and acts as driving force for hydrologic process, bedrock weathering and nutrient cycle in the steep hilly catchment. But the effects of rainfall features, vegetation types, topography, and also their interactions on soil water movement and soil moisture dynamics are inadequately quantified. During the coupled wet and dry periods of the year 2018 to 2019, time-series soil moisture was monitored with 5-min interval resolution in a hilly catchment of the Three Gorges Reservoir Area in China. Three hillslopes covered with evergreen forest (EG), secondary deciduous forest mixed with shrubs (SDFS) and deforested pasture (DP) were selected, and two monitoring sites with five detected depths were established at upslope and downslope position, respectively. Several parameters expressing soil moisture response to rainfall event were evaluated, including wetting depth, cumulative rainfall amount and lag time before initial response, maximum increase of soil water storage, and transform ratio of rainwater to soil water. The results indicated that rainfall amount is the dominant rainfall variable controlling soil moisture response to rainfall event. No soil moisture response occurred when rainfall amounts was 30 mm. In the wet period, the cumulative rainfall amount to trigger surface soil moisture response in EG-up site was significantly higher than in other five sites. However, no significant difference in cumulative rainfall amount to trigger soil moisture response was observed among all study sites in dry period. Vegetation canopy interception reduced the transform ratio of rainwater to soil water, with a higher reduction in vegetation growth period than in other period. Also, interception of vegetation canopy resulted in a larger accumulated rainfall amount and a longer lag time for initiating soil moisture response to rainfall. Generally, average cumulative rainfall amount for initiating soil moisture response during dry period of all sites (3.5-5.6 mm) were less than during wet period (5.7-19.7 mm). Forests captured more infiltration water compared with deforested pasture, showing the larger increments of both soil water storage for the whole soil profile and volumetric soil water content at 10 cm depth on two forest slopes. Topography dominated soil subsurface flow, proven by the evidences that less rainfall amount and less time was needed to trigger soil moisture response and also larger accumulated soil water storage increment in downslope site than in corresponding upslope site during heavy rainfall events.
Jun. 25, 2020Vol. 30 Issue 6 949 (2020)

Yili ZHANG, Xue WU, and Du ZHENG
Characterized by obvious altitudinal variation, habitat complexity, and diversity in land cover, the Mt. Qomolangma region within the central Himalayas is one of the most sensitive areas to climate change in the world. At the same time, because the Mt. Qomolangma region possesses the most complete natural vertical spectrum in the world, it is also an ideal place to study the vertical structure of alpine land cover. In this study, land cover data for 2010 along with digital elevation model data were used to define three methods for dividing the northern and southern slopes in the Mt. Qomolangma region, i.e., the ridgeline method, the sample transect method, and the sector method. The altitudinal distributions of different land cover types were then investigated for both the northern and southern slopes of the Mt. Qomolangma region by using the above three division methods along with ArcGIS and MATLAB tools. The results indicate that the land cover in the study region was characterized by obviously vertical zonation with the south-six and north-four pattern of vertical spectrum that reflected both the natural vertical structure of vegetation and the effects of human activities. From low to high elevation, the main land cover types were forests, grasslands, sparse vegetation, bare land, and glacier/snow cover. The compositions and distributions of land cover types differed significantly between the northern and southern slopes; the southern slope exhibited more complex land cover distributions with wider elevation ranges than the northern slope. The area proportion of each land cover type also varied with elevation. Accordingly, the vertical distribution patterns of different land cover types on the southern and northern slopes could be divided into four categories, with glaciers/snow cover, sparse vegetation, and grasslands conforming to unimodal distributions. The distribution of bare land followed a unimodal pattern on the southern slope but a bimodal pattern on the northern slope. Finally, the use of different slope division methods produced similar vertical belt structures on the southern slope but different ones on the northern slope. Among the three division methods, the sector method was better to reflect the natural distribution pattern of land cover.
Jun. 25, 2020Vol. 30 Issue 6 969 (2020)
Guining ZHAO, Zhengyong ZHANG, Lin LIU, Zhongqin LI, Puyu WANG, and Liping XU
The glacier mass balance (GMB) is an important link between climate and water resources and has remarkable regulatory functions in river runoff. To simulate changes of the GMB and to analyze the recharge rates of glacier meltwater to runoff in the Manas River Basin (MRB) during 2000-2016, MOD11C3, TRMM 3B43 and other multi-source remote sensing data were used to drive the degree-day model. The results showed that: (1) the accuracy of the remote sensing meteorological data can be corrected effectively by constructing the temperature and precipitation inversion models, and the characteristics of glacial climate can be finely described through downscaling. The average annual temperature was -7.57 °C and the annual precipitation was 410.71 mm in the glacier area of the MRB. The zone at an altitude of about 4200 m was a severe climate change zone, and above and below that zone, the temperature drop rates were -0.03°C/100 m and -0.57°C/100 m, respectively, while precipitation gradients were -2.66 mm/100 m and 4.89 mm/100 m, respectively. (2) The overall GMB was negative with a cumulative GMB of up to -9811.19 mm w.e. and the average annual GMB fluctuated between -464.85 and -632.19 mm w.e. Besides, the glacier melted slowly during 2000-2002 and 2008-2010, but rapidly for 2002-2008 and 2010-2016, while the most serious loss of the glacier occurred in 2005-2009. Moreover, the vertical changes of the GMB increased at 244.83 mm w.e./100 m in the ablation zone but only at 18.77 mm w.e./100 m in the accumulation zone. (3) The intraannual runoff strongly responded to the change of the GMB especially in July and August when the loss of the GMB accounted for 75.4% of the annual loss, and when runoff accounted for 55.1% of the annual total. Due to differences in the annual precipitation and snow meltwater outside the glacier, the interannual glacier meltwater recharge rates fluctuated between 19% and 31%. The recharge rate of glacier meltwater to runoff in the MRB was close to that for other basins in the Tianshan Mountains, which may be used as a basis to confirm the reliability of the estimated GMB results. Furthermore, based on the present findings, it is recommended that the research community pursue studies on the GMB in other alpine river basins.
Jun. 25, 2020Vol. 30 Issue 6 988 (2020)
Erfu DAI, and Yahui WANG
Ecosystem services, which include water yield services, have been incorporated into decision processes of regional land use planning and sustainable development. Spatial pattern characteristics and identification of factors that influence water yield are the basis for decision making. However, there are limited studies on the driving mechanisms that affect the spatial heterogeneity of ecosystem services. In this study, we used the Hengduan Mountain region in southwest China, with obvious spatial heterogeneity, as the research site. The water yield module in the InVEST software was used to simulate the spatial distribution of water yield. Also, quantitative attribution analysis was conducted for various geomorphological and climatic zones in the Hengduan Mountain region by using the geographical detector method. Influencing factors, such as climate, topography, soil, vegetation type, and land use type and pattern, were taken into consideration for this analysis. Four key findings were obtained. First, water yield spatial heterogeneity is influenced most by climate-related factors, where precipitation and evapotranspiration are the dominant factors. Second, the relative importance of each impact factor to the water yield heterogeneity differs significantly by geomorphological and climatic zones. In flat areas, the influence of evapotranspiration is higher than that of precipitation. As relief increases, the importance of precipitation increases and eventually, it becomes the most influential factor. Evapotranspiration is the most influential factor in a plateau climate zone, while in the mid-subtropical zone, precipitation is the main controlling factor. Third, land use type is also an important driving force in flat areas. Thus, more attention should be paid to urbanization and land use planning, which involves land use changes, to mitigate the impact on water yield spatial pattern. The fourth finding was that a risk detector showed that Primarosol and Anthropogenic soil areas, shrub areas, and areas with slope <5° and 25°-35° should be recognized as water yield important zones, while the corresponding elevation values are different among different geomorphological and climatic zones. Therefore, the spatial heterogeneity and influencing factors in different zones should be fully considered while planning the maintenance and protection of water yield services in the Hengduan Mountain region.
Jun. 25, 2020Vol. 30 Issue 6 1005 (2020)
Huan JING, Deyu ZHONG, Hongwu ZHANG, Xufang SHI, and Yanjun WANG
Accumulation occurs widely in fluvial processes. Accurately accounting for the effects of previous water and sediment conditions on accumulation is essential for studying riverbed evolution. In this study, to reveal the physical mechanisms of accumulation, various geometric observations of both the upstream and downstream reaches of dams on several typical fluvial channels were analyzed. The changes in water and sediment conditions were defined as external disturbances. Assuming that the probability of an external disturbance conforms to a Poisson distribution, and that the response intensity induced by an individual disturbance decays exponentially over time, a mathematical description of the accumulation of internal responses to external disturbances is given. Furthermore, a corresponding theoretical model for simulating the spatiotemporal readjustments of characteristic river variables is proposed based on stochastic theory. The proposed models are then applied to investigate spatiotemporal readjustment in the upper and lower reaches of dams following their construction. The results indicate that temporally, the vertical, lateral, and overall readjustment rates of the reaches are relatively fast in the early period following dam construction but then decrease rapidly over time. Accumulated riverbed degradation, channel width, and sedimentation continuously increase until a new dynamic equilibrium is reached. These phenomena reflect the representative accumulation characteristics of fluvial processes. Spatially, the erosion intensities in downstream reaches decrease nonlinearly along the channel until eventually diminishing. The unbalanced spatial distribution of erosion intensity arises from the system response characterized by propagation in space but decay over time, which is characteristic of accumulation phenomena after disturbances. The results of the developed model show that the spatiotemporal readjustments of the studied cross-sections and channel reaches can be accurately described by the unified theoretical formula derived herein. The model predictions show good agreement with observed field data with determination coefficients of 0.92, 0.93, 0.76, and 0.95 for vertical, lateral, longitudinal, and overall readjustments, respectively. The proposed theoretical models account for both the accumulation characteristics of fluvial processes and their spatial distributions. In demonstrating the proposed approach, this study provides a theoretical basis and new calculation method for quantitatively describing the spatiotemporal readjustments of non-equilibrium fluvial channels following external disturbances.
Jun. 25, 2020Vol. 30 Issue 6 1021 (2020)
© Copyright 2018-2021 | Chinese Laser Press.
All Rights Reserved 沪ICP备15018463号-20