


 View fulltext

2020
Volume: 30 Issue 4
10 Article(s)

Jing LUO, Siyun CHEN, Xuan SUN, Yuanyuan ZHU, Juxin ZENG, and Guangping CHEN
Based on statistical data and population flow data for 2016, and using entropy weight TOPSIS and the obstacle degree model, the centrality of cities in the Yangtze River Economic Belt (YREB) together with the factors influencing centrality were measured. In addition, data for the population flow were used to analyze the relationships between cities and to verify centrality. The results showed that: (1) The pattern of centrality conforms closely to the pole-axis theory and the central geography theory. Two axes, corresponding to the Yangtze River and the Shanghai-Kunming railway line, interconnect cities of different classes. On the whole, the downstream cities have higher centrality, well-defined gradients and better development of city infrastructure compared with cities in the middle and upper reaches. (2) The economic scale and size of the population play a fundamental role in the centrality of cities, and other factors reflect differences due to different city classes. For most of the coastal cities or the capital cities in the central and western regions, factors that require long-term development such as industrial facilities, consumption, research and education provide the main competitive advantages. For cities that are lagging behind in development, transportation facilities, construction of infrastructure and fixed asset investment have become the main methods to achieve development and enhance competitiveness. (3) The mobility of city populations has a significant correlation with the centrality score, the correlation coefficients for the relationships between population mobility and centrality are all greater than 0.86 (P<0.01). The population flow is mainly between high-class cities, or high-class and low-class cities, reflecting the high centrality and huge radiating effects of high-class cities. Furthermore, the cities in the YREB are closely linked to Guangdong and Beijing, reflecting the dominant economic status of Guangdong with its geographical proximity to the YREB and Beijing’s enormous influence as the national political and cultural center, respectively.
Apr. 25, 2020Vol. 30 Issue 4 515 (2020)
Xiang LUO, Xinhe AO, Zuo ZHANG, Qing WAN, and Xingjian LIU
In this study, the carbon emissions (CEs) from cultivated land (CL) were included as an undesirable output in the utilization efficiency of such land. A slack-based model was used to calculate the CL use efficiency (CLUE) for 11 provinces and cities in the Yangtze River Economic Belt (YREB) from 2007 to 2016, and then a kernel density estimation map was drawn to analyze the spatiotemporal variations of CLUE. The Tobit model was also employed to analyze the factors affecting the CLUE. The results show the following. 1) In the YREB, the CEs from CL showed a rising and then a slowly decreasing trend. In this paper, we calculate CEs by carbon emission factors and major carbon sources, and the CEs from CL in the YREB totaled 25.2354 million tons in 2007. By 2014, the value had increased gradually to 28.4400 million tons, and by 2016 it had declined to 27.8922 million tons, suggesting that the carbon-emission reduction measures of the government had an impact. 2) The CLUE of various provinces and cities in the YREB showed an upward trend in the time dimension, while for the spatial dimension, the kernel density was high in the east and low in the west, and the areas with high kernel density were mainly located in the Yangtze River Delta. 3) The per capita gross domestic product, the primary industrial output, and the number of agricultural technicians per 10,000 people had positive effects on the CLUE. The CL area per capita and the electrical power per hectare for agricultural machinery had significant negative impacts on CLUE. In addition, every 1% increase in the number of agricultural technicians increased the CLUE by 0.057%.
Apr. 25, 2020Vol. 30 Issue 4 535 (2020)
Liang ZHENG, Hai LIU, Yuefei HUANG, Shoujing YIN, and Gui JIN
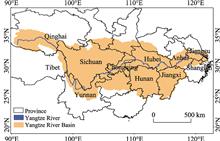
The Yangtze River is the third largest river in the world and the longest and largest river in China. China has adopted a national strategy to protect the Yangtze River. A better understanding of the ecosystem services value along the Yangtze River would provide support for the Yangtze River protection strategy. Using Costanza’s method to estimate the ecosystem services value, the value of 10 ecosystem services was estimated within 1 km and 2 km from the Yangtze River in 2017. These 10 services were derived from the four established groupings of provisioning, regulating, supporting, and cultural services. This study compared and analyzed the changes in the ecosystem services value in the upper, middle, and lower reaches of the river, and in provinces, cities, and villages along the Yangtze River. The total ecosystem services value within 1 km and 2 km from the river was 37.208 and 43.769 billion yuan, respectively. Within 1 km, the ecosystem services value in the middle reaches was 12.93 billion yuan, while the next highest value was in the upper reaches at 12.45 billion yuan, and the downstream area had the smallest value of 11.855 billion yuan. Within 2 km, the value of upstream ecosystem services was the highest at 16.31 billion yuan, while the second highest value was in the middle reaches at 14.376 billion yuan, and the smallest value was in the downstream area at 13.083 billion yuan. In the Yangtze River Basin, regulating services played a leading role, accounting for 81.6% and 78.9% of the ecosystem services value within 1 km and 2 km from the river, respectively. Among the 10 ecosystem services, hydrological regulation was the most important, while the value of raw material production made the smallest contribution. Among the provinces and cities along the Yangtze River, the highest ecosystem services value was in Hubei Province, while the lowest values were in Shanghai and the Qinghai-Tibet Plateau. If villages within 1 km and 2 km from the river were to be relocated, the total regional ecological value would increase by 527 and 975 million yuan, respectively.
Apr. 25, 2020Vol. 30 Issue 4 553 (2020)
Gui JIN, Xin SHI, Dawei HE, Baishu GUO, Zhaohua LI, and Xianbin SHI
Patterns of spatial development and protection form a basic category of geoscience, and redesigning them is a popular subject of research in regional sustainable development that is important for ecological civilization construction. The authors here report a case study of Wuhan city using the circuit theory model and minimum cumulative resistance (MCR) model to rebalance its spatial protection and development. The results show the following: (1) Using the density of the gross domestic product (GDP), density of population, rate of urbanization, and access to transportation as evaluation indicators, seven core areas of development in Wuhan were identified, accounting for 59% of the total number of streets, that exhibited a “circular-satellite” spatial structure. (2) According to the importance of ecosystem services, ecological sensitivity, land use type, and slope of the terrain, the resistance surface of spatial development in Wuhan had a stereoscopic spatial form of an “inverted pyramid,” with high surroundings and a low center. The area of low resistance accounted for 6.64% of the total area of Wuhan. (3) Based on coupling analysis using the MCR and spatial morphological characteristics of current, nine axes of spatial development with a total area of 427.27 km2 and eight key strategic points with a total area of 40.02 km2 were identified. Streets that were prioritized for development accounted for 9.63% of Wuhan’s total area. (4) By combining the characterization of the development axis with the structure of the three-level core area, we extracted the structure of spatial development of “one heart, two wings, and three belts” in Wuhan. The research framework and empirical results can provide scientific guidance for the urban spatial layout, the development of regional linkages, and ecological environmental protection in China.
Apr. 25, 2020Vol. 30 Issue 4 569 (2020)
Kunlun CHEN, Xiaoqiong LIU, Xi CHEN, Yuqi GUO, and Yin DONG
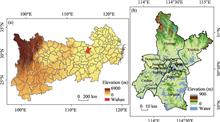
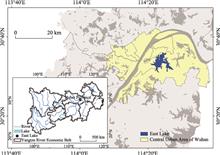
The shapes of the urban lakes in Wuhan city have been strongly influenced by the rapid industrialization and urbanization experienced in recent decades. Based on topographic maps and remote sensing images, the temporal and spatial changes of East Lake, Wuhan city, over the past two decades were analyzed. The landscape shape index (LSI) and centroid method were applied to analyze the evolution of lake morphology and its causes. Several key results were obtained. (1) The surface area of East Lake decreased sharply by 2.13 km 2 from 1995 to 2005, and slightly by 1.00 km 2 from 2005 to 2015. The shoreline length of East Lake displayed a continuous trend of decline during the study period: The length reduced by 21.89 km from 1995 to 2005, and by 0.67 km from 2005 to 2015. The LSI values, 7.04 (1995), 6.46 (2005), and 6.28 (2015), displayed an accelerated downward trend, indicating a reduction of complexity in East Lake and the intensification of manual interventions in the water body. (2) The changes to East Lake displayed a clear temporal and spatial heterogeneity. The centroid of East Lake moved northeast from 1995 to 2005 and southeast from 2005 to 2015. (3) The reduction in the area of East Lake was mainly affected by human activities. A lake area of about 4.8 km 2 was converted to other land uses during 1995-2005, most of which was unused land, whereas from 2005 to 2015, 0.43 km 2 of the lake area was converted into built-up land, and 0.25 km 2 was converted into other land uses. The reduction in area was caused by infrastructure construction by the government, the development of the real estate industry, illegal construction by villagers, and the development of scenic spots for tourism. The driving forces of this reduction included Wuhan’s growing population, and the rapid development of the economy and urbanization between 1995 and 2015, which has resulted in a large demand for land. Finally, a formation mechanism model was constructed by analyzing the causes of East Lake’s morphological evolution.
Apr. 25, 2020Vol. 30 Issue 4 583 (2020)
Xueru ZHANG, Jie ZHOU, Guoning LI, Chun CHEN, Mengmei LI, and Jianmei LUO
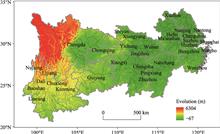
Reconstruction of the spatial pattern of regional habitat quality can revivify the ecological environment background at certain historical periods and provide scientific support for revealing the evolution of regional ecological environmental quality. In this study, we selected 10 driving factors of land use changes, including elevation, slope, aspect, GDP, population, temperature, precipitation, river distance, urban distance, and coastline distance, to construct the CA-Markov model parameters and acquired the land use spatial data for 1975, 1980, 1985, 1990, and 1995 by simulation based on the land use status map for 2010. On this basis, we used the InVEST model to reconstruct the spatial pattern of habitat quality in the study area and conducted classification division and statistical analysis on the computed habitat degradation degree index and the habitat quality index. (1) The results showed that from 1975 to 2010, the habitat degradation degree gradually increased, and the habitat degradation grade spatially presented a layered progressive distribution. Habitat quality presented a constantly decreasing trend. The high-value zones were mainly distributed in the mountainous areas, while the low-value zones were mostly located in built-up areas. During the period of 1975-2010, low-value zones gradually expanded to their surrounding high-value zones, and the high-value zones of habitat quality tended to be fragmented. (2) The spatial-temporal variation characteristics of habitat quality from 1975 to 2010 showed that the regions with low habitat quality were difficult to be restored and mostly maintained their original state; the regions with poor habitat quality, which accounted for 6.40% of the total study area, continued to deteriorate, mainly around built-up areas; the regions with good and superior habitat quality, which accounted for 5.68% of the total study area, were easily converted to regions with bad or poor habitat quality, thus leading to the fragmentation of the regional habitat. (3) From 1975 to 2010, land use changes in the study area were significant and had a huge influence on habitat quality; the habitat quality in the study area decreased consistently, and the area of the regions with bad and poor habitat quality accounted for more than 60% of the total study area. Construction land was the largest factor threatening habitat quality.
Apr. 25, 2020Vol. 30 Issue 4 601 (2020)

Wenjie YANG, Qianwen GONG, and Xueyan ZHANG
The calculation of ecological compensation and boundary identification of stakeholders represent the key challenges for Beijing-Tianjin-Hebei Region in its implementation of the trans-regional ecological compensation mechanism. Breaking administrative boundaries and spatially coordinating ecological resources helps to restructure an ecological compensation mechanism of the region based on the coordinated development of Beijing, Tianjin and Hebei. According to the estimated ecological assets in the counties of the region in 2000, 2005, 2010 and 2015, a quantitative model for total ecological compensation was built based on ecological assets and county-level economic development. Then, the spatiotemporal distribution characteristics of the total ecological compensation in the region were defined, and the boundaries of ecological surplus and deficit areas were identified. Results indicate: (1) The region’s annual average ecological assets amounted to ¥1379.47 billion; in terms of annual total ecological assets, Hebei ranked first (¥1123.80 billion), followed by Beijing (¥157.46 billion) and Tianjin (¥98.21 billion); and in terms of ecological assets per unit area, Beijing ranked first, Tianjin second and Hebei last. (2) Among ecosystem services, hydrological regulation and climate regulation had the highest annual average value and contributed most to the increase in ecological assets. In 2015, the contribution of water and soil conservation to the total ecological assets decreased to -15.66%, showing the degradation of the function played by different ecosystems. (3) The ecological surplus of the region in four periods of 2000, 2005, 2010 and 2015 were ¥398.98 billion, ¥870.37 billion, ¥1254.93 billion and ¥2693.94 billion respectively, basically offsetting the ecological deficit of each corresponding period, but the urgency for ecological compensation was increased. (4) The ecological surplus and deficit areas showed a great fluctuation in different time periods. Larger time span means more noticeable convergence of deficit areas towards central and eastern areas. Public resources such as education, transportation and medical care in central urban areas should be decentralized to encourage population dispersal, weaken the agglomeration effect of deficit areas and finally achieve the ecological synergy of the region.
Apr. 25, 2020Vol. 30 Issue 4 621 (2020)
Fang ZHAO, Junjie LIU, Wenbo ZHU, Baiping ZHANG, and Lianqi ZHU
To determine the dividing index between warm temperate and subtropical zones based on the spectra of altitudinal belts, this paper collected 33 spectra of altitudinal belts in the Qinling-Daba Mountains from published literatures and then analyzed the structures and the spatial patterns from south to north, from west to east and based on exposure directions. The results show that: 1) From south to north, the basal belt gradually changes from subtropical evergreen broadleaf forest to warm temperate deciduous broadleaf forest; the spectra of altitudinal belts change from complex to simple; the dominant belt changes from montane broadleaf-conifer mixed forest and evergreen-deciduous broadleaf mixed forest to deciduous broadleaf forest. 2) From west to east, the structures of the altitudinal belt spectra show complexity in the east and west but simplicity in the middle section; the upper limits of both the evergreen-deciduous broadleaf mixed forest belt and montane deciduous broadleaf forest belt present a quadratic curve distribution pattern in the longitudinal direction. However, the upper limit of the montane broadleaf-conifer mixed forest belt exhibits a nearly linear decrease in the west-east direction. 3) Both the north and south slopes in the Qinling Mountains have the similar basal belt, whereas it varies greatly between the north and south slopes in the Daba Mountains. Comparably, dominant belts are very similar in the Qinling Mountains and the north slope of the Daba Mountains, but the south slope of the Daba Mountains has its own unique dominant belt: evergreen-deciduous broadleaf mixed forest. This implies that the Daba Mountains are more appropriate than the Qinling Mountains to act as the boundary between subtropical and warm-temperate zones in central China.
Apr. 25, 2020Vol. 30 Issue 4 642 (2020)
Ting ZHAO, Hongying BAI, Yuan YUAN, Chenhui DENG, Guizeng QI, and Danping ZHAI
Based on air temperature observation data from 32 meteorological stations, temperature changes in the middle Qinling Mountains from 1959 to 2016 were analysed with respect to the north-south, seasonal and altitude differences. Our research mainly showed the following results. The annual temperature (TA) rose approximately 0.26℃/10a within the past 58 years. This warming trend was stronger on the northern slope than on the southern slope, and a warming trend reversal occurred in 1994 on the northern slope, which was three years earlier than on the southern slope. The temperature changes for the four seasons were not synchronized, and the trend in spring contributed the most to the TA trend, followed by winter, autumn, and summer. The temperature difference between summer and winter (TDSW) decreased significantly over the past 58 years. The temperature change in the middle Qinling Mountains was clearly dependent on altitude. With increases in altitude, the TA increased gradually and became stronger while the TDSW decreased gradually and became weaker. Differences in temperature change between the north and south were mainly observed in low-altitude areas. With increase in altitude, the differences gradually tended to disappear.
Apr. 25, 2020Vol. 30 Issue 4 657 (2020)
Xiaoqing SONG, Mengmeng WEN, Yajing SHEN, Qi FENG, Jingwei XIANG, Weina ZHANG, Guosong ZHAO, and Zhifeng WU
Urban growth and shrinkage constitute the overall pattern of growing urbanization across the globe. Studies on urban vacant land (UVL) are few, and have proved to be mainly rudimentary and subjective. This paper first presents the definition of UVL based on bibliometric analysis. Typology, morphology, proximate causes, and the multiple functions of UVL are then analyzed at parcel, transect, city, and national levels based on an international review. Results show that UVL can be categorized by land cover, land usage, and land ownership. Worldwide, UVL has been widespread and extensive. For example, the occurrence probabilities of UVL in the cases of Guangzhou and New York are 8.46%-8.88% and 3.17%-5.08%, respectively. The average vacancy rate of residential land amounts to 11.48% in 65 U.S. cities. Generally, UVL shows fragmentation and irregular shape, and significant spatial differences exist at parcel, transect, city, and national levels. Proximate causes, such as excessive land division, irregularly shaped land parcels, decreases in resident population, deindustrialization, land speculation, insufficient investment, and environmental concerns, can all result in UVL. Currently, UVL has become a gray area of social, economic, and ecological space. However, it can also be considered a potential resource for enhancing urban sustainability. Policy implications to promote urban sustainability using monitoring, control, and differential revitalization of UVL are presented.
Apr. 25, 2020Vol. 30 Issue 4 669 (2020)
© Copyright 2018-2021 | Chinese Laser Press.
All Rights Reserved 沪ICP备15018463号-20