
I. Tazes, S. Passalidis, E. Kaselouris, I. Fitilis, M. Bakarezos, N. A. Papadogiannis, M. Tatarakis, V. Dimitriou. A computational study on the optical shaping of gas targets via blast wave collisions for magnetic vortex acceleration[J]. High Power Laser Science and Engineering, 2022, 10(5): 05000e31
- High Power Laser Science and Engineering
- Vol. 10, Issue 5, 05000e31 (2022)
Abstract
1 Introduction
Laser-induced particle acceleration has attracted a great deal of interest in the scientific community due to its numerous potential applications in inertial confinement fusion (ICF), and specifically the proton driven fast ignition scheme[1,2] and hadron therapy[3,4], as well as due to the fundamental physics involved. At the beginning of the new millennium, up to 18 MeV protons were measured[5,6], while protons of hundreds of MeV are produced in the target normal sheath acceleration (TNSA) and radiation pressure acceleration (RPA) regimes[7,8]. In TNSA and RPA, the solid targets are destroyed upon irradiation and need to be replaced and repositioned after each laser shot, which does not allow for their use in high repetition rate proton sources. Gas targets are considered a promising alternative that supports high repetition rates and almost debris-free proton sources[9,10]. The use of gas targets, as sources for proton acceleration, is still challenging since extremely high densities in the near-critical density regime are demanded. In the near-critical density regime the dominant acceleration mechanisms are magnetic vortex acceleration (MVA)[11], collisionless shock acceleration (CSA)[12] and Coulomb explosion (CE) from atomic clusters[13,14], where the generated 10–20 MeV per nucleon energetic ions achieved a 10-fold energy increase compared to experiments with solid targets.
Protons and ions have been experimentally accelerated in the near-critical density regime up to 20 MeV[15–18] per nucleon by high energy, ns pulse duration, CO2 lasers. These lasers may access the near-critical density regime at lower densities due to their longer wavelengths (critical density ncr ≈ 1019 cm−3, λ = 10 μm), although they are characterized by low intensities and low repetition rates. State-of-the-art simulations result in hundreds of MeV up to 1 GeV of protons accelerated in near-critical density plasmas via MVA, by super-intense fs laser pulses[19–26]. To the best of our knowledge, experimental verification of ion acceleration in the MVA regime with typical fs laser wavelengths does not exist to date. This is because extremely dense and sharp plasma profiles are necessary, as implied by simulations[11,19,20].
In this paper we study the plasma density profile optical shaping of a long density scale length, high-pressure, gas-jet via multiple hydrodynamic, Sedov-type blast waves (BWs) to generate near-critical, steep density gradient, gas target profiles, optimized for proton acceleration[17,18,27–29]. The generation and evolution of the BWs are simulated by the 3D magnetohydrodynamic (MHD) code, FLASH[30]. A nanosecond Nd:YAG laser pulse of 835 mJ energy shapes the BWs and ZEUS, a 45 TW, 23 fs, 1.1 J energy Ti:sapphire laser, delivers the interaction pulse on the target for proton acceleration. The profile tailoring is performed by the optical shaping of one to four simultaneous Sedov BWs, generated by parallel or by intersecting laser pulses in different geometric variations. The laser and gas-jet parameters adopted in our study are based on the experimental infrastructure of the Institute of Plasma Physics and Lasers (IPPL) to explore and optimize the design of our experimental campaign on MVA. Our findings suggest that with the use of four BWs in association with certain geometrical variations for delivering the nanosecond laser pulses into the gas target, the desirable target profile may be optically shaped. It should be noted here that the combinations of the alternative angular layouts, in the case of using intersecting laser pulses, are countless. Therefore, the angle of 60o is adopted in the test cases where two and three intersecting ns laser pulses are set in plane, at the parametrically determined optimal position, as explained in Section 2. Even though the highest compression of the gas target may be delivered by the collision of many BWs, alternative layouts of low numbers of BWs exhibit target characteristics that are favourable for the proton acceleration experiments of our interest. Furthermore, the experimental setup to be developed for the generation of more than four BWs cannot be considered feasible. Therefore, our research work is focused on the investigation of the optimal optically shaped profile by up to four BWs based on alternative geometrical layouts. The efficiency of the ZEUS laser as an MVA proton accelerator is demonstrated by particle-in-cell (PIC) simulations using the 45 TW pulse.
Sign up for High Power Laser Science and Engineering TOC. Get the latest issue of High Power Laser Science and Engineering delivered right to you!Sign up now
2 Blast wave simulations
2.1 Physical and numerical modelling
The modular, parallel, multiphysics simulation code FLASH is used to model the BWs in H gas-jet targets. The evolution of a BW can be considered as a point source explosion and is described by a Sedov self-similar approximation. Thus, the time-dependent velocity of a BW is given by the following:
For the generation of the BWs, a 1064 nm wavelength, 835 mJ energy laser pulse of 6 ns duration at the 1/e of the maximum intensity, with a Gaussian spatial profile and a trapezoidal temporal profile ramping from 29 to 195 MW focused down to a focal spot of 10 μm diameter is used. This pulse delivers intensities up to 8.5 × 10¹³ W cm–2, with a Rayleigh length of 295 μm. A 100 mm focusing lens is used for the tight focusing, while a variety of focal spots with diameters ranging from 10 to 60 μm are tested. As shown in Figure 1(a), the laser pulse is focused on various longitudinal distances from the centre of the gas-jet ranging between 100 and 150 μm. The pulse is split to generate up to four sub pulses for the generation of up to four simultaneous BWs. The developed model includes ray tracing, while each pulse is simulated by 20 × 103 rays. The model includes the opacity tabulated equation-of-state (EOS) IONMIX4, defined over a temperature-density grid, to calculate the absorption, the emission and the transmission of the laser pulse throughout the H gas target.
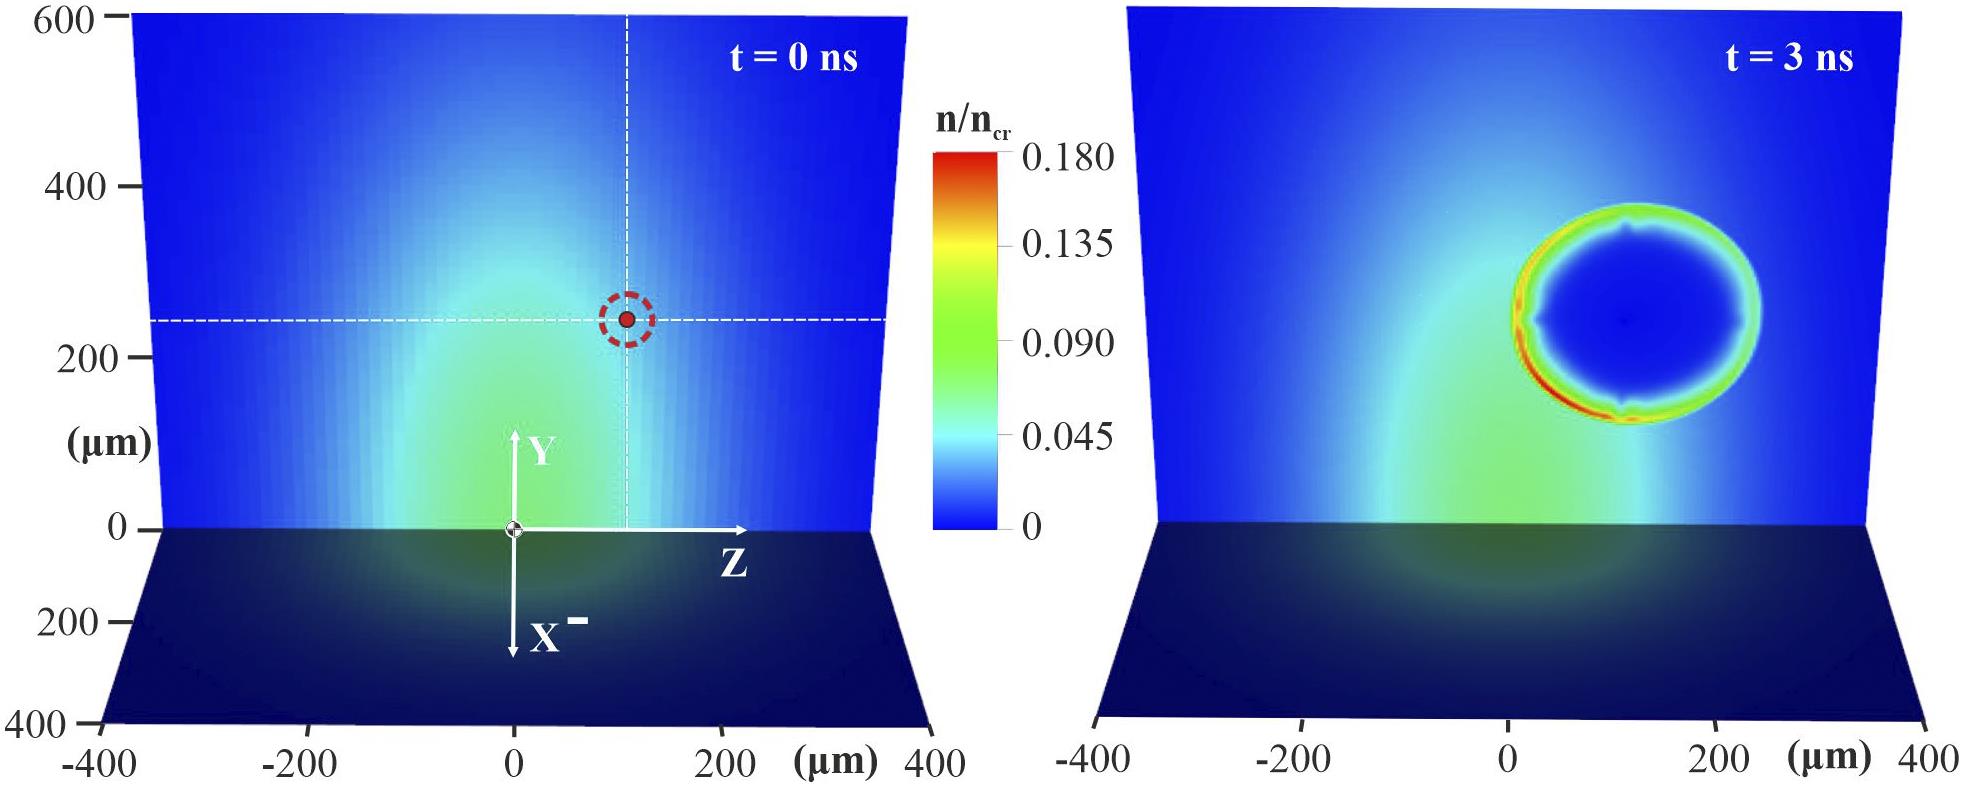
Figure 1.The H density distribution of a single BW at
The atomic hydrogen gas (H) is described by the H EOS. The laser intensity delivered to the target has a minimum value of 1.25 × 10¹³ W cm–2. Thus, a molecular hydrogen gas (H2) would be dissociated to H extremely quickly due to its low dissociation energy of 4.52 eV per bond at 298 K[31]. H2 molecules are ionized in fs time scales and the remaining positive nuclei are separated via CEs. Therefore, in our study, a H2 gas interacting with an intense laser pulse is described by the atomic H EOS having a specific heat ratio γ = 5/3. The gas density is modelled as a 3D Gaussian profile with
The simulation run time is monitored and ranges from 5 to 10 ns having an initial time step of 0.1 fs and a Courant–Friedrichs–Lewy (CFL) number equal to 0.4. The 3D computational domain has a size of XYZ = 800 μm × 600 μm × 800 μm. Each side of the domain is divided into 16 cells upon initialization. The adaptive mesh refinement (AMR), which is set to a minimum level of 3 (64 cells) with a maximum level of 5 (512 cells), is applied at the initial timestep and results in a final cell size of 1.56 μm × 1.17 μm × 1.56 μm. The hydro and conductivity boundary conditions are set to ‘outflow’ (zero-gradient boundary conditions), allowing shocks to propagate freely out of the domain boundaries. The hybrid Riemann hydrodynamic solver is used. The simulations of the developed models are performed on the high-performance computer (HPC) of the Advanced Research Information System (ARIS) of the Greek National Infrastructures for Research and Technology (GRNET) on 10–20 thin nodes of 20 cores and 56 GB memory[32].
2.2 Exploiting BW dynamics
2.2.1 A single BW
To identify the optimal vertical focusing position on the Z-axis, a parametric study is performed for the case of a single laser pulse irradiating the H gas-jet. This numerical study provides the gas compression of a single BW and delivers the reference compression factor (Cref) for comparison with the cases of multiple BWs, which follows in the next sections. The laser pulse interacts with the H gas-jet at Y = 250 μm. There, the initial peak density is 8.73
A close look at the computational results shown in Figures 1(a) and (b) plotted within the grid of the domain indicates that the fine grid (AMR level = 5) results in smooth colour-map interpolations versus the coarse grid, initially used at t = 0 ns (AMR level = 3). As expected, Figure 1(b) shows that the maximum H density values appear at the lower left quadrant of the cylindrical BW. It must be noticed that in the generated BW of Figure 1(a), the well-known ‘carbuncle phenomenon’, originally reported by Peery and Imlay[33], is clearly observed. This numerical instability leads to the characteristic deformation of the shock front, when a high Mach number shock wave propagates aligned to the computational grid, even if alternative solvers were used[34–36]. The ‘carbuncle phenomenon’ diminishes when low-energy pulses are used, due to the lower BW front velocity. Furthermore, the peak H density and C do not align to the centre of the BW front. Therefore, without loss of generality, this numerical instability does not affect the simulation results of our physical models, as was also indicated in Ref. [27].
A first scan on the Z-axis is performed for a constant Y value equal to 250 μm. The H density profile lineouts of the focused beam at Z = 100, 120 and 150 μm are demonstrated in Figure 2(a) at the time when the BW front reaches the centre of the gas-jet. It is determined that the maximum C values are achieved at Z = 120 μm, and this optimal longitudinal distance is kept fixed to the simulations that follow. Figure 2(b) presents the evolution of C for Z = 120 μm. At t = 1.6 ns and Y = 200 μm, the peak value of C = 3.7 is approached, and is further decreasing with time to C = 2.7, when the shock front reaches the centre of the gas-jet. As already noted, the peak H density of the shock front is greater at the bottom left quadrant of the BW, and the same observation holds when focusing at Z = 100 and 150 μm, even if the C values remain always lower than the peak value of 3.7 at Z = 120 μm. The computed C values are close to the strong shock limit,
![]()
Figure 2.The H density profile lineouts of the focused beam at
The laser pulse energy absorption is almost zero at the focal spot and radially increases while approaching the BW front. This is attributed to the absorption coefficient of Bremsstrahlung
![]()
Figure 3.Temperatures of electrons
2.2.2 Dual BWs
Since the optimal focusing coordinates for the generation of the optimal single BW are determined, the case of dual BWs is studied, based on the findings of the previous section. The impact of the two shock fronts propagating until frontal collision is exploited for the generation of a steep density gradient, that is, density target profiles. The laser pulse is split into two identical pulses of E = 417.5 mJ each, deposited biaxially to the centre of the peak H density of the gas-jet for Y = 250 μm and Z = ±120 μm. Two geometrical setups are investigated, as Figure 4 shows, since the two laser pulses may be delivered within the gas-jet in parallel or by intersecting at an angle. In the second case, we chose to set the intersecting laser pulses at an angle of 60o. This safe choice of the angle is adopted by the models to result in comparable findings, since the same angle will be further used at the triple BWs to form an equilateral triangle. Furthermore, the experimental implementation of the intersecting laser pulses setup at 60o, is feasible and the simplest to deliver.
![]()
Figure 4.Schematic representation of the two alternative setups, in 3D and a 2D section top-view, of the generation of the dual BWs with the two laser pulses delivered (a) in parallel and (b) by intersecting at an angle of 60o.
The low energies of the two laser pulses do not significantly affect the C of the BWs. The peak densities and the propagation distance of the BWs along the Z-axis are demonstrated in Figure 5. The magenta dashed-dotted line corresponds to the single BW. The blue solid line corresponds to the BWs generated by the two parallel pulses, at the same time and distance (Y = 220 μm, Z = 120 μm). The single BW has propagated approximately 8 μm further than each of the dual BWs at t = 2.4 ns and has a peak H density only approximately 5% higher than each of the dual BWs. The H density profile, generated by the dual BW collision, is extremely steep, having ls = 6.8 μm. This steep profile structure maintains the achieved peak H density of 0.30ncr for almost 240 ps and a steep gradient, having ls ≤ 10 μm for approximately 600 ps. At 3.6 ns the peak compression C = 6.4 is achieved.
![]()
Figure 5.The H density profile lineouts of the focused beam at
The H is ionized earlier than t = 40 ps at the region where it interacts with the laser. The degree of ionization as well as the Te is demonstrated in Figure 6. At t = 3.6 ns, when the two BW fronts collide, the compressed region ionization is 5%, which was the input initial condition of the model’s ionization degree. At the region of interaction, Te = 70 eV and Ti = 17 eV, while at the BW collision region the species are in thermal equilibrium, Te = Ti = 1.2 eV.
![]()
Figure 6.The ionization degree at
In the second setup, where the dual BWs are generated by the two intersecting pulses, the compressed, near-critical density profile has significantly different features compared to the case of the parallel laser pulses. The two BWs spatially expand at an angle of 60o. The propagating BWs overlap at the intersection point of the crossing paths of the two laser pulses and their fronts collide at subsequent points along the X-axis, instead of colliding at the centre of the gas-jet. The H gas compression starts at t = 0.5 ns at the region where the two laser beams intersect (X, Z) = (–220, 0) and the compressed structure propagates along the X-direction for the rest of the simulation time. Hence, the highly compressed profile maintains its H density and steep gradient scale length for nanoseconds. The compression achieved using this setup is very efficient, having a maximum C = 10.8 that corresponds to a H density n= 0.57ncr. Figure 7 shows that the sharp-gradient H density is ls = 8.0 μm at Y = 200 μm along the Z-axis, having ls = 9.6 μm along the X-axis. It is noted that the low-density peaks that are observed in Figure 7(a) at Z = ±200 μm correspond to the shock fronts of the BWs that counter propagate outwards at the lower density region of the initial gas-jet density ramp. A compression factor higher than 7 is maintained for a long time, even more than 2.5 ns. This behaviour is favourable for proton acceleration experiments due to the large, ns-scaled time window offered for synchronization with the main laser beam. In addition, the absence of a low-density pedestal before the propagating compressed shock front is observed.
![]()
Figure 7.(a) Lineouts of the compression factor along the
It is important to note that in this setup the main fs laser pulse, which will accelerate the protons, may be delivered to the dense shaped profile either along the Z or the X direction, since these unique characteristics are maintained for nanoseconds. Figure 8(a) shows that in the setup of the two parallel beams, a high-density conical profile is formed on the XY plane, with a characteristic small thickness of a few micrometres on the Z-axis. In contrast, Figure 8(b) shows that when the laser beams are intersected at an angle of 60o, the profile is shaped to a very thin column that propagates along the X-axis, as additionally Figure 7(b) shows.
![]()
Figure 8.The H density
2.2.3 Triple BWs
The shaping of the profile generated by single and by double laser pulse setups in Sections 2.2.1 and 2.2.2 is further investigated, with respect to the H density compression. Therefore, the same ns laser pulse is here split in three pulses of 835/3 mJ each. Following the study performed for the dual BWs, two setups are again adopted to generate the triple BWs. Figure 9(a) shows the three parallel laser pulses. Two of them are set biaxially at Y = 250 μm and Z = ±120 μm, while the third one is focused at Y = 457 μm above the axis origin. The second setup of the three intersecting laser pulses, at an angle of 60o as discussed in the previous paragraph, is presented in Figure 9(b) at Y = 250 μm, forming an equilateral triangle of 378.5 μm sides, and its barycentre positioned over the axis origin. The choice of this angle secures the feasibility of the experimental setup and provides a triangularly symmetric compression of the target.
![]()
Figure 9.3D schematic representation of the two alternative setups for the generation of the triple BWs with the three laser pulses delivered in parallel (a) and by intersecting (b).
At the first setup, the initial H density at the focusing spot of the two in-plane pulses is 25% greater than the H density at the spot where the third pulse is focused. It is observed that the maximum compression is C = 9.0 and corresponds to an H density n = 0.38ncr. The evolution of the H density and C of the triple BWs, and their behaviour when they collide, is presented in Figure 10. The two BWs, generated in-plane, have the same characteristics as the BWs generated by the dual parallel BW setup (see Figure 8(b)), while the third BW forces the over-compression of the gas. The H density profile gradient is less steep, with ls = 15.0 μm. The ionization degree of the compressed region is again approximately 5%, while the electron temperature is Te = 1.2 eV.
![]()
Figure 10.H density lineouts along the
At the second setup of the triple intersecting laser pulses, the collision of the BWs takes place at a small region, shaping a cylindrical high-density profile, as Figure 11 shows. The three BWs collide 4 ns after their generation and deliver a maximum C = 13.4, which corresponds to a H density of n = 0.64ncr. Although the compression of the gas achieved is very efficient, the shaped profile has a ls = 19.0 μm and a low-density pedestal of approximately 180 μm.
![]()
Figure 11.H density lineouts along the
2.2.4 Quadruple BWs
According to the previous paragraph, the triple colliding BW shaped profile results in a higher compression, but with low scale lengths of spatial compression. Therefore, the quadruple split of the 835 mJ laser pulse is here investigated. Following the study performed for the two alternative setups before, four ns pulses are here set in parallel in pairs, at Y = 250 and 490 μm, as presented in Figure 12(a). In the second setup, the four pulses intersect perpendicularly to each other, at Y = 250 μm, as Figure 12(b) shows.
![]()
Figure 12.Schematic representation of the two alternative setups for the generation of the quadruple BWs, with the four laser pulses delivered in parallel (a) and perpendicularly, in pairs (b).
In the four parallel laser pulses setup, compression behaves similarly to the previous parallel laser pulses setups, with C = 9.7 at Y = 390 μm, and a spatial scale length ls = 9.0 μm. As Figure 13 shows, the compression geometry of the setup generates long scale length pedestals in every direction, crucial for proton acceleration by ncr mechanisms. The ionization degree at the region of BW collision is again approximately 5%, while the electron temperature is 1.12 eV, in agreement with the results presented herein.
![]()
Figure 13.H density lineouts along the
The setup of the four in-plane, perpendicularly intersecting laser pulses results in an extremely high compression, C = 24.8, that corresponds to a H density of n = 1.15ncr with ls = 6.8 μm. The density evolution is presented in Figure 14. The high compression, sharp scale length structure lives only for approximately 200 ps, although low-density pedestals do not exist, which is very beneficial for the propagation of the fs super-intense main laser pulse of the acceleration. As expected, the ionization degree at the point of compression is approximately 6%, while the Te = 1.5 eV. Due to the complicated geometry, the H density profiles are radially varying, for example, along the X- or Z-axis and a low-density pedestal exists, while in the X–Z diagonal such pedestals do not exist.
![]()
Figure 14.H density lineouts along the
2.3 BW target profile shaping performance
The profile tailoring was performed by the optical shaping of one to four simultaneous Sedov BWs, generated by parallel or by intersecting laser pulses. The simulation results presented in Section 2.2 clearly reveal that even two BWs may deliver target profiles capable of MVA. Furthermore, the exploitation of the three and four colliding BWs reveals that even if the highest compression of the gas-jet target is delivered by the collision of many BWs and alternative setups, the two BWs collision exhibits target characteristics that are favourable for the proton acceleration experiments of our interest. In addition, the experimental setup to be developed for the generation of more than four BWs is not considered feasible or realistic.
The setup where parallel laser pulses are used demonstrates that C is not really affected by the number of BWs generated. In Figure 15(a) the blue and red points represent the C of one to four BWs generated by the parallel and the intersecting laser pulses setups, respectively. The dual BWs generated by the parallel laser pulses profile almost tripled the compression of the gas compared to the profile shaped by the single BW, but C is in a plateau. In contrast, C increases exponentially in relation to the number of BWs when the intersecting laser pulses setups are used. It must be noticed that the dual BW profile, generated by the intersecting laser pulses, provides one of the steepest-gradient H density profiles with ls = 8.0 μm along the Z-axis and ls = 9.6 μm along the X-axis. In addition, the near-critical density profile remains shaped for approximately 1.5 ns, an ideally long period that is needed for synchronization with the fs main pulse that enables the proton acceleration experiments.
![]()
Figure 15.The compression factor
The four BWs generated by the intersecting laser pulses shape the steepest-gradient scale length profiles with ls = 6.8 μm, without low-density pedestals. Figure 15(b) shows the compression factor ratio between the two alternative setups. It is observed that when more than two colliding BWs are generated, the effectiveness of the profile shaping is affected. Nevertheless, for higher H density target profiles, only the intersecting laser pulse setups overcome the stagnated compression behaviour.
The H density demanded from MVA to perform via the 45 TW fs laser pulse of the ZEUS laser is approximately 0.5ncr–2ncr, depending on the scale length of the target profile, as is thoroughly discussed in the following sections. All the aforementioned simulations are performed with an initial density of 0.05ncr (= 8.73 × 1019 cm
3 Magnetic vortex acceleration
Nowadays, MVA is considered as the most efficient proton–ion acceleration mechanism in terms of particle energy scaling with laser power[19–26]. MVA demands extremely sharp and dense gas target profiles with accurate density distributions in certain spatiotemporal domains. Therefore, to the authors’ knowledge, experimental demonstrations by Ti:sapphire high-power, fs laser systems have not yet been reported. When an intense fs laser pulse propagates in an under-dense gas, the ncr density regions can be penetrated and ponderomotively expel electrons, thus creating a low electron density channel into the gas target. Therefore, a positively charged region behind the pulse is formed, since the ion’s response time is very slow. The laser pulse accelerates the electrons in its wake as it propagates through the channel in a thin electron filament that results in a strong electric current, while the cold electrons of the channel walls propagate backwards and generate a return current. As a result, a strong azimuthal quasistatic magnetic field is generated and stays confined in the channel. The propagation of the pulse through the channel is approximated by the propagation of an electromagnetic (EM) field into a waveguide. As the laser pulse penetrates the dense region and escapes from the rear of the target, the confined magnetic field starts to expand in the transverse direction, generating a strong longitudinal electric field, which accelerates the protons (H+) and the ions. The findings presented in Section 2 provide the details needed for the optical shaping of the target profiles and, moreover, the optimal spatiotemporal parameters demanded for the perfect synchronization of the accelerating main fs laser pulse of ZEUS.
The interaction of the ZEUS main pulse with the steep gradient, near-critical density target profile is simulated by the PIC code EPOCH[37,38]. The standard PIC method is implemented using the Boris pusher and the Yee solver, and the current density is computed by the Villasenor and Buneman scheme. The 3D models are developed in a domain of size 80 μm × 40 μm × 40 μm, discretized by 1600 × 400 × 400 cells[19,26]. Unionized H gas is considered, following the results of the MHD simulations presented in Section 2. The field ionization module of EPOCH is switched on and the H ionization energy is set to be 13.6 eV. Furthermore, up to four macroparticles per cell, of the fifth particle shape function order, are considered for the simulations to converge[38]. Further increase of the number of macroparticles and cells significantly increases the computational demands, while the computed energy of the accelerated particles is not affected due to convergence to reliable results by means of physics, computational and runtime demands. The density distribution of the particles resulting from the MHD simulations is
The criteria for the best compression and the absence of the low-density pedestal are set to select the best H density profile shape, as discussed in Section 2. Therefore, the profile shaped by the quadruple BWs is selected and introduced to the 3D PIC model for the MVA simulations. Demonstrative PIC simulation results show that the H+ acquire their maximum kinetic energy before 500 fs. The main characteristics of the accelerated proton beam, as well as the dimensions of the waveguide at t = 600 fs, are shown in Figures 16(a) and 16(b), where isosurface contours are used to plot the H+ density. The inner diameter of the waveguide is approximately 8 μm. The proton and electron energy spectra are shown in Figure 16(c) at t = 600 fs, where the cut-off proton kinetic energy is approximately 16.5 MeV. The maximum proton energy scales with the laser power
![]()
Figure 16.Ionized H+ density (
4 Conclusions
In this work, the over-compression of gas-jet targets into near-critical density steep gradient slabs of a few micrometres thickness is investigated to deliver optically shaped optimal density profiles for MVA. Seven setups of ns laser pulses are appropriately focused, after a parametric scan, on the optimal positions inside the gas-jet. BWs are generated and their features upon collision are explored. The setup of four perpendicularly intersecting pulses delivers an extreme compression of C = 24.8 eliminating the need of further increasing the number of BWs. The efficiency of the proposed target shaping method for MVA is demonstrated for the fs main pulse of the ZEUS laser by a PIC simulation.
The generation and performance of the colliding BWs is studied for dual, triple and quadruple ns laser pulse setups with reference to a single BW. The FLASH code simulation results of the MHD models identify that the split of the ns laser pulse energy, even to four pulses, does not significantly affect the efficiency of each individually generated BW. The profile, optically shaped by the dual parallel ns laser pulses, delivers a significantly higher compression (C = 6.4) compared to the single BW, while the dual intersecting laser pulse setup delivers a compression 4.4 times more efficient (C = 10.8). Furthermore, the optically shaped profile by the dual intersecting ns laser pulses maintains its sharp-gradient H density for more than 2.5 ns in contrast to the few hundreds of ps of the profiles shaped by the parallel laser pulse setups. This long living profile is favourable for proton acceleration experiments, due to the large, nanosecond-scale, temporal window offered for synchronization with the main laser beam. A slightly higher compression (C = 9.0) is achieved by the triple parallel ns laser pulse setup shaped profile, but its efficiency is not improved. The triple intersecting ns laser pulse setup delivers a compression C = 13.4, with a sharp scale length free of low-density pedestals, which is very beneficial for the propagation of the fs super-intense main laser pulse of the acceleration. The collision of the quadruple BWs, generated by the parallel ns laser pulses setup, does not significantly increase the compression (C = 9.7) and, furthermore, long scale length pedestals exist in every direction. The setup of four perpendicularly intersecting pulses delivers an over-compression of C = 24.8 with a sharp scale length ls = 6.8 μm. This profile does not include low-density pedestals, and maintains its compression for a period of approximately 200 ps.
A 3D PIC model is developed in the EPOCH PIC code to simulate the MVA proton acceleration on the steepest and more compressed profile density target determined (C = 24.8). The simulation results agree with the laser power scaling law[19] and with the analytical model of Bulanov et al.[20,21], since accelerated proton energies of approximately 16.5 MeV are computed. The influence of the 3D density target profiles on MVA, when the transverse density gradients are considered, will be further studied in detail in the near future.
This numerical study identified the optimal optical shaping parameters to be implemented under the experimental campaign at the IPPL[39]. The high-density gas-jet target will be delivered by a Haskel air-driven hydrogen gas booster, model 86997-ATEX (AGT-62/152 modified for hydrogen service), which is able to support 1000 bar of backing pressure, along with a Clark Cooper Solenoid valve EX30- 041-D024-HY. A Q-smart 850 Nd:YAG laser will be used for the generation of the BWs in a vacuum chamber of 60 cm diameter. This setup will be installed in the main vacuum chamber of 1.5 m diameter where ZEUS laser pulses will irradiate the near-critical density target. The fs TW laser pulse of ZEUS will be focused on the gas target using a 15 μm focal length and a 30o off-axis parabola, which is capable of focusing to a 3 μm FWHM focal spot. In parallel, computational research of the efficiency and limitations of the dual intersecting ns laser pulse setup, which was found to be promising and favourable for our experimental campaign plans, will be performed. This setup was found to be capable of delivering an efficient compression of the gas-jet target within a ns-scaled time window, which is identical for synchronization with the ZEUS main fs laser pulse. The influence of the density target profiles on MVA, including the transverse density gradients, will be also explored. Various angles of the intersecting laser pulses and different gas densities will be parametrically modelled and simulated for the identification of the parameters that will maximize the time window within the optically shaped profile while maintaining its compression.
References
[1] M. Roth, T. E. Cowan, M. H. Key, S. P. Hatchett, C. Brown, W. Fountain, J. Johnson, D. M. Pennington, R. A. Snavely, S. C. Wilks, K. Yasuike, H. Ruhl, F. Pegoraro, S. V. Bulanov, E. M. Campbell, M. D. Perry, H. Powell. Phys. Rev. Lett., 86, 436(2001).
[2] M. H. Key, R. R. Freeman, S. P. Hatchett, A. J. MacKinnon, P. K. Patel, R. A. Snavely, R. B. Stephens. Fusion Sci. Technol., 49, 440(2006).
[3] U. Linz, J. Alonso. Phys. Rev. ST Accel. Beams, 10, 094801(2007).
[4] V. Malka, S. Fritzler, E. Lefebvre, E. d’Humières, R. Ferrand, G. Grillon, C. Albaret, S. Meyroneinc, J.-P. Chambaret, A. Antonetti, D. Hulin. Med. Phys., 31, 1587(2004).
[5] E. L. Clark, K. Krushelnick, J. R. Davies, M. Zepf, M. Tatarakis, F. N. Beg, A. Machacek, P. A. Norreys, M. I. Santala, I. Watts, A. E. Dangor. Phys. Rev. Lett., 84, 670(2000).
[6] E. L. Clark, K. Krushelnick, M. Zepf, F. N. Beg, M. Tatarakis, A. Machacek, M. I. K. Santala, I. Watts, P. A. Norreys, A. E. Dangor. Phys. Rev. Lett., 85, 1654(2000).
[7] F. Wagner, O. Deppert, C. Brabetz, P. Fiala, A. Kleinschmidt, P. Poth, V. A. Schanz, A. Tebartz, B. Zielbauer, M. Roth, T. Stöhlker, V. Bagnoud. Phys. Rev. Lett., 116, 205002(2016).
[8] I. J. Kim, K. H. Pae, I. W. Choi, C.-L. Lee, H. T. Kim, H. Singhal, J. H. Sung, S. K. Lee, H. W. Lee, P. V. Nickles, T. M. Jeong, C. M. Kim, C. H. Nam. Phys. Plasmas, 23, 070701(2016).
[9] I. Prencipe, J. Fuchs, S. Pascarelli, D. W. Schumacher, R. B. Stephens, N. B. Alexander, R. Briggs, M. Büscher, M. O. Cernaianu, A. Choukourov, M. De Marco, A. Erbe, J. Fassbender, G. Fiquet, P. Fitzsimmons, C. Gheorghiu, J. Hund, L. G. Huang, M. Harmand, N. J. Hartley, A. Irman, T. Kluge, Z. Konopkova, S. Kraft, D. Kraus, V. Leca, D. Margarone, J. Metzkes, K. Nagai, W. Nazarov, P. Lutoslawski, D. Papp, M. Passoni, A. Pelka, J. P. Perin, J. Schulz, M. Smid, C. Spindloe, S. Steinke, R. Torchio, C. Vass, T. Wiste, R. Zaffino, K. Zeil, T. Tschentscher, U. Schramm, T. E. Cowan. High Power Laser Sci. Eng, 5, e17(2017).
[10] F. Sylla, M. Veltcheva, S. Kahaly, A. Flacco, V. Malka. Rev. Sci. Instrum., 83, 033507(2012).
[11] T. Nakamura, S. V. Bulanov, T. Z. Esirkepov, M. Kando. Phys. Rev. Lett., 105, 135002(2010).
[12] P. Puyuelo-Valdes, J. L. Henares, F. Hannachi, T. Ceccotti, J. Domange, M. Ehret, E. d’Humieres, L. Lancia, J.-R. Marquès, X. Ribeyre, J. J. Santos, V. Tikhonchuk, M. Tarisien. Phys. Plasmas, 26, 123109(2019).
[13] T. Ditmire, T. Donnelly, A. M. Rubenchik, R. W. Falcone, M. D. Perry. Phys. Rev. A, 53, 3379(1996).
[14] Y. Fukuda, A. Y. Faenov, M. Tampo, T. A. Pikuz, T. Nakamura, M. Kando, Y. Hayashi, A. Yogo, H. Sakaki, T. Kameshima, A. S. Pirozhkov, K. Ogura, M. Mori, T. Z. Esirkepov, J. Koga, A. S. Boldarev, V. A. Gasilov, A. I. Magunov, T. Yamauchi, R. Kodama, P. R. Bolton, Y. Kato, T. Tajima, H. Daido, S. V. Bulanov. Phys. Rev. Lett., 103, 165002(2009).
[15] L. Willingale, S. P. D. Mangles, P. M. Nilson, R. J. Clarke, A. E. Dangor, M. C. Kaluza, S. Karsch, K. L. Lancaster, W. B. Mori, Z. Najmudin, J. Schreiber, A. G. R. Thomas, M. S. Wei, K. Krushelnick. Phys. Rev. Lett., 96, 245002(2006).
[16] D. Haberberger, S. Tochitsky, F. Fiuza, C. Gong, R. A. Fonseca, L. O. Silva, W. B. Mori, C. Joshi. Nat. Phys., 8, 95(2012).
[17] O. Tresca, N. P. Dover, N. Cook, C. Maharjan, M. N. Polyanskiy, Z. Najmudin, P. Shkolnikov, I. Pogorelsky. Phys. Rev. Lett., 115, 094802(2015).
[18] N. P. Dover, N. Cook, O. Tresca, O. Ettlinger, C. Maharjan, M. N. Polyanskiy, P. Shkolnikov, I. Pogorelsky, Z. Najmudin. J. Plasma Phys., 82, 415820101(2016).
[19] J. Park, S. S. Bulanov, J. Bin, Q. Ji, S. Steinke, J.-L. Vay, C. G. R. Geddes, C. B. Schroeder, W. P. Leemans, T. Schenkel, E. Esarey. Phys. Plasmas, 26, 103108(2019).
[20] S. S. Bulanov, V. Y. Bychenkov, V. Chvykov, G. Kalinchenko, D. W. Litzenberg, T. Matsuoka, A. G. R. Thomas, L. Willingale, V. Yanovsky, K. Krushelnick, A. Maksimchuk. Phys. Plasmas, 17, 043105(2010).
[21] S. S. Bulanov, E. Esarey, C. B. Schroeder, W. P. Leemans, S. V. Bulanov, D. Margarone, G. Korn, T. Haberer. Phys. Rev. ST Accel. Beams, 18, 061302(2015).
[22] S. V. Bulanov, T. Z. Esirkepov. Phys. Rev. Lett., 98, 049503(2007).
[23] A. V. Kuznetsov, T. Z. Esirkepov, F. F. Kamenets, S. V. Bulanov. Plasma Phys. Rep., 27, 211(2001).
[24] J. Psikal. Plasma Phys. Control. Fusion, 63, 064002(2021).
[25] S. V. Bulanov, D. V. Dylov, T. Z. Esirkepov, F. F. Kamenets, D. V. Sokolov. Plasma Phys. Rep., 31, 369(2005).
[26] A. Sharma, A. Andreev. Laser Particle Beams, 34, 219(2016).
[27] S. Passalidis, O. C. Ettlinger, G. S. Hicks, N. P. Dover, Z. Najmudin, E. P. Benis, E. Kaselouris, N. A. Papadogiannis, M. Tatarakis, V. Dimitriou. High Power Laser Sci. Eng., 8, e7(2020).
[28] J-R. Marquès, P. Loiseau, J. Bonvalet, M. Tarisien, E. d’Humières, J. Domange, F. Hannachi, L. Lancia, O. Larroche, P. Nicolaï, P. Puyuelo-Valdes, L. Romagnani, J. J. Santos, V. Tikhonchuk. Phys. Plasmas, 28, 023103(2021).
[29] J. Bonvalet, P. Loiseau, J.-R. Marquès, E. Atukpor, E. d’Humières, J. Domange, P. Forestier-Colleoni, F. Hannachi, L. Lancia, D. Raffestin, M. Tarisien, V. Tikhonchuk, P. Nicolaï. Phys. Plasmas, 28, 113102(2021).
[31] C. Beylerian, S. Saugout, C. Cornaggia. J. Phys. B, 39, L105(2006).
[32] https://hpc.grnet.gr/. https://hpc.grnet.gr/
[33] K. Peery, S. Imlay24th Joint Propulsion Conference. and , in (), p. 2904.(1988).
[34] A. W. Cook, M. S. Ulitsky, D. S. Miller. Int. J. Comput. Fluid Dyn., 27, 32(2013).
[35] N. Fleischmann, S. Adami, X. Y. Hu, N. A. Adams. J. Comput. Phys., 401, 109004(2020).
[36] N. Fleischmann, S. Adam, N. A. Adams. J. Comput. Phys., 423, 109762.
[37] T. D. Arber, K. Bennett, C. S. Brady, A. Lawrence-Douglas, M. G. Ramsay, N. J. Sircombe, P. Gillies, R. G. Evans, H. Schmitz, A. R. Bell, C. P. Ridgers. Plasma Phys. Control. Fusion, 57, 113001(2015).
[38] I. Tazes, J. F. Ong, O. Tesileanu, K. A. Tanaka, N. A. Papadogiannis, M. Tatarakis, V. Dimitriou. Plasma Phys. Control. Fusion, 62, 094005(2020).
[39] E. L. Clark, A. Grigoriadis, S. Petrakis, I. Tazes, G. Andrianaki, A. Skoulakis, Y. Orphanos, E. Kaselouris, I. Fitilis, J. Chatzakis, E. Bakarezos, V. Dimitriou, E. P. Benis, N. A. Papadogiannis, M. Tatarakis. High Power Laser Sci. Eng., 9, e53(2021).

Set citation alerts for the article
Please enter your email address
© Copyright 2018-2021 | Chinese Laser Press. All Rights Reserved 沪ICP备15018463号-20