


 View fulltext
Xue WANG, and Xiubin LI
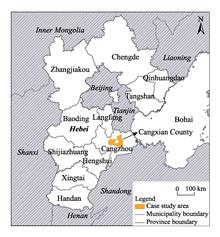
Land fragmentation is widely known to have an impact on farm performance. However, previous studies investigating this impact mainly focused on a single crop, and only limited data from China are available. This study considers multiple crops to identify the impact of land fragmentation (LF), as well as cropping system (CS), on farm productivity and the efficiency of grain producers in the North China Plain (NCP), using Cangxian County of Hebei Province as an example. Detailed household- and plot-level survey data are applied and four stochastic frontier and inefficiency models are developed. These models include different sets of key variables in either the production function or the inefficiency models, in order to investigate all possibilities of their influences on farm productivity and efficiency. The results show that LF plays a significant and detrimental role, affecting both productivity and efficiency. A positive effect is evident with respect to the CS variable, i.e., multiple cropping index (MCI), and the wheat-maize double CS, rather than the maize single CS, is usually associated with higher farm productivity and efficiency. In addition to LF and CS, four basic production input variables (labor, seed, pesticide and irrigation), also significantly affect farmers’ productivity, while the age of the household head and the ratio of the off-farm labor to total labor are significantly relevant to technical inefficiency. Policies geared toward the promotion of land transfer and the rational adjustment of cropping systems are recommended for boosting farm productivity and efficiency, and thus maintaining the food supply while mitigating the overexploitation of groundwater in the NCP.
Nov. 30, 2020Vol. 11 Issue 6 580 (2020)
Hao CHENG, and Hualin XIE
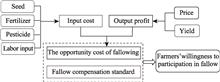
After operating for four years, the fallow project in the groundwater funnel area of the North China Plain has produced an initial water-saving effect. However, groundwater funnel remediation is a long-term process, and grain price changes over time may affect farmers’ willingness to participate in fallow. Based on the estimation by the Cobb-Douglas production function, the relationship between farmers’ satisfaction with fallow compensation and planting income is analyzed based on survey data collected from farming households in Hebei, a typical province located in the groundwater funnel area. Using this data, the impact of wheat price changes on farmers’ willingness to participate in fallow is simulated. The results indicate wheat price changes affect farmers' expected planting income and consequently their willingness to fallow; 88% of farmers would be unwilling to participate in fallow with a 0.1 yuan per 500 g increase in the wheat price, whereas 71.4% of farmers would be willing to participate in fallow with a 0.2 yuan per 500 g decrease in the price. Finally, some policy implications are proposed, such as the recommendation that the fallow compensation should be adjusted according to the wheat price multiplied by the average wheat yield of the three years before fallow in the North China Plain.
Nov. 30, 2020Vol. 11 Issue 6 589 (2020)
Shiyin CHEN, and Zhiyu MA
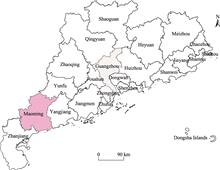
Improving the level of intensive cultivated land use is an important measure to ensure food security and promote the sustainable development of the regional society and economy. Based on data from the statistical yearbook of Maoming City and its counties and districts from 2005 to 2018 and the land use change database of Maoming City for 2018, this study constructed an evaluation index system for four aspects: cultivated land use intensity, cultivated land use degree, cultivated land output benefit and cultivated land sustainable use status. The level of intensive use of cultivated land in Maoming City from 2004 to 2017 was evaluated by AHP, the range method and the comprehensive evaluation model, and its temporal and spatial characteristics were evaluated. The results revealed three major points. (1) The intensive use of cultivated land in Maoming City in the past 14 years was good, and its level showed an overall upward trend, with the intensive use degree of cultivated land rising from 0.4045 in 2004 to 1.3148 in 2017. (2) The levels of intensive use of cultivated land in each county and district of Maoming City were generally on the rise, with no significant differences between them. However, according to the regional distribution, the intensive use level of cultivated land was highest in Maonan District, while it was relatively low in Dianbai County. The largest increase in the level of cultivated land intensive use was in Gaozhou, and the smallest was in Dianbai County. (3) According to the existing problems of cultivated land utilization in Maoming City, combined with the current international and domestic measures to effectively improve the level of intensive use of cultivated land, four suggestions are put forward: to improve the efficiency of cultivated land utilization and effectively protect basic farmland; to improve the overall urban planning and rationally adjust the layout of construction land; to raise farmers’ awareness of the intensive use of cultivated land; and to increase agricultural investment and improve agricultural infrastructure.
Nov. 30, 2020Vol. 11 Issue 6 598 (2020)
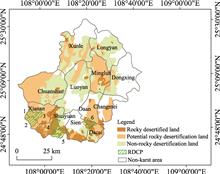
Mengyu ZHANG, Li ZHANG, Xiaoli REN, Honglin HE, Yan LV, Junbang WANG, and Huimin YAN
Karst areas in southwest China have experienced significant land cover and land use change (LUCC) due to utilization for human activity and a comprehensive rocky desertification control project (RDCP) since 2008. It is important to quantify the effect of LUCC on ecosystem productivity in this region for assessing the overall benefit of this ecological restoration project. In this study, we used using MODIS land cover and NPP products to investigate the relative contribution of LUCC to the change in net primary productivity (NPP) during 2008-2013 in Huanjiang County, one of first one hundred pilot counties to implement RDCP. Our results show that NPP increased in 95.53% of the county, and the average growth of NPP in non-rocky desertification area was higher than in rocky desertification or potential rocky desertification areas. LUCC has an important contribution (25.23%) to the NPP increase in the county, especially in the LUCC area (70.97%), which increased the average NPP by 3.9% and 10.5%, respectively. Across the six RDCP regions in the county, the average increase in NPP for the vegetation restoration measure of governed karst area is significantly greater than in the ungoverned karst area, and the positive change in NPP increased with the increasing implementation area of the vegetation restoration measure.
Nov. 30, 2020Vol. 11 Issue 6 606 (2020)
Qingqing LIU, and Hu YU
Functional zoning is an important guarantee for regulating the land use intensity of national parks and maintaining the integrity and stability of natural ecosystem. In this paper, we tease out of the functional zoning models and methods based on the empirical analysis of the world national parks, and then take the Qianjiangyuan National Park (QNP) as an example, study the functional zoning method based on ecological sensitivity. Results show that, the goal of national park construction in the world is changing from enhancing national cohesion to displaying the national image, from the pure natural protection and recreation use to protection of the comprehensive function of natural ecosystem integrity protection, recreation, environmental education, etc. The establishment of QNP is to protect the natural ecosystem of sub-tropical lowland broad-leaved evergreen forest, also to meet the community development and recreational consume of large population in Eastern China. So this paper establishes an evaluation index system based on ecological sensitivity, combining ecosystem services, potential habitats of important species, and development opportunities. Based on the analysis result, the functional zoning of QNP can be divided into strict protection area, ecological conservation area, traditional using area and recreational area. In this way, it can make the functional partition reflect system controls thought in area difference and space layout, and take the corresponding management measures in different functional areas, to promote the sustainable evolution of the natural ecological system in national park.
Nov. 30, 2020Vol. 11 Issue 6 617 (2020)
Fei LONG, and He ZHU
Homestay tourism has begun to flourish throughout the country, becoming a model of tourism innovation and upgrading, and attracting increasing amounts of capital. Through the collection and analysis of tourist questionnaire data for key cities in the Yangtze River Delta, and based on the theory of tourists' perceived value,18 factors related to the perception of homestay tourism are examined. Through exploratory factor analysis, three main factors of facilities and environment perception, cultural experience perception and service value perception are extracted. Then, from the perspectives of each of these perceptions, this study determines the degree of support for homestay tourism development in the Yangtze River Delta, obtains the key factors that affect the development of homestay tourism, and constructs a structural equation model of tourist perception and the degree of homestay tourism support. By calculating the regression path of the structural equation, the standardized path coefficients of the facilities and environment perception, cultural experience perception and service value perception are found to be 0.724, 0.813 and 0.692, respectively. These three factors have a significant impact on the development of homestay tourism agglomeration. Positive facilities and environmental perception can effectively support the development of homestay tourism, while the cultural experience perception provides its basic condition, and the service value perception constitutes an important factor of homestay tourism development. To better guide the development of homestay tourism, attention must be paid to developing the tourism facilities and environment, to cultivating tourism cultural experiences, and to improving of tourism service value.
Nov. 30, 2020Vol. 11 Issue 6 624 (2020)

Hui TAO, Jing GAO, and Kaiqiang CHEN
In a society dominated by tourism consumption, space changes occurring in rural areas can generally reflect their social changes. On the theoretical basis of flow, regeneration and adaptation of rural tourism space, this paper originally and creatively proposes that the spatial elements in a rural tourist area can be classified into three categories: Attractions (A), Towns (T) and Villages (V). By analyzing the spatial transformation characteristics of A, T and V, five types of rural spatial transition modes are found, the types of heritage, theme park, those serving as scenic spots, leisure industrial clusters and ecotourism areas. These different classes emerge due to their geographical differentiation. They show the same spatial evolution trend: The Attractions are distributed throughout the whole area and characterized by diversification; supporting services facilities gather in the Towns; and the Villages are landscape images. In this area the traditional rural benefit trends toward that of compound development. Mufu Town, Hubei province, is taken as a study case, and the changing characteristics of A, T and V from 2006 to 2016 are described. Problems in the process of establishing the new spatial order are considered. In order to realize the synergy between production space, living space and ecological space, the interactive development between Attractions, Towns and Villages is recommended. The perspective of Attraction-Town-Village (ATV) can lead to a better understanding of the situation of tourism space in rural areas and provide directions for thinking about the reconstruction path for the modernization of traditional societies.
Nov. 30, 2020Vol. 11 Issue 6 633 (2020)
Yang ZHONG, Aiwen LIN, Zhigao ZHOU, Lijie HE, and Moxi YUAN
The construction of the Silk Road Economic Belt and the 21st Century Maritime Silk Road are important measures for allowing China to expand its opening up to the outside world under the background of economic globalization. Based on this consideration, and from the perspective of geo-economics, this study uses a variety of mathematical statistical methods to analyze the economic development status and differences among the 30 countries along the Belt and Road. In addition, the correlations between GDP, population and carbon emissions in these countries are also analyzed. The results show that the current economic development levels of the countries along the Belt and Road are quite variable; the gaps between the indicators of the economic development of the countries along the Belt and Road are convergent; the GDP, population, and carbon emissions of the countries along the Belt and Road each showed an overall upward trend during the study period, and the changes in these three values showed significant correlations. Across all countries, the correlation coefficients between GDP and population (0.989), between GDP and carbon emissions (0.995), and between population and carbon emissions (0.993), all indicate that the correlations between GDP, population and carbon emissions are very high. Among them, GDP has the highest correlation with carbon emissions, reaching 0.995. Regression analysis shows that the value of R2 reached 0.995, indicating that the regression fitting effect is very good and the calculation result is highly reliable. Based on these results, this paper proposes the following two suggestions: (1) Promoting the Belt and Road initiative should handle the relationship between developing and developed countries; and (2) Promoting the Belt and Road initiative should also be linked to China's domestic regional development strategy.
Nov. 30, 2020Vol. 11 Issue 6 539 (2020)
Qinlin XIAO, Chao TIAN, Yanjun WANG, Xiuqing LI, and Liming XIAO
In the decisive stage of developing of a moderately prosperous society in all aspects, hazy weather has become a major obstacle to the further advancement of China. Therefore, improving the level and efficiency of haze governance has become essential. Based on the DPSIR model, this paper builds a haze governance level and efficiency index system using the entropy method and the super-efficiency data envelope-analysis (DEA) model to analyze the data for 31 cities in North China from 2007 to 2016. From the aspects of spatial differences and influence factors influencing the comparative analysis, the results are as follows. (1) During the investigation period, the level and efficiency of city haze governance in North China showed a trend of fluctuation and decline, with obvious stages in their characteristics. Haze governance efficiency is much higher than its level, and its mean value reaches the DEA level which indicates that it is effective. (2) A significant regional gradient difference occurs between these two aspects. The haze governance level presents a convex distribution pattern of “east low-middle high-west low”, while the haze governance efficiency presents a concave distribution pattern of “east high-middle low-west high”. (3) The regression results show that economic growth has a negative effect on both haze governance level and efficiency. By contrast, the industrial structure has a positive effect on haze governance level and efficiency, but the significance of its effect on these two is different. On this basis, policy suggestions are proposed for improving the level and efficiency of haze governance in various cities in North China.
Nov. 30, 2020Vol. 11 Issue 6 549 (2020)
Xiaochang CAO, Xiaojie LIU, Shengkui CHENG, Yao LIU, and Panpan ZHANG
Currently, the topic of food waste and its environmental impacts is attracting increasing attention among academic researchers. Based on an investigation of restaurants in Beijing, this study analyzes the quantities, structures, characteristics and costs of the agricultural resources related to food waste in the catering industry in Beijing. The results show that: (1) The average food waste per capita per meal is about 75.02 g (raw) for food away from home among Beijing urban residents, which means that about 10.52% of the food is wasted. (2) According to the quantitative ranking of different categories of food waste, vegetable is the most wasted, followed by meat, aquatic products, and grains. The foods in the other categories are wasted much less. (3) Food waste is affected by the restaurant type, as well as the number, gender, age, education level, and consumption motivation of the consumers. (4) Based on the estimated food waste per capita, about 417.92 thousand tons of food is wasted annually at the consumption stage in the catering industry in Beijing. This food waste amount is equivalent to approximately 765.53 tons of cereals which are wasted, and this represents 79.66% of cereals production and 13.15% of cereals consumption in Beijing. Estimated by the required land use, this amount of food waste means that the total production of approximately 166.12 thousand ha of arable land is being wasted in Beijing.
Nov. 30, 2020Vol. 11 Issue 6 562 (2020)
Sheng GAO, Lin ZHAO, Huihui SUN, Guangxi CAO, and Wei LIU
With the rapid development of the marine economy, the demand for marine resources development and the pressure on marine environmental protection are gradually increasing. It is critical to evaluate and analyze the driving forces of marine sustainable development in order to promote the coordinated development of the marine economy, resources and environment. Taking Jiangsu Province of China as an example, this paper constructs an evaluation index system for marine sustainable development from the three aspects of marine economy, resources and environment, and calculates the weight of the variation coefficient for each indicator. Based on the grey relational model, the average value of the relational degree, calculated by the average value method of correlation coefficients and the weighting method, is then used to evaluate the status of marine sustainable development in this province. The comprehensive index model is used to analyze the dynamic trend of the evolution of marine sustainable development. The driving forces of marine sustainable development are analyzed by the path analysis method combined with the average values of the grey relational degree for each indicator. This analysis found that the marine sustainable development in 2016 and 2012 was good, the situation in 2007 was bad, and the remaining years were intermediate. Compared with the previous years, the optimal conditions of 2008 and 2012 were obvious. The main driving factors of marine sustainable development are cargo throughput of coastal ports, economic losses caused by storm surges in coastal areas, the area of marine nature reserves in coastal areas, coastal wind power generation capacity, and marine biodiversity.
Nov. 30, 2020Vol. 11 Issue 6 570 (2020)
© Copyright 2018-2021 | Chinese Laser Press.
All Rights Reserved 沪ICP备15018463号-20