


Please enter the answer below before you can view the full text.
8+7=

Identifying metro trip purpose using Smart Card Data (SCD) is important to expand the application of SCD in transport research and transport planning. This paper integrates different types of big data and combines the theories on the interaction between transport and land use. By taking Beijing as a case, we firstly analyze the metro trip purposes of individual passengers using travel survey data from 5565 respondents. Secondly, we investigate the land use features of trip origin and destination using Point of Interest(POI) data . Thirdly, a metro trip dataset is developed which includes the information of trip purpose, trip duration, and spatial distribution of trip origin and destination. Fourthly, a Random Forest (RF) algorithm is used to establish a RF classifier using the metro trip dataset as training data. Finally, this trained classifier is used to classify each metro trip recorded by the SCD to identify the metro trip purpose and the spatial distribution of metro trips for different purposes. The results of analysis show that the random forest classifier trained in this study can effectively identify metro trip purposes from SCD. For trips with "go to work" and "go home" purposes, the accuracy of identification can reach over 90%. One reason for the high identification accuracy is that land use information is included in the RF classifier. Our results confirm the theory of spatial-temporal interactions between transport and land use. There is an increasing availability of multi-source geographic big data and traffic survey data of residents in large cities, which means that the method developed in this study would have a high value in metro trip predicting and monitoring, transport planning, and land use policy-making around the metro stations. Also, our results enhance our knowledge of metro travel behavior in megacities.
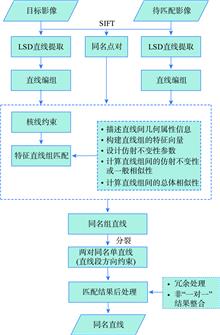
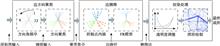
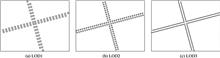
Many same or similar line features may hinder line matching in the image, matching only based on the similarity between individual line, which easily lead to the failure of the algorithm. Therefore, this paper proposed a reliable pair-wise line matching algorithm based on feature similarity constraints of geometric attributes between the lines. There are two challenges in constructing robust feature similarity constraints based on pair-wise line matching. The first challenge is to generate grouped line pairs under unstable lines extraction. This algorithm is handled by the basic geometric relationships such as distance and angle between the lines. The second challenge is to design a reliable feature descriptor robust to large viewpoint changes taking into account that the line pairs may not be coplanar and their endpoints are inaccurate. This algorithm salient not only against a range of viewpoint changes for close-range image but also large affine transformation. The construction method is described as follows. Firstly, line segments are extracted by using a line segment detector method and the corresponding points obtained by using SIFT matching points in the reference image and searching image.The algorithm generates grouped line pairs from lines extracted from the reference image and searching image according to the basic geometric relationships such as distance and angle between the lines, and it takes the grouped line pairs as matching primitives. Then the method employs the epipolar constraint to evaluate candidate line pairs. Line matching algorithm based on geometric attributes of lines for descriptor and similarity measure of line pairs are presented which is more distinctive by describing the relationship between every two pairs. The configuration of two line pairs is described by distinguishing two cases, in the first case, the similarity of the two line pairs is called as affine similarity; In another case, it is called general similarity. The affine similarity and general similarity are used as the overall similarity measure in this algorithm and are determined based on the calculated feature vectors between the target line pairs and each candidate line pairs. Instead of screening all candidate line pairs, the optimal line pairs mapping that maximizes the similarity measure between the two line pairs. Finally, the direction constraint which can provide a solution for angle transformation caused by image rotation in line pairs matching is used to perform the correspondence of individual line, it resolves the corresponding line pairs into two pairs of corresponding individual lines, and obtains one to one matching results after the post-processing of checking. Five typical groups of close-range image pairs with angle, rotation, and scale transformation are used as the experimental dataset, which is used to complete the line pairs matching experiments by the proposed algorithm. In comparison with other line matching algorithms, the proposed method can obtain more accurate line matching results in different typical close-range image pairs, and its matching ratio increased by 14.5. The experiment results demonstrate that the effect of threshold selection is weak and the algorithm is robust which achieves reliable line matching results.
The visualization of the associative relation between objects is mainly expressed by the edges of the graph. But a large number of edges will cause serious visual confusion due to the complexity of the associative relation between objects. Graph layout and edge bundling are both effective methods to solve the problem of visual confusion caused by complex edges. While the geo-location of some nodes has significant meaning, only edge bundling methods can be used to reduce the map load and reveal the potential association rules of graph. In the past, the edge bundling algorithms adjusted the position of the middle control points of the edge under the condition that the two end nodes of the edge were fixed. This would cause a large number of edges being gathered together, which would not only cause a secondary visual confusion, but also be difficult to reveal the potential rules of the graph at the node level. To solve this problem, this paper proposed a node-centered edge clustering and visualization algorithm. Firstly, the direction clustering algorithm was used to realize the clustering of direction edges. The direction clustering method proposed in this paper was about 13 times faster than K-means algorithm, and about 6 times faster than DBSCAN algorithm. Then, the interpolation of the control points was implemented for each edge. On this basis, FR model was used to prevent the occurrence of “excessive bending”. Finally, we adjusted the transparency of the edges so that the result of the visualization would be able to highlight the portion of the edge near the end nodes. The experimental results show that the value of the NCEB algorithm's map load (L) and the mid-point distance change (△d) were about half of the FDEB algorithm, which proved that the NCEB algorithm can move the binding position from the middle part of the edge to the node, thus not only solving the secondary visual confusion caused by traditional edge bundling methods, but also revealing the association rule and trend of the graph at the node level. The final distribution trend of the edge around the node was clear and readable, and the visualization result greatly reduced the map load, which effectively reduced visual errors and misunderstanding of information. The results of our experiments show that the proposed algorithm can reveal the potential associated trend of graphs at the node level and greatly reduce visual confusion.
The key characteristics of noise information are spatial propagation and distance attenuation. Traditional noise maps are dominated by two-dimensional and static representations, similar to the heat maps. The researches in the past were focused on the ways to get data or evaluating the accuracy of data, resulting that noise map visualization and noise symbols were less studied. The traditional drawing methods are usually used like color grading which makes noise maps have simple symbolic form such as flat color blocks corresponding to different values. It is difficult to show its spatial features. Thus, this paper proposed a new expression method of noise maps in three-dimensional dynamic visualization for the spatial distribution and intensity change of noise. Based on the Bertin symbol parameters, the new method integrates the characteristics of size, color in the visual variables, and the rate and order of change in the dynamic parameters, and it can convey noise information dynamically by using height-variable and color-changing square bars as noise symbols. Three-dimensional dynamic noise maps can present relevant information on different scales, and they contain corresponding symbol sizes and positioning arrangements in different map levels in order to show the multi-granularity of the maps. So as to represent the attenuation and addition of noise during propagation, gave some examples of a single-point sound source and multi-point sound sources with graphics and data, and multi-level information expression was briefly exemplified. In this paper, we simulated and expressed the road traffic noise in a certain period and area of Huangpu District, Shanghai. In addition, noise data was calculated from traffic noise models and the taxi GPS trajectory data. The specific noise map was deployed in Web browser, using the base map provided by Mapbox. As expected, the three-dimensional dynamic expression expands the performance dimension of noise data. Compared with the flat color symbols used in traditional two-dimensional noise maps, multi-parameter stereo symbols can not only accurately describe the distribution and intensity of noise, but also improve the audience's interest and concentration from the visual perception. Simultaneously, compared with the static maps which can only show the final results, the three-dimensional dynamic noise maps are able to display the processes of information changes, which could help users find subtle anomalies and provide more accurate references for noise prevention and control. Furthermore, three-dimensional dynamic noise maps proposed in this paper can provide a better visual reference for the analysis of spatial rules such as hot spots distribution and transmission trends of noise.
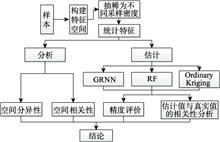
To improve the accuracy of soil organic estimation in the case of sparse samples and to construct the soil organic predictive models applying the machine learning methods, GRNN (Generalized Regression Neural Network) and RF(Random Forest). The soil was diluted into 8 samples with different sampling density (2703, 1352, 676, 339, 169, 85, 43, 22 samples) according to the soil organic matter sampling data of Daxing agricultural land in 2007 applying the MMSD (Minimization of the Mean of the Shortest Distances) criterion. GRNN (Generalized Regression Neural Network), RF (random forest) and Ordinary Kriging are applied to predict each sampling density espectively. Cross Validation is used to verify the prediction accuracy of unknown samples at each sampling density. With the decrease of sampling point density, the spatial correlation between sampling points decreases gradually, thus the semivariogram's fitting precision deteriorates, the errorofprediction point result increases, and the confidence of the prediction decreases. The spatial correlation between sampling points is close to disappear when the sample is diluted under 43 and 22 samples, and the coefficient of determination of the semivariogram function is low and the residual is large. The impacts the Ordinary Kriging receives, which are from the changes in the number of the sampling points, sampling density and spatial structures of samples is obvious. The prediction accuracy of the method decreases with the decrease of the number of sampling points. There is no significant correlation between the predicted values and the observed values at or below 85 sampling points. The prediction accuracy of GRNN and RF is almost independent of the sampling density. The predicted values fluctuate within a certain threshold space around the observed values, and has good correlation. At sampling points of 85 and below, the prediction accuracy is greatly improved compared with Ordinary Kriging. Ordinary Kriging is not suitable for spatial interpolating calculation in the case of sparse samples, especially in the case of weak spatial correlation. The machine learning models can fully learn the environmental information and spatial proximity information of soil sampling points. They combine attribute similarity and spatial correlation and have better stability and adaptability, not being easy to be affected by the number of sampling points, configuration and sampling density, and can make stable and accurate predictions even when the spatial autocorrelation between sampling points is very weak.
Grasslands are one of the most widely distributed land cover vegetation types across the globe. They play a significant role in developing animal husbandry, protecting biodiversity, maintaining soil and water, and keeping ecological balance. Estimating grassland production, a fundamental variable in grassland resource management, is helpful to measure grassland productivity and diagnose its health status. In recent years, the combination of remote sensing and ground measurements into models has become an important method of estimating grassland production. Normally, large number of measurements are required for remote sensing modeling. Mongolia is an example of a traditional grassland animal husbandry country with the largest per capita grassland area in the world and is also part of the China-Mongolia-Russia Economic Corridor under the “Belt and Road” initiative. Constrained by multiple factors of overseas sampling, it is usually difficult to obtain sufficient, accurate, and evenly distributed production samples. Thus, the accuracy of estimation models will be affected. Until now, there is still no effective solutions to get more samples. In this study, a 200-kilometer buffer zone along the China-Mongolia Railway (Mongolia) was taken as the study area. Given the inhomogeneity of grassland distribution and the correlation between the samples, the Point estimation model of BSHADE (P-BSHADE) was introduced. We derived the grassland production dataset in the study area from 2000 to 2019 based on the sample measurements and interpolated samples, and a combination of Normalized Difference Vegetation Index (NDVI), Enhanced Vegetation Index (EVI), and Net Photosynthesis (PsnNet) for remote sensing modeling. Our method extrapolated sparse and unevenly distributed sampling points to supplement ground information by spatial interpolation, and used both the measured sample points and interpolated sample points for modeling. Six types of linear models and exponential models were established using above three vegetation indices. Our results show that the accuracy of the optimal model was 80%, higher than that from previous studies. The spatial pattern and interannual variation of grassland production estimated in our study were consistent with previous studies, which further confirmed the accuracy of our results and the feasibility of the interpolation method. Using interpolation method to optimize the data source is an entirely new attempt that improve the accuracy of the model estimation, which could be potentially applied to other overseas regions to monitor grassland resources.
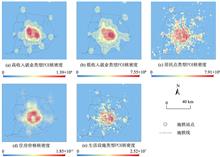
Using the data of China's land use right assignmentons from 2003 to 2018, the paper visualized the spatial distribution, source, and use of land right assignment, and analyzed the spatial characteristics. The methods of the research included the nuclear density analysis, nuclear density analysis, Getis-Ord, and spatial visualization. The results are as follows: (1) From 2003 to 2013, the growth rate of land use rights assignment in China was remarkable. The growth rate of the total land use rights assignment slowed down after 2013, but the income of land use rights assignment continued to grow, and it showed changing characteristics from quantity to value. (2) The growth of land for roads and transportation facilities, greenland and square was more prominent; the land use for residential commercial, public management and public service facilities was stable; while the growth rate of land for industrial, logistics, storage, and public facilities began to slow down and showed a contraction trend. There were significant differences in the sources of land use right assignment between 2003 and 2018. The main source was the new construction, while the utilization rate of the redevelopment of the stock land was low, and the blind outward expansion was not conducive to the new urbanization construction. (3) From 2003 to 2018, the land use right assignment showed a "point-line-surface" spatial pattern, forming a multi-core, hierarchical layer structure. Over time, the core of nuclear density had shifted from north to south and from west to east, with high concentration of core cities, dense peripheral cities, and sparse districts/counties". Among them, different land uses also presented different spatial evolution characteristics. After the growth rate of industrial land use right assignment expanded from the northeast region to the whole country, it gradually contracted to the coastal urban agglomerations in East China, and presented the spatial evolution characteristics of “from ordinary cities to provincial capitals, and from provincial capitals to cities around provincial capitals.” The land area for residential uses was that the provincial capitals drove the growth of surrounding cities to a certain extent, and gradually shrunk to the central cities of South and East China. Commercial land use right assignment was relatively stable; there was no shrinkage, and the growth rate was relatively balanced. The coverage of other construction land use right assignment areas was relatively balanced, which also reflects the relatively balanced allocation of resources for infrastructure construction in China.
Urbanization is an important indicator of regional economic development and social progress. Studying urbanization level is of great significance to urban scientific development and efficient decision-making for government. The night light data contains information on human activities and economic and social development, which makes up for the uncertainties and lags of the index method. It can more intuitively reflect the level of urbanization and provide new ideas for urbanization research. Existing studies have used night light data to analyze the macro-scale urbanization level, but because the time ranges of the DMSP-OLS data and NPP-VIIRS data are short, the time scales of the two data are discontinuous, and the spatial resolution is inconsistent with the radiation resolution, so it is mainly focused on the use of a kind of night light data to study the level of urbanization, and the study time span is short. In addition, although studies have shown that there is a strong correlation between large-scale socio-economic activities and nighttime lighting conditions, at a smaller scale, this correlation is greatly affected by regional economic development and the resolution of light data. There are higher requirements for estimation accuracy, so it is necessary to use actual data to prove the rationality of using night light data to estimate county-level urbanization levels. This paper uses DMSP-OLS and NPP-VIIRS night light data to estimate the county-level urbanization level in Anhui Province from 2006 to 2015, and provides theoretical support for night light data in the study of long-term serial urbanization. First, calculate the average night light index of DMSP-OLS and NPP-VIIRS respectively, and take the NPP-VIIRS light index as the independent variable and the DMSP-OLS light index as the dependent variable. Fit and establish the corresponding relationship between the two types of lighting data, and obtain the DMSP-OLS average night light index of each district and county in Anhui Province from 2006 to 2015.Then urbanization indicators are selected from the four aspects of population, economy, social life and agricultural mechanization, using analytic hierarchy process to calculate the level of urbanization based on statistical data. Finally, the correlation and linear regression analysisbetween light index and urbanization level based on statistical data is analyzed to show the consistency of time and space distribution oflightintensity and urbanization level based on statistical data in all districts and counties of Anhui Province. The results show that the average nighttime light index highly correlatesto urbanization level based on statistical data at the county level with the correlation coefficient of 0.91(PR2=0.82. The spatial and temporal distribution of the light index and the urbanization level based on statistical data are basically the same. Spatially, the overall urbanization level in Anhui Province is unevenly distributed, showing a pattern of high in east and low in west; temporally, the urbanization level from 2006 to 2015 showed year by year. The urbanization level of developed urban areas such as Hefei City and Maanshan City is growing faster, while less developed areas such as Huoqiu County and Shou County are growing slowly.
Exploring the spatial extent of urban development within acounty is helpful to clarify the spatial relationships between urban land, permanent farmland, and ecological land, which lays an important foundation for the urban sustainable development of a county. Currently, the urban growth boundaries, and the existing permanent farmland and ecological protection boundaries have great conflicts with each other in different maps. Based on the new territory land spatial planning system, it is necessary to realize the "Three-Line Coordination" during territory land planning. However, the existing models of the delimitation of UGBs are highly subjective. The determination of the weight of each factor is usually subject to artificial influence, or only considers the dominant land use type without considering the other land use types. Thus, the simulation results of small-scale land use changes greatly differ from the actual results in the surrounding area. In this paper, we presented a delimitation method of urban development boundary based on the "Three-Line Coordination" and FLUS-UGB.We selected the Feng County in Jiangsu, China, as the study area where agriculture was the main development direction. Under the scenario of permanent farmland protection and ecological control, we delimited the urban development boundaries of Feng County. Our results show that: (1) the overall accuracy of the model was 94.7%, and the kappa coefficient was 0.895, which demonstrated the high simulation accuracy of our method; (2) under the baseline scenario, the spatial pattern of urban area presented a expansion trend. Under the scenario of cultivated land protection and ecological control, the urban area expanded outwards radially outside the permanent farmland and ecological control areas with an orderly manner; (3) the predicted area of urban development in Feng County would increase to 80.29 km2 in 2035 with the growth rate of 69.07%. The boundary results predicted in our study can be used to effectively avoid the occupation of permanent farmland and important ecological land regions by urban development, leading toa better spatial coordination between urban expansion, and existing permanent farmland and ecological land protection in future. Moreover, our delimitation method of the urban growth boundary simulation was based on the "Three-Line Coordination", which met the demand of permanent farmland and ecological landprotection, and thus can reflect the urban land expansion of Feng County more accurately.
As earth observation enters the big data era, the traditional data management technology has often become insufficient in meeting research needs. As a new open source earth observation data management and analysis platform, Open Data Cube (ODC) is suitable for high-performance computing and exploratory data analysis of time series data. It's an important technical support platform for Asia-Oceania Global Earth Observation System of Systems (AOGEOSS). However, few attempts have been made on domestic satellite imagery data management using ODC. The current ODC lacks automated data organization tools for China's satellite imagery. Therefore, this paper took the domestic GF-1 imagery as an example to explore the automated management of domestic imagery data under the ODC framework by developing middleware called ODC_GFTool. The middleware's development environment is .NET Framework 4.0, which supports the current mainstream Windows 10 operating system. Based on GDAL, YamlDotNet and other components, ODC_GFTool achieves spectral information, band information, spatial reference, and other contents from high-resolution image files. In addition, with the strong matrix computing ability of the Matlab software, ODC_GFTool realizes high score image processing and visualization through mixed programming. The main processes of importing domestic satellite data into ODC using ODC_GFTool include defining GF-1 image products, building indexes, and ingesting data. For demenstration, the paper took Poyang Lake as the test area and did an experimental water extraction. Results show that ODC has obvious efficiency advantage compared with traditional data processing tools. The use of ODC for domestic satellite imagery management increased the storage space by 7.2% and reduced the processing time to one third of the traditional methods. In addition, compared to Google Earth Engine and EarthServer, ODC has the following advantages: (1) ODC supports localized database storage, considering the security of some satellite imagery, data storage and computing need to be local, not in the cloud. (b) As an open source earth observation data management framework, ODC facilitates integration and secondary development according to actual project requirements. Research on ODC data management and application for domestic satellite imagery not only can enrich new ways of domestic image data management in China and increase the practical application value of ODC in the world, but also promote international cooperation and respond to the national earth observation infrastructure construction.
:The integration of Airborne LiDAR data and aerial imagery is useful in data interpretation, land monitoring, and 3D reconstruction. As the first step of these tasks, the geometric registration of the two types of data should be conducted to ensure their alignment. The alignment is sometimes difficult because of differences in their data acquisition mechanisms. The LiDAR data is more reliable and more accurate on smooth surfaces like grounds, walls, and roofs which are difficult to extract from aerial imagery. LiDAR points are mostly sparser than the pixels on aerial images. Considering that the a priori ranging error (1~5 cm) of airborne LiDAR data is usually much smaller than the average point distance (10~50 cm), this paper introduced a plane-constrained block adjustment model to align the two types of data, where the planes were obtained by the intersection of corresponding junction structures. The planar constraints were implemented by forcing surrounding LiDAR points to be on the planes. The proposed block adjustment model is a mixture of the conventional POS-aided and self-calibrated bundle adjustment model and two more types of observing equations. One is the distance between image junction structure observations, and reprojection of the spatial junction structure should be zeros. The other is the normal distance between LiDAR points, and the spatial planes obtained by junction structure should be zeros. In this paper, firstly junction structures in object space were solved based on least squares theory. Then, conjugate planes of junction structures in LiDAR points were detected automatically. Finally, the aerial images block adjustment under constraints of junction structure was performed to obtain the precise interior and exterior orientation parameters. The experimental results showed that both the horizontal and the vertical accuracy of the proposed method could reach 1~2 pixels of the aerial images, which was obviously better than the building-corner-based method. In order to probe into the influence of point cloud density, the LiDAR points were thinned randomly before the geometric registration. The results showed that the accuracy of the proposed method was not influenced but the accuracy of building-corner-based method decreased when the point cloud density decreased, especially the horizontal accuracy. In conclusion, the proposed method takes the advantage of the high-ranging accuracy of LiDAR data to reach high registration accuracy and avoids the influence of the point cloud density. When the density of the LiDAR point cloud is low, a high registration accuracy can be reached using the proposed method.
Tropospheric delay error in synthetic aperture radar interferometry can affect DEM accuracy. This study adopts wavelet multi-scale correlation analysis to reduce the influence of tropospheric delay error on DEM estimation. This method is based on the wavelet multi-resolution analysis theory and the frequency characteristics of different components in differential interference phases. Firstly, the wavelet decomposition reconstruction RMS error rate is used to determine the decomposition layers. The terrain residual phase and noise phase are reduced to extract the frequency band where the troposphere delayed error phase is located. Secondly, we quantify the correlation between tropospheric delay error phase and DEM in radar coordinates and further down-weight the correlated coefficients. Lastly, the differential interferogram is reconstructed which reduces the influence of elevation-related tropospheric delay in InSAR. In this study, the ENVISAT ASAR data in Yima, Henan province are processed using the method proposed in this study. The differential interferogram with tropospheric delay error corrected are obtained to estimate elevation. The estimated tropospheric delay phase correlated with elevation is consistent with the topographic changes. Results show that the standard deviation of DEM error compared to Aster GDEM decreases from 30.7 m to 26.37 m, which indicates an increased accuracy of InSAR DEM.
Until now, relatively few researches of aerosols retrieval have been conducted using domestic satellite remote sensing. To promote domestic satellite remote sensing applications, a set of rapid inversion technology of Aerosol Optical Depth (AOD) using remote sensing was developed in this study based on FY-3D/MERSI2 data, which combined the advantages of Dark Target (DT) and SARA algorithm. Firstly, the empirical relationship of surface reflectance in traditional Dark Target algorithm was introduced to get the red and blue band surface reflectance. Then, the relationships between aerosol optical thickness, asymmetry factor, and single scattering albedo in red and blue bands were established using long time-series ground observation data from AERONET. Finally, MOD04 and AERONET AOD products were used to validate and evaluate the inversion results. Results show that the AOD retrieved from MERSI2 in this study not only kept the spatial consistency with the MODIS aerosol product, but also presented a reasonable distribution of high AOD values, which improved the AOD inversion in cloud and bright target areas where values were missing in MOD04 aerosol product. Meanwhile, compared with ground-based observations, the proposed algorithm also demonstrated a higher accuracy with an average correlation coefficient greater than 0.85 at the 470nm band. These two methods showed a strong linear correlation at blue band. Finally, the spatial and temporal distribution of aerosols during a heavy pollution in Beijing, Tianjin, Hebei, and surrounding areas from March 9 to March 14 in 2018 was completely captured using MERSI2, which indicated that FY3D satellite was able to monitor aerosols and could provide a reference for haze monitoring and early warning in China. This study provides important reference significance for the development and application of domestic satellites in atmospheric remote sensing business.
Elm sparse forest is a special vegetation type in Hunsh and ake sandy land. It has important significance for maintaining the stability of regional ecosystem, and plays a key role in sand fixation, water conservation and climate regulation. Rapid and accurate access to the distribution of elm sparse forest is conducive to the protection of the fragile ecosystem in the area. In this paper, the automatic recognition methods of elm sparse forest in high spatial resolution data source was studied by using Unmanned Aerial Vehicle(UAV) image and GF-2 image. After processing the original images of UAV, the Digital Ortho photo Map and the Canopy Height Model were obtained. The preprocessing of GF-2 data included atmospheric correction, ortho-rectification, image fusion et al. In the object-based method, firstly, the optimal segmentation scale was obtained by calculating the change rate of local variance in the image objects; Secondly, the importance of the selected features was sorted by the random forest algorithm, and the irrelevant features were deleted; Finally, the parameters of three classifiers, namely, Support Vector Machine(SVM), Random Forest(RF) and Deep Neural Network(DNN), were optimized, and then they were used to identify the elm sparse forest. In addition, based on the Tensor Flow framework in ENVI 5.5, a deep learning model based on U-Net was constructed to identify elm sparse forest. The results showed that: (1) through the optimization of the object-based method process, the final recognition accuracy was improved than the privious study. In GF-2 image, the overall accuracy of SVM was 90.14%, the overall accuracy of RF was 90.57%, and the overall accuracy of DNN was 91.14%. In UAV image, the overall accuracy of SVM was 97.70%, and the overall accuracy of RF and DNN were 97.42%.(2) In the deep learning method, the overall accuracy of the GF-2 image was 91%, and the overall accuracy of the UAV image reached 98.43%. The results illustrated that UAV image can achieve higher accuracy than GF-2 image in elm sparse forest recognition because of its higher spatial resolution, richer texture and shape information. Object-based method had high applicability for both kinds of images, and the accuracy of three classifiers were similar.The deep learning method was more suitable for UAV image in this paper, it can effectively reduce the misclassification phenomenon in UAV image.In the future, a higher quantity and quality sample database should be constructed to further improve the accuracy of deep learning method and provide support for the management and research of elm sparse forest.
Productivity of grasslands in northern China plays an important role in regional carbon-water cycle and the development of agriculture and husbandry. Normalized Difference Vegetation Index (NDVI) has been widely used as an indicator of net primary productivity. However, it still remains unclear about the consistency among numerous NDVI datasets in characterizing the spatial and temporal dynamics of grasslands in Northern China. In this study, taking MODIS NDVI as a benchmark dataset, three NDVI datasets (MODIS NDVI, GIMMS NDVI, and SPOT NDVI) were used to compare and analyze the spatial and temporal consistency of NDVI in the grassland of northern China from 2000 to 2015. The most suitable NDVI datasets were selected to reveal the spatial and temporal patterns of NDVI in the study area. Our results show that in terms of the inter-annual variability and changing trend, GIMMS NDVI and MODIS NDVI presented high consistency over the entire grassland area, especially in alpine grassland area including alpine meadow, alpine grassland, alpine desert, and part of temperate grassland area (i.e., desert steppe), with correlation coefficients of 0.60, 0.47, 0.51, and 0.74 respectively. While SPOT NDVI values were much higher than those of the other two datasets, especially in alpine grasslands on Qinghai-Tibet Plateau, with a higher NDVI of 0.15 on average, which implied that caution should be taken when using SPOT NDVI to analyze vegetation dynamics or model productivity in alpine grasslands. GIMMS NDVI and SPOT NDVI displayed relatively high consistency in both temporal variability and changing trend in part of typical and meadow steppes, with correlation coefficients of 0.85 and 0.60, respectively, however, all the three NDVI datasets were highly consistent in their variation ranges in this area, with differences of NDVI less than 0.06. Based on GIMMS NDVI datasets, i.e. the one with the longest time series and highest consistency with MODIS NDVI, we further analyzed the spatial and temporal patterns of NDVI in the study area. We found that NDVI increased generally from 1982 to 2015, with 25% of grassland areas (mainly in temperate grassland area) being significant (p<0.05). There was no significant change of NDVI for the entire alpine grassland area though a significant decreasing trend occurred in a small proportion of the region. Our study has implications for model communities to select datasets and provides an advanced understanding of the responses of vegetation to future climate change in the grassland of northern China.