


 View fulltext
Yansui LIU, Yuzhu ZANG, and Yuanyuan YANG
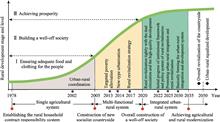
The urban-rural transformation from dichotomy to integration is a gradual process. Like rural areas in many countries, Chinese rural society is experiencing a decline in all spheres due to depopulation, aging, lack of economic opportunity, and so on. Aiming at solving the serious rural issues, China proposed the implementation of a rural revitalization strategy and the promotion of an integrated urban-rural development for the first time in 2017. This proposal marks the transformation of the urban-rural relationship, and the integrated urban-rural development reflects a significant conceptual change. Researches on issues of rural decline are urgently needed to determine the most effective method for rural revitalization and development from the perspective of the urban-rural dynamics. In this context, this paper focuses on studying the theory, technology and management of rural revitalization and development. We construct a theoretical framework for urban-rural integration based on population-land-industry-right between the urban and rural systems, regarding land engineering for land capacity building as the technical support and the rural land system reform and reconstruction as the policy support for management. This research will provide theoretical support for the implementation of China’s rural revitalization strategy.
Dec. 25, 2020Vol. 30 Issue 12 1923 (2020)
Tao LI, Jiaoe WANG, Jie HUANG, and Xingchuan GAO
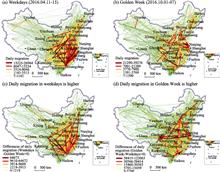
A largely unexplored application of “Big Data” in urban contexts is using human mobility data to study temporal heterogeneity in intercity travel networks. Hence, this paper explores China’s intercity travel patterns and their dynamics, with a comparison between weekdays and holidays, to contribute to our understanding of these phenomena. Using passenger travel data inferred from Tencent Location Big Data during weekdays (April 11-15, 2016) and National Golden Week (October 1-7, 2016), we compare the spatial patterns of Chinese intercity travel on weekdays and during Golden Week. The results show that the average daily intercity travel during Golden Week is significantly higher than that during weekdays, but the travel distance and degree of network clustering are significantly lower. This indicates temporal heterogeneity in mapping the intercity travel network. On weekdays, the three major cities of Beijing, Shanghai, and Guangzhou take prominent core positions, while cities that are tourism destinations or transportation hubs are more attractive during Golden Week. The reasons behind these findings can be explained by geographical proximity, administrative division (proximity of cultural and policy systems), travel distance, and travel purposes.
Dec. 25, 2020Vol. 30 Issue 12 1943 (2020)
Zhiming FENG, Chiwei XIAO, Peng LI, Zhen YOU, Xu YIN, and Fangyu ZHENG
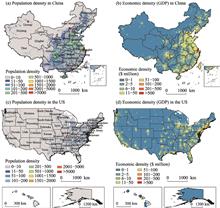
Investigating the spatio-temporal transmission features and process of novel coronavirus disease 2019 (COVID-19) mitigation strategies are of great practical significance to understand the development of COVID-19 and establish international cooperation for prevention and control. In this paper, the cumulative number of confirmed cases, number of confirmed cases per day and cumulative number of deaths, were used to compare transmission paths, outbreaks timelines, and coping strategies of COVID-19 in China and the US. The results revealed that: first, the COVID-19 outbreaks in both China and the US exhibited a 6-week initiation stage. In China, the COVID-19 erupted in late January. It lasted only a short period of time and was almost completely contained within 6-8 weeks. But the COVID-19 erupted in early March in the US and was still in the peak or post-peak stage. Second, in China, the COVID-19 emerged in Wuhan and spread to other regions of Hubei Province and then nationwide, exhibiting a cross(“+”)-shaped of spread with Wuhan city as the center. Importantly, the COVID-19 in China had a large concentration and there were no national outbreaks. In contrast, the COVID-19 in the US first spread through New York and the western and eastern coasts but has since emerged throughout the entire country. Third, the lack of emergency response planning in both countries in the early stage (about 6-week) hampered COVID-19 prevention. However, actively high-pressure prevention and control measures were used to basically control COVID-19 in early March in China. And then China has gradually resumed business and production activities. Unfortunately, the US government missed the best opportunity to contain the epidemic. Faced with the choice between economic recovery and coronavirus containment, the US removed the quarantine and restriction measures too early. The COVID-19 is continuing to spread in the country and blossom everywhere, still showing no signs of receding.
Dec. 25, 2020Vol. 30 Issue 12 1963 (2020)
Yuyao YE, Changjian WANG, Hong’ou ZHANG, Ji YANG, Zhengqian LIU, Kangmin WU, and Yingbin DENG
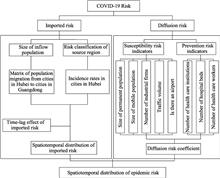
Population migration, especially population inflow from epidemic areas, is a key source of the risk related to the coronavirus disease 2019 (COVID-19) epidemic. This paper selects Guangdong Province, China, for a case study. It utilizes big data on population migration and the geospatial analysis technique to develop a model to achieve spatiotemporal analysis of COVID-19 risk. The model takes into consideration the risk differential between the source cities of population migration as well as the heterogeneity in the socioeconomic characteristics of the destination cities of population migration. It further incorporates a time-lag process based on the time distribution of the onset of the imported cases. In theory, the model will be able to predict the evolutional trend and spatial distribution of the COVID-19 risk for a certain time period in the future and provide support for advanced planning and targeted prevention measures. The research findings indicate the following: (1) The COVID-19 epidemic in Guangdong Province reached a turning point on January 29, 2020, after which it showed a gradual decreasing trend. (2) Based on the time-lag analysis of the onset of the imported cases, it is common for a time interval to exist between case importation and illness onset, and the proportion of the cases with an interval of 1-14 days is relatively high. (3) There is evident spatial heterogeneity in the epidemic risk; the risk varies significantly between different areas based on their imported risk, susceptibility risk, and ability to prevent the spread. (4) The degree of connectedness and the scale of population migration between Guangdong’s prefecture-level cities and their counterparts in the source regions of the epidemic, as well as the transportation and location factors of the cities in Guangdong, have a significant impact on the risk classification of the cities in Guangdong. The first-tier cities - Shenzhen and Guangzhou - are high-risk regions. The cities in the Pearl River Delta that are adjacent to Shenzhen and Guangzhou, including Dongguan, Foshan, Huizhou, Zhuhai, Zhongshan, are medium-risk cities. The eastern, northern, and western parts of Guangdong, which are outside of the metropolitan areas of the Pearl River Delta, are considered to have low risks. Therefore, the government should develop prevention and control measures that are specific to different regions based on their risk classification to enable targeted prevention and ensure the smooth operation of society.
Dec. 25, 2020Vol. 30 Issue 12 1985 (2020)
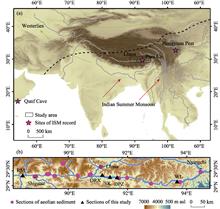
Tuoyu LI, Jifeng ZHANG, Yongqiu WU, Shisong DU, Duowen MO, Yinan LIAO, Zhitong CHEN, Jianbao LIU, and Qing LI
Widespread aeolian deposits on the Tibetan Plateau (TP) have provided valuable palaeoclimatic information. However, the primary factors (e.g., climate factors, human activity, and vegetation cover) controlling aeolian deposition remain elusive. In this paper, we use a dataset that comprises new and published ages of Holocene aeolian sand and loess in the middle reaches of the Yarlung Zangbo River to identify the primary controlling factors and palaeoclimatic implications of aeolian deposition. Several intervals of enhanced aeolian accumulation centered at 8.5-7.8, 6.4-5.8, 4.5-4.0, 3.1-1.8, and 0.9 ka are identified, generally consistent with regional low rainfall events and weak Indian summer monsoon (ISM). This suggests that regional wetness, dominated by the ISM, may play a key role in modulating dust emissions and aeolian deposition on centennial timescales. Our results show that on centennial- to millennial-scales, ISM activity can be reconstructed by non-continuous aeolian deposits in the monsoon dominated TP.
Dec. 25, 2020Vol. 30 Issue 12 2002 (2020)
Guodong LI, Junhua ZHANG, Parham A. MIRZAEI, Shengyan DING, Yapeng DING, and Man LIU
Land use and land cover (LULC) alteration has changed original energy balance and heat fluxes between land and atmosphere, and thus affects the structure characteristics of temperature and humidity fields over urban heterogeneous surfaces in different spatio-temporal scales. Lanzhou is the most typical river valley city of China, it is chosen as the case study. Typical river valley terrain, rapid urbanization and severe air pollution have caused unique urban climate and urban heat island (UHI) effects in Lanzhou. Firstly, the spatial structure characteristics and dynamic evolution of temperature and humidity fields in autumn are simulated by mobile measurement experiment and GIS spatial analysis method. The results show that temperature and humidity fields have significant dynamic change within a day, and have multiple center and multiple intensity level characteristics. Then, LULC and normalized difference vegetation index (NDVI) are extracted from remote sensing images, the distribution patterns of temperature and humidity fields have close relationships with LULC and NDVI. Moreover, there is a significant positive correlation between impervious surface area and thermal field intensity. A positive correlation between NDVI value and humidity field intensity has been found as well as a negative correlation between NDVI value and thermal field intensity. Finally, heat fluxes and energy balance characteristics between ground and atmosphere are analyzed based on the Bowen-ratio System experiments. This study could provide theoretical support and practical guidance for urban planning, urban eco-environment construction and air pollution prevention of river valley city.
Dec. 25, 2020Vol. 30 Issue 12 2015 (2020)

Yanjun WANG, Baosheng WU, and Deyu ZHONG
To understand the non-equilibrium morphological adjustment of a river in response to environmental changes, it is essential to (i) accurately identify how past conditions of water and sediment have impacted current morphological adjustment of the river, and (ii) establish a corresponding simulation for non-equilibrium conditions. Based on discharge and suspended sediment concentration (SSC) as well as 82 cross-sectional data items for the Huayuankou-Lijin reach of the Lower Yellow River in the period 1965-2015, the process of adjustment of the geometry of the main channel (area, width, depth, and geomorphic coefficient), and its responses to changes in discharge and SSC for different reaches are statistically analyzed. Following this, a delayed response model (DRM) of the geometry of the main channel subjected to variations in discharge and SSC is established using a multi-step analytical model, with the discharge and SSC as the main controlling factors. The results show that the area, width, and depth of the main channel decreased initially, then increased, decreased again, and finally increased again. These features of the geometry of the channel were positively correlated with the 4-year moving average discharge and negatively with the 4-year moving average SSC. The geomorphic coefficient for the Huayuankou-Sunkou reach exhibited a trend of decrease, whereas that of the Sunkou-Lijin reach decreased initially, then increased, decreased again, and finally increased again. Except for the Huayuankou-Gaocun reach in 1965-1999, the coefficient was negatively correlated with the 4-year moving average discharge and positively with SSC. The simulated values of the morphological parameters of the main channel for all sub-reaches obtained using the DRM agreed well with the measured values. This indicates that the DRM can be used to simulate the process of response of the cross-sectional geometry of the main channel to variations in the water and sediment. The results of the model show that the adjustment of the geometry of the main channel was affected by the discharge and the SSC at present (30%) as well as for the previous 7 years (70%). The proposed model offers insights into the mechanism whereby past water and sediment influence the current morphological adjustment of the river, and provides an effective method for predicting the magnitude and trend of the geometry of the main channel under different flow conditions.
Dec. 25, 2020Vol. 30 Issue 12 2033 (2020)
Yongyong ZHANG, Qiutan CHEN, and Jun XIA
Flood is one of the severest natural disasters in the world and has caused enormous causalities and property losses. Previous studies usually focus on flood magnitude and occurrence time at event scale, which are insufficient to contain entire behavior characteristics of flood events. In our study, nine behavior metrics in five categories (e.g., magnitude, duration, timing, rates of changes and variability) are adopted to fully describe a flood event. Regional and interannual variations of representative flood classes are investigated based on behavior similarity classification of numerous events. Contributions of geography, land use, hydrometeorology and human regulation on these variations are explored by rank analysis method. Results show that: five representative classes are identified, namely, conventional events (Class 1, 61.7% of the total), low discharge events with multiple peaks (Class 2, 5.3%), low discharge events with low rates of changes (Class 3, 18.1%), low discharge events with high rates of changes (Class 4, 10.8%) and high discharge events with long durations (Class 5, 4.1%). Classes 1 and 3 are the major flood events and distributed across the whole region. Class 4 is mainly distributed in river sources, while Classes 2 and 5 are in the middle and down streams. Moreover, the flood class is most diverse in normal precipitation years (2006, 2008-2010 and 2015), followed by wet years (2007, 2013-2014), and dry years (2011 and 2012). All the impact factor categories explain 34.0%-84.1% of individual flood class variations. The hydrometeorological category (7.2%-56.9%) is the most important, followed by geographical (1.0%-6.3%), regulation (1.7%-5.1%) and land use (0.9%-2.2%) categories. This study could provide new insights into flood event variations in a comprehensive manner, and provide decision-making basis for flood control and resource utilization at basin scale.
Dec. 25, 2020Vol. 30 Issue 12 2053 (2020)
Chunla LIU, Liping WU, Mei XU, Fanchao ZENG, and Lipeng JIAO
Since 2007, the Chinese government has initiated the building of national eco-cultural protection areas (NECPAs), thereby embarking on a signi?cant transformation of the model of intangible cultural heritage (ICH) protection in China. To understand the origin and outputs of this policy, this paper demonstrates the context of China’s NECPAs. It proposes a conceptual NECPA framework that mainly features regional overall ICH protection. This is followed by an examination of the case of Xiangxi in Western Hunan as a pilot zone for China’s eco-cultural protection. Xiangxi has performed much related work to promote NECPAs and made great progress in regional overall ICH protection. This insight suggests that there are bene?ts and costs associated with promotion of China’s NECPAs and regional overall ICH protection. Despite the advantages of institutional innovation, the unexpected side effects actually undermine the success of plan implementation.
Dec. 25, 2020Vol. 30 Issue 12 2076 (2020)
© Copyright 2018-2021 | Chinese Laser Press.
All Rights Reserved 沪ICP备15018463号-20